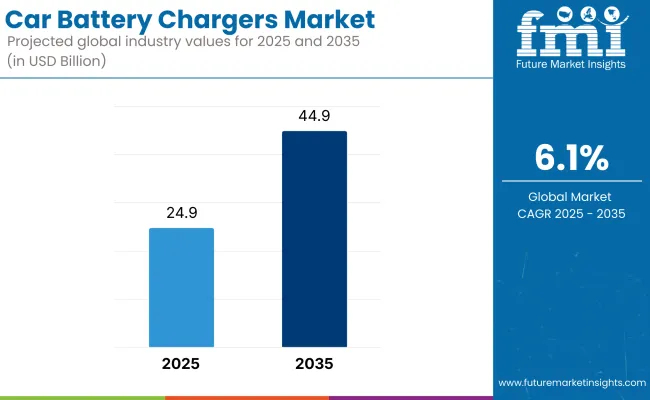
The global car battery chargers market is expected to grow from USD 24.9 billion in 2025 to USD 44.9 billion by 2035. The market is poised to expand at a 6.1% CAGR during the forecast period. The market is witnessing strong growth as increasing vehicle ownership and the rising adoption of electric vehicles (EVs) drive demand for efficient battery charging solutions.
Car battery chargers have become essential consumer accessories, as awareness of battery maintenance and longevity grows among individual vehicle owners and fleet operators. The market is also supported by the expansion of the automotive aftermarket, where service centers and retailers promote battery care products as part of preventive maintenance services. The surge in demand for smart and portable charging devices is further strengthening the market’s relevance in modern mobility ecosystems.
Additionally, the market is being driven by significant advancements in charger technology and product innovation. Manufacturers are developing energy-efficient chargers equipped with connectivity features such as Bluetooth, app-based monitoring, and adaptive charging algorithms to meet evolving consumer expectations. The rise of collaborations between charger brands and automotive OEMs is expanding market reach, especially within the fast-evolving EV segment.
The increasing demand for high-capacity, fast, and smart charging solutions is fueling innovation in both residential and commercial applications. The growing emphasis on battery health optimization is encouraging the development of chargers designed to extend battery life cycles, supporting sustainability goals within the automotive sector.
Furthermore, the global car battery chargers market is likely to witness sustained momentum beyond 2035, driven by advancements in battery technology and global electrification trends. The emergence of solid-state batteries and next-generation energy storage systems is likely to spur demand for compatible charging solutions. Additionally, the rise of connected vehicles and smart grids is likely to accelerate development of bidirectional chargers supporting vehicle-to-grid (V2G) capabilities.
Government regulations across key regions, including the European Union’s Green Deal directives, the USA NEVI program, and China’s EV standards, are fostering innovation, ensuring safety, and promoting energy efficiency in battery chargers. As transportation systems worldwide shift toward electrification, car battery chargers are poised to remain vital components of sustainable mobility ecosystems.
The market is segmented based on charging type, charger type, portability, battery capacity, application, and region. By charging type, the market is divided into manual charging and automatic charging. In terms of charger type, it is segmented into smart/intelligent charger, float charger, and trickle charger.
Based on portability, the market is categorized into plug-in charger and portable charger. By battery capacity, the market is divided into up to 12V, 12V-48V, and above 48V. Based on application, the market is categorized into garage and personal use. Regionally, the market is classified into North America, Latin America, East Asia, South Asia Pacific, Western Europe, Eastern Europe, and the Middle East and Africa.
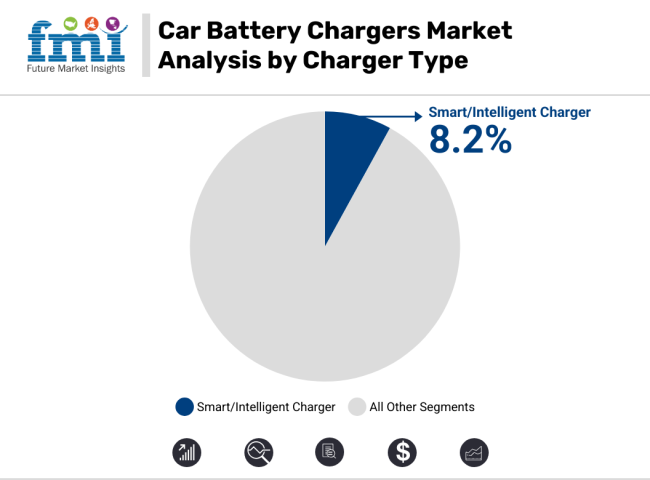
The smart/intelligent charger segment is projected to grow at the fastest CAGR of 8.2% from 2025 to 2035. This growth is fueled by rising demand for safe, efficient, and automated charging solutions as modern vehicles adopt advanced battery technologies such as AGM, GEL, and lithium-ion. Smart chargers, equipped with microprocessor-controlled multi-stage charging and battery condition monitoring, are increasingly favored by both garage professionals and personal users.
The growing trend toward connected vehicles and the availability of affordable smart chargers via e-commerce channels are further accelerating adoption across North America, Europe, and Asia-Pacific.
Meanwhile, the float charger segment maintains steady growth due to its role in long-term battery maintenance. These chargers are widely used for fleet vehicles, seasonal equipment, and standby applications to prevent battery degradation. Trickle chargers remain popular for classic cars, motorcycles, and low-use vehicles, where continuous low-current charging supports battery health during extended periods of inactivity.
Overall, as vehicles become more electronics-intensive and consumers seek hassle-free charging, smart chargers will drive innovation and new market opportunities supported by advancements in connectivity, AI-driven charging algorithms, and energy efficiency.
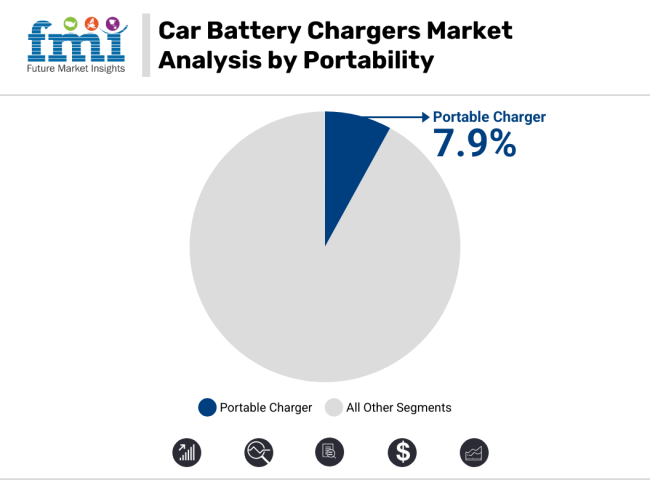
The portable charger segment is projected to grow at the fastest CAGR of 7.9% between 2025 and 2035. Demand is rising as consumers increasingly seek compact, lightweight, and travel-friendly charging solutions for both emergency use and regular battery maintenance. Portable chargers offer versatility for use across personal vehicles, motorcycles, and even marine applications.
The growing popularity of road trips, combined with a focus on vehicle self-sufficiency, is further boosting interest in portable models. Innovations such as solar-powered portable chargers, USB-C compatibility, and integrated diagnostic displays are making these products even more attractive to modern consumers.
Meanwhile, plug-in chargers continue to dominate traditional sales, particularly in garage environments and professional workshops. These chargers provide higher charging currents and often support multi-vehicle compatibility, making them the preferred choice for automotive repair shops, dealerships, and fleet operators.
However, with the trend toward mobile lifestyles and DIY automotive care accelerating, portable chargers are expected to capture an increasing share of the market. As automotive battery technologies evolve and consumer expectations shift toward on-demand convenience, the portable charger segment will remain a key driver of future market expansion.
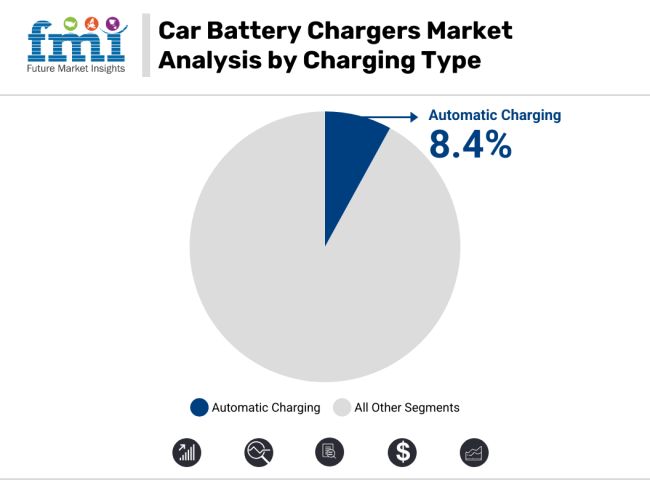
The automatic charging segment is projected to grow at the fastest CAGR of 8.4% from 2025 to 2035. This growth is driven by increasing demand for convenient, user-friendly charging solutions that require minimal intervention. Automatic chargers, integrated with microprocessor controls, automatically adjust voltage and current based on the battery’s condition, thereby optimizing charge cycles and protecting against overcharging or thermal damage.
The surge in advanced driver-assistance systems (ADAS) and start-stop vehicle technologies is creating heightened demand for reliable automatic charging solutions that can maintain battery health in high-electrical-load environments.
Meanwhile, manual charging continues to serve professional workshops, fleet operators, and DIY enthusiasts who require full control over the charging process. Manual chargers offer flexibility for custom battery setups, high-capacity batteries, and specialty vehicles, although their market share is gradually being eclipsed by the growing preference for automated solutions.
As connected vehicles and battery management systems become mainstream, automatic charging is poised to dominate future market growth. Innovations in AI-driven charge control, wireless charging, and integrated vehicle charging management are expected to further accelerate the adoption of automatic chargers across both garage and personal use segments.
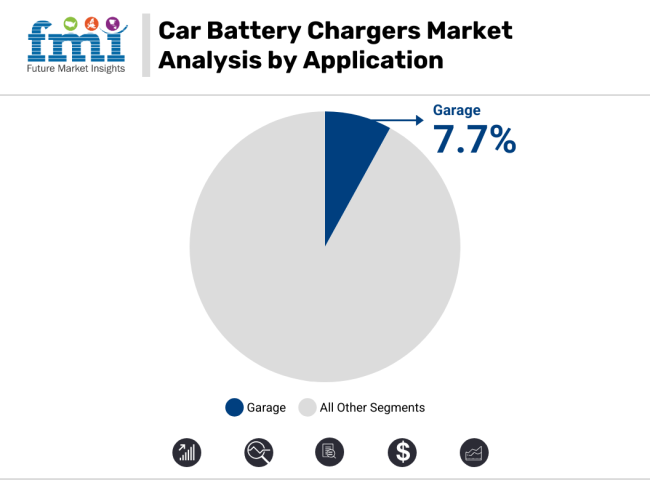
The garage segment is projected to grow at the fastest CAGR of 7.7% between 2025 and 2035. This growth is being fueled by increasing demand from professional automotive repair centers, dealerships, and fleet operators seeking high-performance chargers capable of supporting rapid charging, battery conditioning, and advanced diagnostics.
As vehicle electrical systems become more sophisticated, garages require chargers that can interface seamlessly with battery management systems and accommodate a wide variety of battery chemistries. Furthermore, the shift toward electric and hybrid vehicles is driving demand for multi-voltage and multi-mode chargers that can service both traditional and advanced vehicle platforms.
Meanwhile, the personal use segment continues to show robust growth as consumers increasingly adopt DIY vehicle maintenance practices. The growing availability of affordable smart/portable chargers through online retail is making it easier for individual vehicle owners to purchase and use chargers at home.
Additionally, increased awareness of battery maintenance to avoid breakdowns is contributing to higher adoption rates in this segment. As vehicle electrification and digitalization trends reshape the automotive landscape, the garage segment will continue to drive innovation and demand for next-generation car battery chargers.
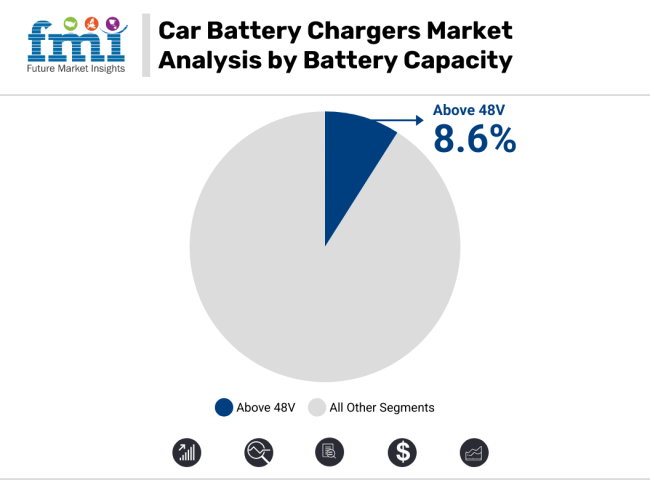
The above 48V segment is expected to grow at the fastest CAGR of 8.6% from 2025 to 2035. This growth is fueled by the increasing adoption of electric vehicles (EVs), plug-in hybrids, and advanced start-stop systems, all of which require high-capacity battery chargers. As automotive OEMs introduce a wider range of high-voltage architectures, demand for chargers that can safely and efficiently handle above 48V battery platforms is rising sharply.
Additionally, fleet operators and public transport authorities across Asia-Pacific, Europe, and North America are accelerating investments in electric buses and commercial EVs, further boosting charger demand in this segment. Advanced chargers designed for fast charging, battery balancing, and thermal management are gaining traction in both garage-based and portable configurations.
Meanwhile, 12V-48V chargers continue to dominate by volume, as this range supports the vast majority of conventional vehicles, start-stop systems, and mild hybrids. This segment remains essential for both garage and personal use applications. The up to 12V segment maintains steady demand for motorcycles, scooters, and small recreational vehicles, where compact battery formats are common. However, as vehicle electrification advances, the above 48V segment is poised to deliver the highest growth across global markets.
Challenges
High Initial Costs of Advanced Charging Solutions
One of the biggest challenges in the Car Battery Chargers Market is the high upfront cost of advanced charging solutions, particularly fast and ultra-fast chargers. The development and deployment of DC fast chargers require substantial investment in power grid upgrades and specialized infrastructure, making it costly for businesses and consumers. Additionally, smart and wireless chargers, which offer superior convenience and efficiency, are still relatively expensive compared to traditional charging units.
The affordability factor limits adoption, especially in price-sensitive markets. Moreover, manufacturers face challenges in cost-effective production while maintaining high safety and performance standards. Without significant reductions in costs or increased government subsidies, the adoption rate of premium battery charging solutions may remain slow in developing economies.
Compatibility Issues with Different Vehicle Models
A critical challenge in the Car Battery Chargers Market is the lack of standardization in charging connectors, voltage levels, and communication protocols across different vehicle brands and regions. While Tesla, CCS (Combined Charging System), and CHAdeMO are some of the most widely used standards, their incompatibility creates challenges for universal charging solutions. Consumers often face difficulties finding compatible charging stations, leading to inconvenience and slower EV adoption.
Additionally, software integration issues between chargers and vehicles can affect charging efficiency and safety. The industry requires global standardization efforts to ensure seamless charging experiences. Until then, automakers and charging solution providers must invest in multi-protocol charging stations, increasing costs and operational complexity.
Opportunities
Rise of Wireless and Ultra-Fast Charging Solutions
The adoption of wireless and ultra-fast charging technologies is a major opportunity in the Car Battery Chargers Market. Wireless charging eliminates the need for cables and connectors, providing seamless and convenient charging experiences for EV owners. Additionally, ultra-fast charging solutions are revolutionizing the industry by reducing charging times to minutes instead of hours. Companies are investing in solid-state batteries and high-power DC charging stations to improve efficiency.
Wireless charging infrastructure is being integrated into smart cities and parking facilities, enabling automated and hands-free charging experiences. Furthermore, inductive charging technology is gaining traction, with automakers exploring embedded charging pads on roads to charge vehicles while in motion. These advancements are expected to enhance EV adoption and reduce range anxiety.
Expansion of EV Charging Infrastructure in Emerging Markets
The expansion of EV charging infrastructure in emerging markets presents a massive opportunity for market growth. Countries such as India, Brazil, and Indonesia are witnessing rapid EV adoption, creating a strong demand for affordable and efficient charging solutions. Governments are investing in public charging networks, and private companies are developing cost-effective home and workplace chargers.
Furthermore, the introduction of solar-powered and hybrid charging stations in remote areas is addressing energy accessibility challenges. The deployment of swappable battery stations in certain regions is also gaining momentum, offering new business models for battery charging services. As more consumers transition to EVs, scalable and widely accessible charging solutions will be crucial to sustaining long-term market growth.
The USA car battery chargers market is projected to grow steadily, driven by increasing electric vehicle (EV) adoption and consumer preference for reliable automotive accessories. Government incentives for EV infrastructure and advancements in smart charging technology are key growth factors. The market also benefits from a growing DIY car maintenance culture and expanding sales through online retail channels.
Regulatory policies encouraging energy efficiency and battery sustainability further fuel demand. As a result, the USA market is expected to grow at a CAGR of 6.5% from 2025 to 2035, slightly above the global average due to the rapid electrification of transport and robust investments in charging infrastructure.
| Country | CAGR (2025 to 2035) |
|---|---|
| United States | 6.5% |
The UK market for car battery chargers is set to expand as the country accelerates its transition to electric mobility. Stricter emissions regulations and the 2035 ban on new petrol and diesel vehicle sales are significant growth drivers. The rising number of EV owners and home-based charging solutions also contribute to market expansion. Additionally, government-backed incentives for sustainable transport infrastructure bolster demand. Smart charging solutions with AI-based monitoring are gaining traction.
Given these factors, the UK market is expected to register a CAGR of 5.8% during the forecast period, slightly below the global average due to high initial costs and slower charging infrastructure expansion compared to leading markets.
| Country | CAGR (2025 to 2035) |
|---|---|
| United Kingdom | 5.8% |
The European Union's car battery charger market is experiencing rapid growth due to stringent carbon neutrality targets and strong EV adoption. The EU’s Green Deal and incentives for sustainable transportation are crucial drivers. Countries like Germany, France, and the Netherlands are investing in fast-charging networks, while regulations mandate smart charging solutions to manage grid loads efficiently.
The aftermarket sector is also witnessing growth due to the rising sales of used EVs requiring affordable charging solutions. With these supportive policies and technological advancements, the EU market is expected to grow at a CAGR of 6.3%, aligning closely with the global trend but benefiting from aggressive sustainability measures.
| Region | CAGR (2025 to 2035) |
|---|---|
| European Union | 6.3% |
Japan's car battery chargers market is expanding due to its leadership in hybrid and EV technologies. Strong government incentives, technological innovation, and the widespread presence of leading automotive manufacturers like Toyota and Nissan drive market growth. The rising popularity of plug-in hybrid vehicles (PHEVs) and advanced wireless charging solutions further boost demand.
Additionally, Japan’s focus on energy efficiency and smart grid integration enhances market potential. However, a relatively slower transition to fully electric vehicles compared to China and Europe slightly tempers growth. The market is projected to grow at a CAGR of 5.7% from 2025 to 2035, reflecting steady but measured expansion.
| Country | CAGR (2025 to 2035) |
|---|---|
| Japan | 5.7% |
South Korea's car battery chargers market is growing rapidly, fueled by strong government support for EV adoption and advanced battery technology development. The presence of industry leaders like LG Energy Solution and SK Innovation strengthens the market landscape. Increasing investments in ultra-fast charging infrastructure and wireless charging solutions further drive growth. The country’s ambitious roadmap to phase out internal combustion engine vehicles enhances long-term prospects.
The rising number of public charging stations, coupled with innovative home-charging solutions, supports sustained market expansion. Given these trends, South Korea's car battery chargers market is forecasted to grow at a CAGR of 6.2%, slightly above the global average, driven by aggressive EV policies.
| Country | CAGR (2025 to 2035) |
|---|---|
| South Korea | 6.2% |
The Car Battery Chargers Market is experiencing rapid growth due to the increasing adoption of electric vehicles (EVs), advancements in battery technology, and the growing demand for efficient and portable charging solutions. As the global automotive sector shifts towards electrification, the need for reliable and smart charging systems has intensified. Innovations such as IoT-enabled chargers, wireless charging technology, and fast-charging solutions are reshaping the market landscape.
Moreover, rising environmental concerns have prompted manufacturers to develop energy-efficient and eco-friendly chargers. The market is also influenced by government incentives promoting EV adoption, further driving demand for high-performance charging infrastructure. Additionally, emerging markets in Asia-Pacific are becoming key manufacturing and consumption hubs, expanding the industry's global footprint.
CTEK Sweden AB
CTEK Sweden AB is a market leader in smart battery charging solutions, with a strong focus on adaptive charging technology and energy efficiency. The company’s chargers are widely used across the automotive, marine, and industrial sectors, offering a combination of reliability and innovation. CTEK has pioneered the development of smart chargers with advanced diagnostics, ensuring optimal battery performance and longevity.
Sustainability is a key focus, as CTEK continues to introduce eco-friendly chargers that minimize energy consumption and carbon footprint. Through strategic partnerships with automotive manufacturers and EV charging networks, CTEK has strengthened its global presence. Expansion into emerging markets and investment in wireless and solar charging technologies further position the company for continued market leadership.
Schumacher Electric
Schumacher Electric is a leading manufacturer of fast-charging automotive battery solutions, catering to both consumer and commercial applications. The company is known for its high-power charging stations, multi-voltage battery chargers, and jump starters, making it a preferred choice for garages, dealerships, and automotive service providers. With a legacy of innovation, Schumacher is investing in next-generation power management systems that enhance efficiency and reduce charging times.
The company also focuses on intelligent charging solutions, incorporating smart microprocessor controls for optimized battery maintenance. Strategic expansions into Asia-Pacific and Europe have bolstered Schumacher’s market share, while collaborations with EV manufacturers and fleet operators ensure long-term growth and adaptation to industry shifts.
NOCO
NOCO specializes in compact and portable lithium-ion battery chargers, with a reputation for high-performance and user-friendly designs. Its product portfolio includes smart chargers, portable jump starters, and industrial-grade battery maintenance solutions. NOCO differentiates itself by integrating advanced safety features such as spark-proof technology and reverse polarity protection, making its chargers highly reliable.
The company is aggressively expanding its footprint in consumer and commercial automotive markets, with a strong emphasis on durability and energy efficiency. NOCO is also making strides in the solar and wireless charging segments, ensuring adaptability to the growing demand for alternative energy solutions. The brand's ability to cater to diverse vehicle types, from motorcycles to heavy-duty trucks, makes it a strong contender in the market.
Clore Automotive
Clore Automotive is a key player in the professional-grade battery charging and jump-start solutions segment. It specializes in heavy-duty chargers, power inverters, and diagnostic battery testers, catering primarily to workshops, fleet operators, and automotive repair shops. Clore’s chargers are known for their rugged build, extended battery life, and industrial-strength performance.
The company continuously innovates in battery maintenance and efficiency optimization, ensuring that its products remain relevant for modern battery technologies, including AGM and lithium-ion batteries. Expansion into fleet management and logistics sectors has enhanced Clore’s market positioning. Additionally, strategic R&D investments in smart diagnostic technology are paving the way for new product developments and a broader industry reach.
Battery Tender
Battery Tender, a brand under Deltran Corporation, is recognized for its trickle and maintenance chargers, particularly in the motorcycle, powersports, and small-vehicle segments. The company is known for its highly portable and user-friendly charging solutions, making it a preferred brand among individual consumers and DIY mechanics. Battery Tender has expanded its product line to include solar-powered and wireless charging options, addressing the demand for sustainable energy solutions.
The company’s focus on battery health monitoring and intelligent charging technology ensures long-lasting battery life and reduced energy waste. With a growing online retail presence and strategic distribution partnerships, Battery Tender continues to strengthen its foothold in both domestic and international markets.
In terms of Charging Type, the industry is divided into Manual Charging, Automatic Charging
In terms of Charger Type, the industry is divided into Smart/Intelligent Charger, Float Charger, Trickle Charger
In terms of Voltage Capacity, the industry is divided into upto 12V, 12 to 48V, 48V
The report covers key regions, including North America, Latin America, Western Europe, Eastern Europe, East Asia, South Asia, and the Middle East and Africa (MEA).
The global market is expected to reach USD 44.9 billion by 2035, growing from USD 24.9 billion in 2025, at a CAGR of 6.1% during the forecast period.
The automatic charging segment is projected to dominate the market, driven by its convenience, efficiency, enhanced safety features, reduced manual intervention, and the increasing adoption of smart charging technologies in modern vehicles.
The passenger vehicle segment is the leading contributor, supported by rising vehicle ownership, increasing demand for advanced in-vehicle electronics, and the growing need for reliable and efficient charging solutions to maintain battery health.
Key drivers include increasing global vehicle parc, rising demand for battery maintenance and performance optimization, advancements in smart and portable chargers, and growing consumer awareness regarding preventive vehicle maintenance.
Top companies include CTEK Sweden AB, Schumacher Electric, NOCO, Clore Automotive, and Battery Tender, recognized for their innovative charging solutions, extensive product portfolios, and strong global distribution networks.


Full Research Suite comprises of:
Market outlook & trends analysis
Interviews & case studies
Strategic recommendations
Vendor profiles & capabilities analysis
5-year forecasts
8 regions and 60+ country-level data splits
Market segment data splits
12 months of continuous data updates
DELIVERED AS:
PDF EXCEL ONLINE
Card Printer Ribbon Market Size and Share Forecast Outlook 2025 to 2035
Caramel Malt Market Size and Share Forecast Outlook 2025 to 2035
Carbon Tetrabromide Market Size and Share Forecast Outlook 2025 to 2035
Carbon Steel Market Size and Share Forecast Outlook 2025 to 2035
Carpet Spot Remover Market Size and Share Forecast Outlook 2025 to 2035
Cardiovascular CT Systems Market Size and Share Forecast Outlook 2025 to 2035
Carbon Brush Market Size and Share Forecast Outlook 2025 to 2035
Carpet and Rug Market Size and Share Forecast Outlook 2025 to 2035
Carbon Offset Platform Market Size and Share Forecast Outlook 2025 to 2035
Carob Market Size and Share Forecast Outlook 2025 to 2035
Cargo Vans Market Size and Share Forecast Outlook 2025 to 2035
Carbon Tapes Market Size and Share Forecast Outlook 2025 to 2035
Cars Market Size and Share Forecast Outlook 2025 to 2035
Carnitine Supplements Market Size and Share Forecast Outlook 2025 to 2035
Carboy Market Size and Share Forecast Outlook 2025 to 2035
Cardiac Monitoring And Cardiac Rhythm Management Devices Market Size and Share Forecast Outlook 2025 to 2035
Cardiovascular Surgical Devices Market Size and Share Forecast Outlook 2025 to 2035
Cargo Shipping Market Size and Share Forecast Outlook 2025 to 2035
Carton Sealer Machine Market Size and Share Forecast Outlook 2025 to 2035
Carbon-Free Waste Gas Abatement System Market Size and Share Forecast Outlook 2025 to 2035

Thank you!
You will receive an email from our Business Development Manager. Please be sure to check your SPAM/JUNK folder too.
Chat With
MaRIA