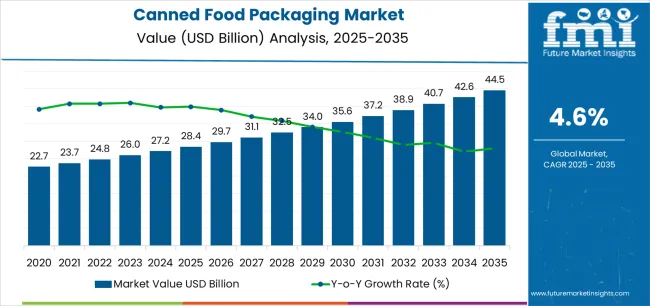
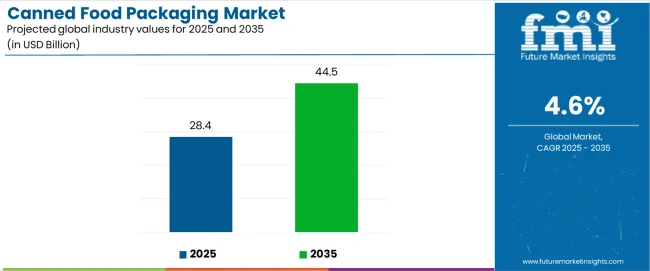
The canned food packaging market is projected to grow from USD 28.4 billion in 2025 to USD 44.5 billion by 2035, registering a 4.6% CAGR as demand strengthens for shelf-stable, nutrient-retaining, and convenient food preservation formats across global retail, food service, and emergency supply chains. Growth is primarily driven by rising urbanization, increased consumption of ready-to-eat meals, and expanding reliance on long-duration storage formats in both developed and emerging markets. Three-piece cans, holding a dominant 54.5% share, remain the preferred format due to their compatibility with retort processing, structural reliability, and cost-efficient production. Vegetables & fruits, commanding 56.5% share, form the largest application segment as processors rely on canned formats to preserve seasonal produce, maintain nutrient integrity, and ensure year-round supply security. Between 2025 and 2030, demand rises consistently with the adoption of easy-open ends, BPA-free linings, and improved hermetic sealing standards in high-volume canning lines.
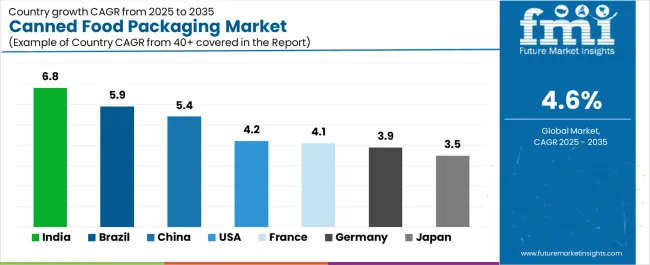
Steel-based cans represent 61.0% of material usage due to their superior heat resistance, exceptional oxygen–light barrier properties, and suitability for high-temperature sterilization cycles. Aluminum cans continue gaining ground in lightweighting and recyclability-driven applications. Regional growth is led by India (6.8% CAGR) and Brazil (5.9%), supported by expanding food processing infrastructure and rising consumption of packaged convenience foods. China (5.4%) benefits from increasing household purchasing power and strong domestic canning capacity, while the United States (4.2%), Germany (3.9%), Japan (3.5%), and France (4.1%) maintain steady, demand-driven expansion through premium canned foods, emergency preparedness programs, and quality-focused processing environments. Competitive positioning remains anchored by global manufacturers such as Crown Holdings, Ball Corporation, Ardagh Group, Silgan Holdings, Can-Pack, and Toyo Seikan, who continue investing in advanced coating systems, lightweight metal structures, and consumer-friendly opening features to enhance product safety, material efficiency, and processing performance.
A major dynamic shaping market expansion is the growing global preference for processed and preserved foods. Canned vegetables, legumes, soups, sauces, fruits, seafood, broths, dairy products, and meats offer consistent quality, long shelf life, and ease of storage, making them attractive to households seeking time-saving meal solutions. Retailers rely on canned packaging to maintain year-round availability of seasonal produce and perishable food items. As consumption of ready-to-use ingredients and pantry staples increases across North America, Europe, Asia-Pacific, and the Middle East, demand for reliable canning formats expands steadily.
Technological advancements in can manufacturing are reshaping the competitive landscape. Modern two-piece and three-piece metal cans feature enhanced dent resistance, precision seams, improved double-seaming technology, and optimized internal linings that protect food from metal interaction. Lightweight can bodies reduce material usage while maintaining strength, contributing to more efficient transportation and manufacturing processes. Improved retort systems support faster and more uniform thermal processing, enhancing both product quality and operational efficiency.
| Metric | Value |
|---|---|
| Estimated Value in (2025E) | USD 28.4 billion |
| Forecast Value in (2035F) | USD 44.5 billion |
| Forecast CAGR (2025 to 2035) | 4.6% |
Market expansion is being supported by the increasing global demand for food security solutions and the corresponding need for packaging systems that can provide extended shelf life and ambient storage capabilities while enabling convenient consumption and nutritional preservation across various retail and institutional food service applications. Modern food manufacturers and retail operators are increasingly focused on implementing packaging solutions that can preserve food quality, prevent spoilage, and provide consistent protection throughout extended storage periods and complex distribution networks. Canned food packaging's proven ability to deliver exceptional barrier protection against oxygen and moisture, enable long-term nutrient retention, and support cost-effective pantry storage make them essential packaging formats for contemporary food preservation and emergency preparedness operations.
The growing emphasis on food waste reduction and distribution efficiency is driving demand for canned packaging that can support extended shelf life requirements, improve product availability in remote regions, and enable year-round access to seasonal foods. Manufacturers' preference for packaging that combines effective preservation with processing reliability and material efficiency is creating opportunities for innovative can implementations. The rising influence of disaster preparedness and military food supply is also contributing to increased demand for canned packaging that can provide long-term food security, temperature tolerance, and reliable performance across challenging storage conditions.
The canned food packaging market is poised for consistent growth and transformation. As industries across food processing, retail grocery, food service, military supply, and institutional catering seek packaging that delivers exceptional preservation performance, hermetic sealing, and storage convenience, canned packaging is gaining prominence not just as traditional food containers but as strategic enablers of food security and nutritional access.
Rising middle-class populations in Asia-Pacific and expanding urban consumption globally amplify demand, while manufacturers are leveraging innovations in can coating technologies, easy-open end systems, and lightweight aluminum structures.
Pathways like premium seafood cans, retort-compatible packaging, and specialized coating formulations promise strong margin uplift, especially in high-value segments. Geographic expansion and vertical integration will capture volume, particularly where local manufacturing capabilities and distribution infrastructure proximity are critical. Regulatory pressures around food safety standards, BPA-free coating requirements, recyclability targets, and nutritional labeling give structural support.
The market is segmented by can type, material, application, capacity, coating type, end-use sector, and region. By can type, the market is divided into three-piece cans, two-piece cans, and aerosol cans. By material, it covers steel, aluminum, and others. By application, it includes vegetables & fruits, meat & poultry, seafood, ready meals, soups & sauces, and others. By capacity, the market is segmented into small (below 300ml), medium (300-500ml), and large (above 500ml). The coating type includes epoxy-based, polyester-based, and others. By end-use sector, it is categorized into food retail, food service, institutional, military & emergency supply, and others. Regionally, the market is divided into North America, Europe, East Asia, South Asia & Pacific, Latin America, and the Middle East & Africa.
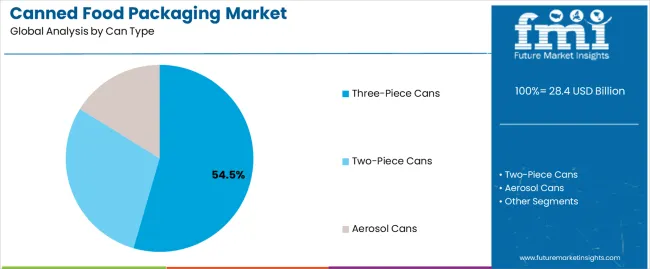
The three-piece cans segment is projected to account for 54.5% of the canned food packaging market in 2025, reaffirming its position as the leading can category. Food manufacturers and canneries increasingly utilize three-piece cans for their superior versatility in accommodating various can shapes when processed through traditional manufacturing technologies, excellent compatibility with retort processing, and cost-effectiveness in applications ranging from vegetable preservation to ready-meal packaging. Three-piece can technology's established manufacturing infrastructure and proven hermetic sealing capabilities directly address the industrial requirements for reliable food preservation in high-volume processing environments.
This can segment forms the foundation of traditional food canning operations, as it represents the can type with the greatest format flexibility and established market presence across multiple food categories and processing facilities. Manufacturer investments in automated seaming technologies and advanced coating systems continue to strengthen adoption among food processors and canneries. With companies prioritizing food safety and production efficiency, three-piece cans align with both preservation performance requirements and manufacturing compatibility objectives, making them the central component of comprehensive food packaging strategies.
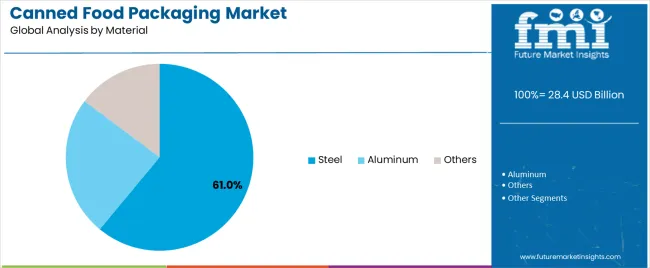
Steel-based cans are projected to represent 61.0% of canned food packaging demand in 2025, underscoring their critical role as the primary material for food preservation applications requiring exceptional structural integrity, superior heat resistance during retort sterilization, and cost-effective protection for acidic food products and high-temperature processing. Food processors prefer steel cans for their proven barrier properties against oxygen and light, robust strength characteristics, and ability to maintain hermetic seals while ensuring product safety throughout extended storage durations. Positioned as essential packaging formats for traditional canning operations, steel cans offer both performance advantages and economic benefits.
The segment is supported by continuous innovation in tin-free steel technologies and the growing availability of specialized coating formulations that enable corrosion resistance with enhanced food contact safety and processing compatibility. Additionally, food manufacturers are investing in steel can recycling infrastructure to support circular economy initiatives and material recovery. As food security concerns become more prevalent and emergency supply requirements increase, steel can applications will continue to dominate the material market while supporting advanced coating utilization and processing efficiency strategies.
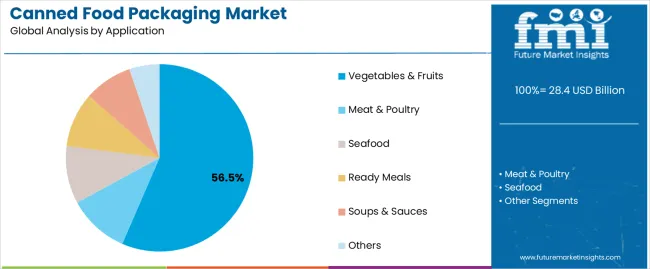
Vegetables & fruits applications are projected to represent 56.5% of canned food packaging demand in 2025, underscoring their critical role as the primary food category utilizing canned packaging for seasonal produce preservation, year-round availability, and nutritional accessibility. Food processors prefer canned packaging for vegetables and fruits due to exceptional shelf-life extension capabilities, reliable nutrient retention characteristics, and ability to provide affordable access to produce while ensuring food safety with ambient storage requirements. Positioned as essential formats for addressing food accessibility and seasonal availability challenges, canned vegetables and fruits offer both preservation advantages and economic accessibility benefits.
The segment is supported by continuous innovation in vacuum sealing technologies and the growing availability of organic canned produce that enables premium positioning with validated nutritional retention and quality characteristics. Additionally, processors are investing in automated filling systems to support large-volume production and consistency. As health-conscious consumption becomes more prevalent and convenient meal preparation demands increase, vegetables & fruits applications will continue to dominate the end-use market while supporting advanced processing utilization and nutritional preservation strategies.
The canned food packaging market is advancing steadily due to increasing demand for shelf-stable food solutions and growing adoption of hermetically sealed containers that provide extended preservation and ambient storage capabilities while enabling convenient consumption across diverse retail and institutional food service applications. However, the market faces challenges, including competition from alternative packaging formats, consumer perceptions regarding processed foods, and the need for specialized coating technology investments. Innovation in BPA-free coating formulations and lightweighting technologies continues to influence product development and market expansion patterns.
The growing adoption of polyester-based coatings, plant-derived barrier materials, and epoxy-free lining technologies is enabling manufacturers to produce food-safe cans with superior chemical resistance, enhanced corrosion protection, and regulatory compliance functionalities. Advanced coating systems provide improved food contact safety while allowing more efficient processing and consistent performance across various food products and pH conditions. Manufacturers are increasingly recognizing the competitive advantages of alternative coating capabilities for addressing health concerns and premium market positioning.
Modern can manufacturers are incorporating pull-tab opening systems, peel-off lid technologies, and integrated serving mechanisms to enhance consumer convenience, enable accessibility for diverse demographics, and deliver value-added solutions to food brands and retail customers. These technologies improve user experience while enabling new consumption occasions, including outdoor activities, single-serve consumption, and elderly-friendly packaging. Advanced convenience feature integration also allows manufacturers to support premium brand positioning and product differentiation beyond traditional can opener-dependent formats.
| Country | CAGR (2025-2035) |
|---|---|
| India | 6.8% |
| China | 5.4% |
| USA | 4.2% |
| Brazil | 5.9% |
| Germany | 3.9% |
| Japan | 3.5% |
| France | 4.1% |
The canned food packaging market is experiencing steady growth globally, with India leading at a 6.8% CAGR through 2035, driven by the expanding middle-class population, growing urbanization with demand for convenient food storage, and significant investment in food processing infrastructure development. China follows at 5.4%, supported by rising disposable incomes, increasing adoption of Western food consumption patterns, and growing domestic food manufacturing capabilities. The USA shows growth at 4.2%, emphasizing convenience food innovation and emergency preparedness demand. Brazil records 5.9%, focusing on agricultural processing expansion and export market growth. Germany demonstrates 3.9% growth, prioritizing food safety standards and advanced can manufacturing excellence. Japan exhibits 3.5% growth, emphasizing quality control and disaster preparedness food supply. France shows 4.1% growth, supported by gourmet food canning demand and traditional preservation methods.
The report covers an in-depth analysis of 40+ countries top-performing countries are highlighted below.
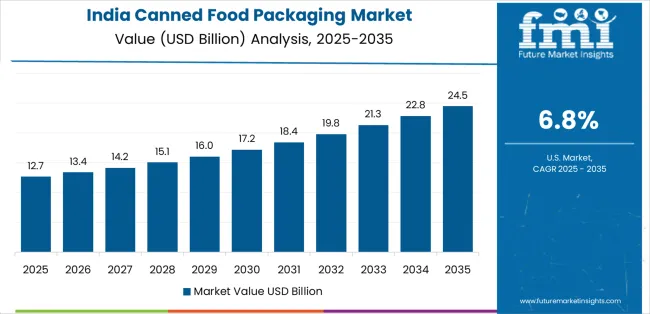
Revenue from canned food packaging in India is projected to exhibit exceptional growth with a CAGR of 6.8% through 2035, driven by expanding urbanization and rapidly growing middle-class consumption supported by government initiatives promoting food processing industry development. The country's strong position in vegetable and fruit production and increasing investment in modern canning facilities are creating substantial demand for food-grade can solutions. Major food processors and multinational brands are establishing comprehensive can sourcing capabilities to serve both domestic consumption demand and export processing markets.
Revenue from canned food packaging in China is expanding at a CAGR of 5.4%, supported by the country's massive food processing industry, expanding urban consumption patterns, and increasing adoption of convenience food formats. The country's government initiatives promoting food security and growing middle-class purchasing power are driving requirements for sophisticated food preservation capabilities. International brands and domestic manufacturers are establishing extensive production and distribution capabilities to address the growing demand for canned food products.
Revenue from canned food packaging in the USA is expanding at a CAGR of 4.2%, supported by the country's established food processing capabilities, strong emphasis on convenience food innovation, and robust demand for emergency preparedness food supplies in retail and institutional applications. The nation's mature canning industry and quality-focused operations are driving sophisticated can technologies throughout the supply chain. Leading manufacturers and brand owners are investing extensively in easy-open ends and specialty coating formulations to serve both domestic and international markets.
Revenue from canned food packaging in Brazil is growing at a CAGR of 5.9%, driven by the country's strong agricultural production, growing food processing sector, and increasing investment in export-oriented canning facilities. Brazil's abundant produce availability and commitment to food industry modernization are supporting demand for food-grade cans across multiple processing segments. Manufacturers are establishing comprehensive production capabilities to serve the growing domestic market and international export opportunities.
Revenue from canned food packaging in Germany is expanding at a CAGR of 3.9%, supported by the country's food safety leadership, advanced manufacturing capabilities, and strategic focus on high-quality food preservation. Germany's engineering excellence and quality standards are driving demand for precision-manufactured cans in specialty food processing, gourmet product packaging, and export-grade applications. Manufacturers are investing in comprehensive quality assurance capabilities to serve both domestic food processors and international premium markets.
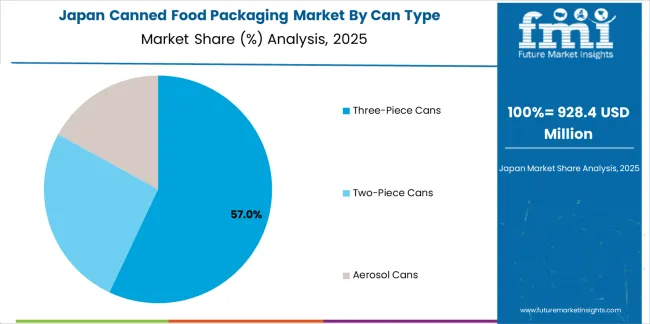
Revenue from canned food packaging in Japan is growing at a CAGR of 3.5%, driven by the country's expertise in quality manufacturing, emphasis on food safety, and strong position in disaster preparedness food supply. Japan's established food processing capabilities and commitment to shelf-stable emergency provisions are supporting investment in advanced canning technologies throughout major production centers. Industry leaders are establishing comprehensive inspection systems to serve domestic food manufacturers and emergency supply programs.
Revenue from canned food packaging in France is expanding at a CAGR of 4.1%, supported by the country's culinary heritage, growing gourmet food sector, and strategic position in European food manufacturing networks. France's gastronomic excellence and traditional preservation methods are driving demand for premium cans in specialty food processing, artisanal product packaging, and export-quality applications. Leading manufacturers are investing in specialized capabilities to serve the stringent requirements of gourmet food and specialty ingredients industries.
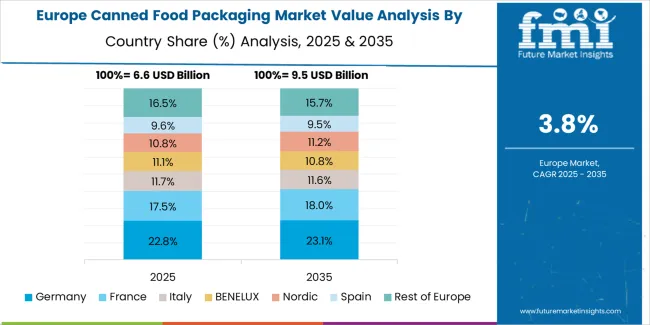
The canned food packaging market in Europe is projected to grow from USD 7.6 billion in 2025 to USD 11.9 billion by 2035, registering a CAGR of 4.6% over the forecast period. Germany is expected to maintain its leadership position with a 28.5% market share in 2025, declining slightly to 28.0% by 2035, supported by its strong food processing industry, advanced manufacturing capabilities, and comprehensive quality assurance systems serving diverse canned food applications across Europe.
France follows with a 21.0% share in 2025, projected to reach 21.5% by 2035, driven by robust demand for cans in gourmet food preservation, specialty ingredient packaging, and premium product applications, combined with established culinary heritage and artisanal food production expertise. The United Kingdom holds a 17.5% share in 2025, expected to reach 17.8% by 2035, supported by strong convenience food market and growing ready-meal consumption. Italy commands a 14.5% share in 2025, projected to reach 14.7% by 2035, while Spain accounts for 9.5% in 2025, expected to reach 9.8% by 2035. Poland maintains a 4.0% share in 2025, growing to 4.3% by 2035. The Rest of Europe region, including Nordic countries, Eastern Europe, Netherlands, Belgium, and other nations, is anticipated to maintain momentum, with its collective share moving from 5.0% to 3.9% by 2035, attributed to increasing food processing modernization in Eastern Europe and growing convenience food consumption in Nordic countries implementing advanced preservation programs.
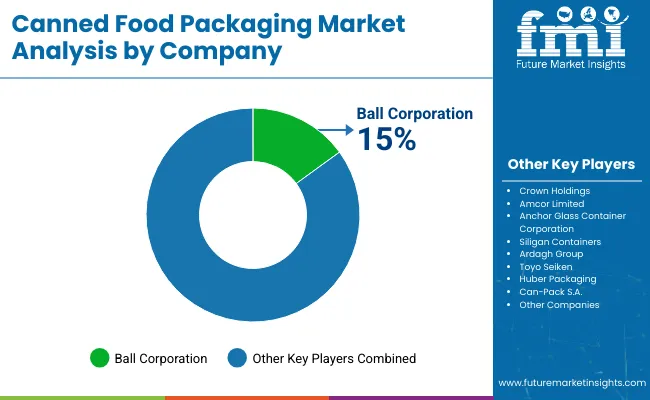
The canned food packaging market is characterized by competition among established metal packaging manufacturers, specialized can producers, and integrated packaging solutions providers. Companies are investing in coating technology research, light weighting optimization, easy-open end development, and comprehensive product portfolios to deliver consistent, high-performance, and application-specific can solutions. Innovation in BPA-free materials, aluminum technologies, and convenience features is central to strengthening market position and competitive advantage.
Crown Holdings Inc. leads the market with a strong market share, offering comprehensive can solutions including three-piece and two-piece formats with a focus on food safety and global manufacturing presence. Ball Corporation provides specialized beverage and food can capabilities with an emphasis on aluminum technologies and circular economy initiatives. Ardagh Group delivers innovative metal packaging products with a focus on easy-open ends and coating systems. Silgan Holdings specializes in metal food containers and closures for processed food applications. Can-Pack S.A. focuses on two-piece can technologies and European market leadership. Toyo Seikan Group offers advanced can manufacturing with emphasis on Japanese quality standards and barrier technologies.
| Items | Values |
|---|---|
| Quantitative Units (2025) | USD 28.4 billion |
| Can Type | Three-Piece Cans, Two-Piece Cans, Aerosol Cans |
| Material | Steel, Aluminum, Others |
| Application | Vegetables & Fruits, Meat & Poultry, Seafood, Ready Meals, Soups & Sauces, Others |
| Capacity | Small (Below 300ml), Medium (300-500ml), Large (Above 500ml) |
| Coating Type | Epoxy-Based, Polyester-Based, Others |
| End-Use Sector | Food Retail, Food Service, Institutional, Military & Emergency Supply, Others |
| Regions Covered | North America, Europe, East Asia, South Asia & Pacific, Latin America, Middle East & Africa |
| Countries Covered | United States, Canada, United Kingdom, Germany, France, China, Japan, South Korea, India, Brazil, Australia and 40+ countries |
| Key Companies Profiled | Crown Holdings Inc., Ball Corporation, Ardagh Group, Silgan Holdings, Can-Pack S.A., and Toyo Seikan Group |
| Additional Attributes | Dollar sales by can type and application category, regional demand trends, competitive landscape, technological advancements in coating systems, lightweighting development, easy-open end innovation, and supply chain integration |
The global canned food packaging market is estimated to be valued at USD 28.4 billion in 2025.
The market size for the canned food packaging market is projected to reach USD 44.5 billion by 2035.
The canned food packaging market is expected to grow at a 4.6% CAGR between 2025 and 2035.
The key product types in canned food packaging market are three-piece cans, two-piece cans and aerosol cans.
In terms of application, vegetables & fruits segment to command 56.5% share in the canned food packaging market in 2025.


Our Research Products

The "Full Research Suite" delivers actionable market intel, deep dives on markets or technologies, so clients act faster, cut risk, and unlock growth.

The Leaderboard benchmarks and ranks top vendors, classifying them as Established Leaders, Leading Challengers, or Disruptors & Challengers.

Locates where complements amplify value and substitutes erode it, forecasting net impact by horizon

We deliver granular, decision-grade intel: market sizing, 5-year forecasts, pricing, adoption, usage, revenue, and operational KPIs—plus competitor tracking, regulation, and value chains—across 60 countries broadly.

Spot the shifts before they hit your P&L. We track inflection points, adoption curves, pricing moves, and ecosystem plays to show where demand is heading, why it is changing, and what to do next across high-growth markets and disruptive tech

Real-time reads of user behavior. We track shifting priorities, perceptions of today’s and next-gen services, and provider experience, then pace how fast tech moves from trial to adoption, blending buyer, consumer, and channel inputs with social signals (#WhySwitch, #UX).

Partner with our analyst team to build a custom report designed around your business priorities. From analysing market trends to assessing competitors or crafting bespoke datasets, we tailor insights to your needs.
Supplier Intelligence
Discovery & Profiling
Capacity & Footprint
Performance & Risk
Compliance & Governance
Commercial Readiness
Who Supplies Whom
Scorecards & Shortlists
Playbooks & Docs
Category Intelligence
Definition & Scope
Demand & Use Cases
Cost Drivers
Market Structure
Supply Chain Map
Trade & Policy
Operating Norms
Deliverables
Buyer Intelligence
Account Basics
Spend & Scope
Procurement Model
Vendor Requirements
Terms & Policies
Entry Strategy
Pain Points & Triggers
Outputs
Pricing Analysis
Benchmarks
Trends
Should-Cost
Indexation
Landed Cost
Commercial Terms
Deliverables
Brand Analysis
Positioning & Value Prop
Share & Presence
Customer Evidence
Go-to-Market
Digital & Reputation
Compliance & Trust
KPIs & Gaps
Outputs
Full Research Suite comprises of:
Market outlook & trends analysis
Interviews & case studies
Strategic recommendations
Vendor profiles & capabilities analysis
5-year forecasts
8 regions and 60+ country-level data splits
Market segment data splits
12 months of continuous data updates
DELIVERED AS:
PDF EXCEL ONLINE
Canned Food Packaging Industry Analysis in the United Kingdom Size and Share Forecast Outlook 2025 to 2035
Market Share Insights of Canned Food Packaging Providers
Food Packaging Film Market Size and Share Forecast Outlook 2025 to 2035
Food Packaging Machines Market Size and Share Forecast Outlook 2025 to 2035
Food Packaging Films Market Size and Share Forecast Outlook 2025 to 2035
Food Packaging Tester Market Size and Share Forecast Outlook 2025 to 2035
Food Packaging Market Size, Share & Forecast 2025 to 2035
Market Share Breakdown of Food Packaging Film Providers
Food Packaging Equipment Market
Analysis and Growth Projections for Canned Foods Business
Food Tub packaging Market Size and Share Forecast Outlook 2025 to 2035
Canned Seafood Market Size, Growth, and Forecast for 2025 to 2035
Canned Pet Food Market Analysis - Size and Share Forecast Outlook 2025 to 2035
Seafood Packaging Market Size and Share Forecast Outlook 2025 to 2035
Seafood Packaging Market Size, Share & Forecast 2025 to 2035
Food Grade Packaging Market Insights – Demand, Size & Industry Trends 2025-2035
Evaluating Seafood Packaging Market Share & Provider Insights
Food Powder Packaging Machine Market Size and Share Forecast Outlook 2025 to 2035
Analyzing Food Powder Packaging Machine Market Share & Industry Trends
Pet Food Packaging Industry Analysis in Europe - Size, Share, and Forecast 2025 to 2035

Thank you!
You will receive an email from our Business Development Manager. Please be sure to check your SPAM/JUNK folder too.
Chat With
MaRIA