The Canned Food Packaging Industry Analysis in the United Kingdom is estimated to be valued at USD 1.3 billion in 2025 and is projected to reach USD 1.7 billion by 2035, registering a compound annual growth rate (CAGR) of 2.9% over the forecast period.
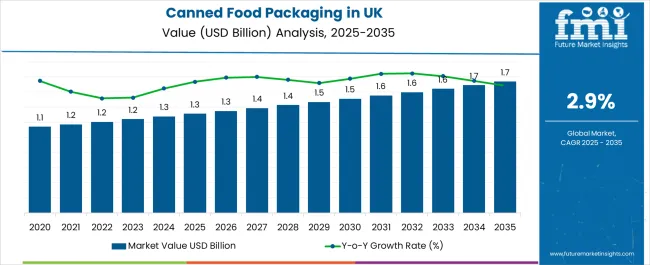
| Metric | Value |
|---|---|
| Canned Food Packaging Industry Analysis in the United Kingdom Estimated Value in (2025 E) | USD 1.3 billion |
| Canned Food Packaging Industry Analysis in the United Kingdom Forecast Value in (2035 F) | USD 1.7 billion |
| Forecast CAGR (2025 to 2035) | 2.9% |
The canned food packaging industry in the United Kingdom is experiencing stable growth as a result of increasing consumer demand for convenient, long-shelf-life food solutions. Market expansion is being supported by strong retail penetration, urban lifestyle shifts, and a steady rise in ready-to-eat and processed food consumption.
Current dynamics highlight growing reliance on sustainable and recyclable packaging materials in response to environmental regulations and consumer awareness regarding eco-friendly practices. Technological advancements in can manufacturing, coating, and sealing processes are enhancing product safety, quality, and durability, which is strengthening market adoption across both domestic and export channels.
Future growth is expected to be driven by heightened focus on sustainability initiatives, premiumization in canned food offerings, and expansion of online retail channels, which are accelerating demand for durable packaging formats The growth rationale is underpinned by the industry’s adaptability to evolving regulations, its ability to meet consumer expectations for safety and convenience, and continuous innovation in lightweight yet durable can designs, ensuring consistent long-term development.
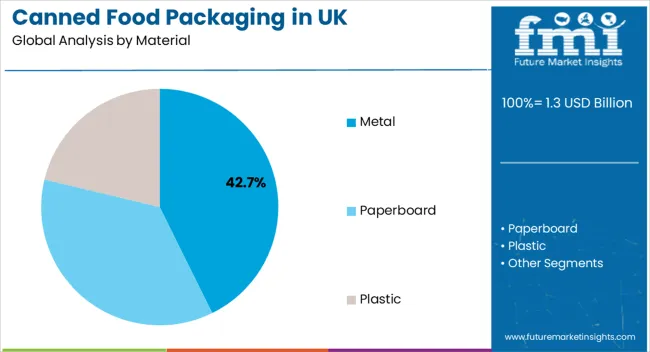
The metal segment, accounting for 42.70% of the material category, has been leading the market due to its durability, recyclability, and strong barrier properties that ensure extended shelf life for canned products. Widespread consumer trust in metal packaging for preserving freshness and preventing contamination has sustained demand.
The segment’s resilience is supported by compliance with environmental regulations that emphasize circular economy practices and recycling efficiency. Manufacturing improvements, including lightweighting and eco-friendly coatings, are enhancing cost efficiency and aligning with sustainability goals.
Market positioning has been reinforced by consistent usage across varied food categories such as vegetables, seafood, and beverages Continued investment in recycling infrastructure and material innovation is expected to sustain the segment’s share and support long-term competitiveness within the United Kingdom market.
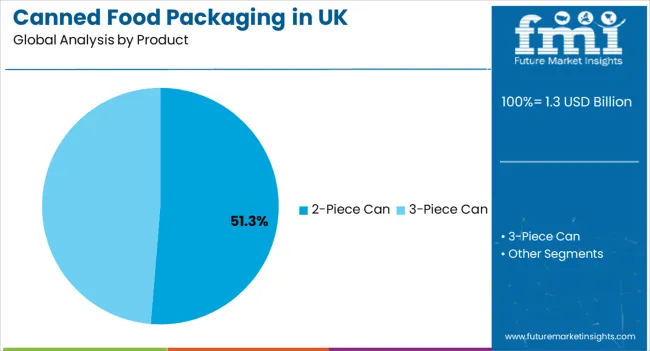
The 2-piece can segment, representing 51.30% of the product category, has maintained leadership through its cost-effectiveness, production efficiency, and reliable sealing capabilities. Its lightweight structure and reduced material usage compared to 3-piece alternatives have strengthened adoption across high-volume food categories.
The segment has been favored by manufacturers for faster production runs and lower manufacturing costs, which has driven strong uptake in both domestic food processing and export packaging. Enhanced resistance to leakage, improved shelf presentation, and compatibility with modern labeling techniques have reinforced consumer and retailer preference.
Growth in processed and convenience food consumption has further stabilized demand, while technological advancements in can forming and printing are expected to ensure the 2-piece can continues to hold its leading position in the market.
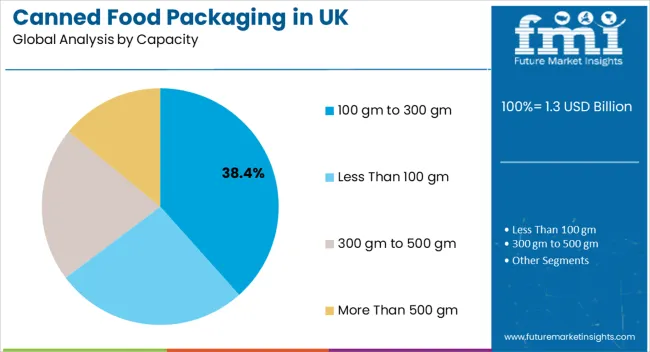
The 100 gm to 300 gm segment, holding 38.40% of the capacity category, has emerged as the dominant size due to its suitability for single-serve and household consumption needs. Rising demand for portion-controlled, ready-to-eat food products has supported segment leadership, especially within urban populations seeking convenience.
The segment has also been strengthened by its alignment with retailer strategies focused on promoting compact, affordable, and easily transportable packaging formats. Its market positioning benefits from broad application across canned fruits, vegetables, meat, and ready meals, ensuring consistent utilization by manufacturers.
Consumer preference for manageable pack sizes, combined with affordability and reduced food wastage, has driven sustained demand Over the forecast period, the segment is expected to retain its competitive advantage, supported by lifestyle shifts, e-commerce penetration, and packaging innovations that enhance convenience and appeal.
Canned food packaging business in the United Kingdom registered a CAGR of 1.3% between 2020 and 2025. In the forecast period, canned food packaging demand across the United Kingdom is set to surge at 3.0% CAGR.
| Historical CAGR (2020 to 2025) | 1.3% |
|---|---|
| Forecast CAGR (2025 to 2035) | 3.0% |
Canned food helps in easy storage, transportation, and opening, offering convenience to the consumers. Food cans offer portability, making them suitable for consumption and driving the canned food packaging business.
Food canning serves as a proficient method for food preservation, which helps extend the product's shelf life. Hermetic seals applied on the cans help them to protect the food from the outside environment, preventing the spoilage of food and maintaining its quality.
The extended shelf life provided by food cans aids in reducing food wastage, which is a crucial problem faced by consumers and manufacturers. Canned food helps retailers and manufacturing businesses stock up on food items and reduce the risk of spoilage.
Canned food products are witnessing a higher demand in the United Kingdom due to busy lifestyles and changing eating habits. Thus, growing popularity of canned foods in the United Kingdom is expected to drive demand for canned food packaging.
Canned food packaging serves well for several food products, including fruits, vegetables, ready-to-eat meals, and meats catering to diversified consumer preferences and dietary needs. Rising demand for ready-to-eat food and off-seasonal food drive the business growth in the United Kingdom.
Rapid expansion of horticulture and seafood industries in the United Kingdom is another key factor expected to fuel sales of canned food packaging solutions. This is because cans are often used for storing seafood and horticultural produce.
People in the United Kingdom are consuming canned fish and other items on large scales, thanks to their highly nutritional content. Increasing consumption of these products, in turn, will create high demand for canned food packaging solutions through 2035.
The materials used in canned food packaging have changed due to customers' desire for convenience. Manufacturers are adding features like pull-tab closures that make opening cans simpler. Although conventional metal cans are still widely used, researchers have experimented with different materials, coatings, and liners to improve sustainability.
Sustainability is becoming a significant trend in the United Kingdom. Manufacturers are making an effort to lessen the impact of canned food packaging on the environment by using eco-friendly materials.
Inclination towards Food Cans to Eliminate the Need for Secondary Packaging
Canned food packaging has inherent durability and provides versatile packaging that helps in storage and transportation, eliminating the need for secondary packaging. Food cans maintain their structural integrity during travel and ensure that the food inside remains intact without leakage.
The resilience to preserve the quality and safety of the enclosed food products is vital, which is sometimes difficult to achieve in alternative food packaging such as pouches and bags. Food cans provide tamper-proof packaging that helps consumers understand the authenticity of their products.
Hermetically sealed cans instill confidence in end users and indicate the product’s quality, freshness, and integrity. This, in turn, helps brands gain the trust of consumers, thereby contributing to growth of the canned food packaging business in the United Kingdom.
Nutrient-Rich Preservation and Freshness Amplification Elevate Sales
Growing popularity of canned food products across the United Kingdom is expected to boost sales of canned food packaging. Similarly, multiple easy availability and accessibility of canned products will boost the target business.
People in the United Kingdom are inclined towards consuming canned food products as they offer a convenient and affordable way to get their daily intake of nutrients. These products have a long shelf life, so they are available year-round, even when fresh fruit, vegetables, or other items may not be.
Canned food captures the essence of freshness and safeguards the nutritional richness of several food items. The canned process involves the precision time mechanism in which the prepared food is promptly transitioned to the cans shortly after the culinary genesis
Edibles such as fruits and vegetables are carefully seized in the containers at the zenith of their ripeness. Canned food has a shelf life of 1 to 5 years, is appropriate for pantry storage, and helps manufacturers and retailers stock the product. People consuming canned foods tend to have more intake of fruits, vegetables, and nutrients than others.
Canning does not change the food content, such as vitamins, minerals, protein, fat, and carbohydrates, ensuring the best flavor and nutrient quality. Canned foods are also rich in dietary fiber and vitamins, the same as fresh or frozen foods, which consistently increase growth in the projected period.
The table presents the expected CAGR for the United Kingdom canned food packaging business over several semi-annual periods spanning from 2025 to 2035. In the first half (H1) of the decade from 2025 to 2035, the business is predicted to surge at a CAGR of 2.3%, followed by a slightly higher growth rate of 2.8% in the second half (H2) of the same decade. Moving into the subsequent period, from H1 2025 to H2 2035, the CAGR is projected to decrease slightly to 2.5% in the first half and remain relatively low at 2.0% in the second half.
| Particular | Value CAGR |
|---|---|
| H1 | 2.3% (2025 to 2035) |
| H2 | 2.8% (2025 to 2035) |
| H1 | 2.5% (2025 to 2035) |
| H2 | 2.0% (2025 to 2035) |
The below section shows the metal segment dominating the United Kingdom canned food packaging business in terms of material. It is forecast to thrive at 3.1% CAGR between 2025 and 2035. Based on end use, the fruits and vegetable segment is anticipated to hold a dominant share through 2035. It is poised to exhibit a CAGR of 2.9% during the forecast period.
| Material | Value CAGR |
|---|---|
| Metal | 3.1% |
| Paperboard | 5.1% |
Based on material, metal cans segment is expected to dominate the United Kingdom canned food packaging business, holding 4/5th of the value share in 2025. Over the forecast period, demand for metal cans is predicted to surge at 3.1% CAGR.
Rising demand for inexpensive and sustainable packaging solutions such as steel cans and tin cans is expected to propel sales of metal food cans through 2035. Metal food cans are highly recyclable, which is leading to their preference by the manufacturers.
Paperboard cans, on the other hand, are estimated to witness higher demand, growing at a notable CAGR of 5.1%. This is due to growing consumer preference for environment-friendly and non-carcinogenic packaging solutions.
Paperboard is considered a more environmentally friendly choice than conventional metal cans. To satisfy customer needs for environmentally friendly solutions, brands are putting more emphasis on sustainable packaging.
Paperboard is easily customizable in size, shape, and printing. Paperboard's lower weight results in savings on transportation and logistics costs, even if material costs may differ. Paperboard and other packaging materials that are viewed as sustainable and eco-friendly can have a beneficial impact on customers' purchase decisions in the United Kingdom.
| End Use | Value CAGR |
|---|---|
| Meat, Poultry and Seafood | 2.5% |
| Fruits and Vegetables | 2.9% |
| Bakery and Confectionary | 2.8% |
The fruits and vegetables segment will capture 22% of the business share in 2025 and will expand at a CAGR of 2.9% through 2035. Fruits and vegetables may be effectively preserved, kept from spoiling, and given a longer shelf life by canning. Cans' airtight seal helps keep germs, fungus, and other pollutants out of the contents.
Because canned fruits and vegetables are ready to eat and require little preparation, they are convenient for customers. This aspect of ease appeals especially to time-pressed customers looking for quick and straightforward dinner ideas, driving demand for canned food packaging.
The food business is increasingly paying attention to environmentally friendly packaging options. To meet customer demand for ecologically friendly packaging, brands are looking to develop eco-friendly choices like recyclable metal cans and paperboard cans.
Single-serve packaging choices for canned fruits and vegetables appeal to consumers who live in smaller households or would rather regulate their portion sizes. This pattern corresponds with shifting lifestyle preferences and demography.
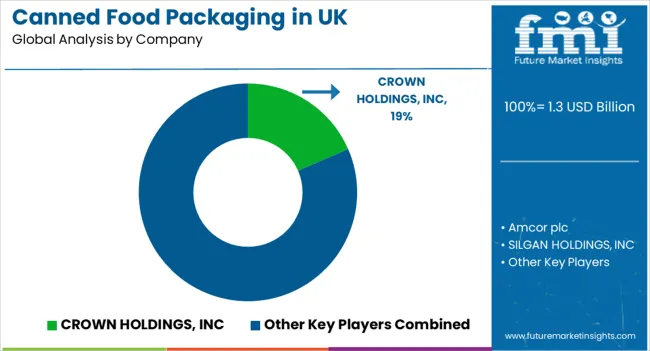
Companies operating in the canned food packaging business are concentrating on offering customized packaging solutions to meet end user requirements. They are also opting for strategies like acquisitions, mergers, partnerships, and collaborations to expand their footprint.
Recent developments in the United Kingdom canned food packaging business:
| Attribute | Details |
|---|---|
| Estimated United Kingdom Canned Food Packaging Business Value (2025) | USD 1.3 billion |
| Projected Value (2035) | USD 1.7 billion |
| Anticipated Growth Rate (2025 to 2035) | CAGR of 2.9% from 2025 to 2035 |
| Historical Data | 2020 to 2025 |
| Forecast Period | 2025 to 2035 |
| Quantitative Units | Revenue in USD million, Volume in Units and CAGR from 2025 to 2035 |
| Report Coverage | Revenue Forecast, Volume Forecast, Company Ranking, Competitive Landscape, Growth Factors, Trends and Pricing Analysis |
| Segments Covered | Material, Capacity, Product, End Use |
| Key Country Covered | United Kingdom |
| Key Companies Profiled |
CROWN HOLDINGS, INC; Amcor plc; SILGAN HOLDINGS, INC; MONDI PLC; SONOCO PRODUCTS COMPANY; TOYO SEIKAN CO.LTD.; TRIVIUM PACKAGING; ENVASES GROUP; CANPACK; THE MASSILLY GROUP; HOFFMANN NEOPAC AG; VISY INDUSTRIES |
The global canned food packaging industry analysis in the United Kingdom is estimated to be valued at USD 1.3 billion in 2025.
The market size for the canned food packaging industry analysis in the United Kingdom is projected to reach USD 1.7 billion by 2035.
The canned food packaging industry analysis in the United Kingdom is expected to grow at a 2.9% CAGR between 2025 and 2035.
The key product types in canned food packaging industry analysis in the United Kingdom are metal, _stainless steel, _aluminum, _tinplate, paperboard and plastic.
In terms of product, 2-piece can segment to command 51.3% share in the canned food packaging industry analysis in the United Kingdom in 2025.


Full Research Suite comprises of:
Market outlook & trends analysis
Interviews & case studies
Strategic recommendations
Vendor profiles & capabilities analysis
5-year forecasts
8 regions and 60+ country-level data splits
Market segment data splits
12 months of continuous data updates
DELIVERED AS:
PDF EXCEL ONLINE
Canned Fruits Market Size and Share Forecast Outlook 2025 to 2035
Overview of Key Trends Shaping Canned Tuna Business Landscape.
Canned Soup Market Size and Share Forecast Outlook 2025 to 2035
Canned Mackerel Market Analysis - Size, Share, and Forecast Outlook 2025 to 2035
Canned Anchovy Market Analysis - Size, Share, and Forecast Outlook 2025 to 2035
Canned Alcoholic Beverages Market Analysis by Product Type, Distribution Channel, and Region Through 2035
Canned Meat Market Insights - Industry Growth & Demand 2025 to 2035
Canned Pasta Market Trends - Convenience & Consumer Preferences 2025 to 2035
Canned Legumes Market Insights – Protein-Packed Convenience Foods 2025 to 2035
Canned Mushroom Market Analysis by Nature, Product Type, Form, and End-Use Application Through 2035
Canned Salmon Market Analysis by Source, Species, Form, and Sales Channel Through 2035
Canned Vegetable Market Growth – Preservation & Industry Demand 2024-2034
Canned Wine Market Size and Share Forecast Outlook 2025 to 2035
Canned Sardine Market Growth – Sustainable Seafood & Industry Demand 2024-2034
Canned Tuna Ingredients Market Analysis by Ingredients Type and End User Through 2035
Leading Providers & Market Share in Canned Tuna Industry
Analysis and Growth Projections for Canned Foods Business
Canned Food Packaging Market Size and Share Forecast Outlook 2025 to 2035
Market Share Insights of Canned Food Packaging Providers
Canned Seafood Market Size, Growth, and Forecast for 2025 to 2035

Thank you!
You will receive an email from our Business Development Manager. Please be sure to check your SPAM/JUNK folder too.
Chat With
MaRIA