Burn Care Market Size and Share Forecast Outlook 2025 to 2035

The burn care market is estimated to be valued at USD 2,023.5 million in 2025 and is projected to reach USD 4,660.1 million by 2035, registering a CAGR of 7.9% over the forecast period.
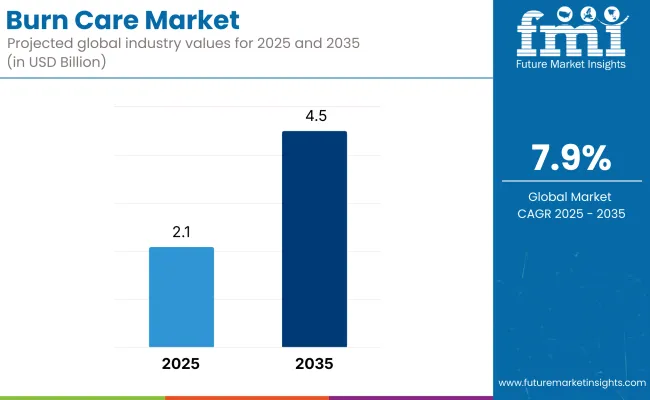
Quick Stats for Burn Care Market

  • Industry Value (2025): USD 2.1 billion
  • Forecast Value (2035): USD 4.5 billion
  • Forecast CAGR (2025–2035): 7.9%
  • Leading Segment in 2025: Burn Wound Dressings (driven by antimicrobial dressings, hydrocolloids, and bioengineered skin substitutes)
  • Key Growth Regions: North America, Europe, Asia-Pacific (notably China, India, Japan)
  • Top Key Players:
    • Mölnlycke Health Care AB
    • Cardinal Health
    • Smith & Nephew Plc
    • Urgo Medical North America
    • Convatec Inc.
    • Scapa Healthcare
    • Advanced Medical Solutions Ltd
    • DermaRite Industries, LLC.
    • Coloplast Group
    • B. Braun Melsungen AG
Metric Value
Market Size in 2025 USD 2.1 Billion
Projected Market Size in 2035 USD 4.5 Billion
CAGR (2025 to 2035) 7.9%

The burn care market has been evolving rapidly, driven by increasing incidence of thermal injuries, improvements in treatment protocols, and rising investment in advanced wound care technologies. Healthcare providers have prioritized adoption of innovative dressings, biologics, and skin substitutes to improve healing outcomes and reduce complications such as infection and scarring.

Manufacturers have focused on developing products that promote faster epithelialization, maintain optimal moisture balance, and enable atraumatic dressing changes, supporting wider adoption across acute and chronic burn management. Payers have increasingly recognized the cost-benefit of advanced wound therapies, reinforcing reimbursement support for evidence-based products

Analyzing Burn Care Market by Top Investment Segments

Burn Wound Dressings Lead the Market with Demand for Moisture-Retentive, Infection-Controlled Healing Solutions

Burn Wound Dressings is estimated to holds a revenue share of 67.8% has been attributed to burn wound dressings, reflecting their critical role as first-line therapy across a wide range of burn severities. Utilization has been supported by the clinical need to maintain a moist wound environment, manage exudate, and protect against microbial contamination.

Advances in dressing technologies have introduced materials that enable extended wear time, atraumatic removal, and delivery of antimicrobial agents, improving patient comfort and compliance. Hospitals and burn units have prioritized procurement of evidence-supported dressings that accelerate healing and reduce the risk of infection-related complications.
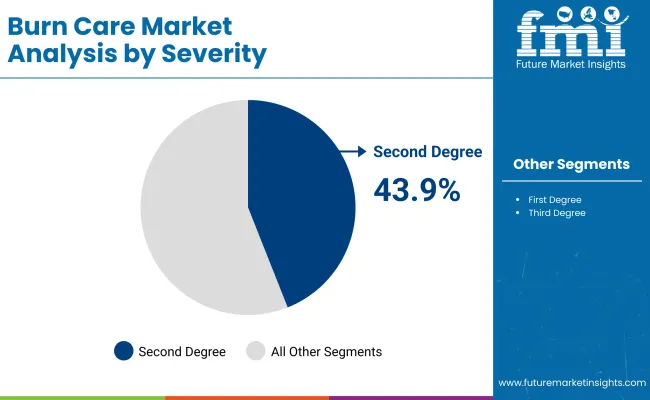
Second Degree Burns Dominate the Market with High Treatment Volumes and Focus on Optimizing Functional Recovery

Second Degree Burns is estimated to holds a revenue share of 43.9% has been attributed to second-degree burns, reflecting their prevalence and the clinical complexity of managing partial-thickness injuries. Treatment of these burns has been prioritized due to the heightened risk of fluid loss, infection, and hypertrophic scarring if not effectively managed.

Hospitals and specialized burn centers have emphasized standardized protocols involving advanced dressings and early excision techniques to optimize outcomes. Investments in training and infrastructure have been directed toward scaling care capacity for moderate to severe cases.
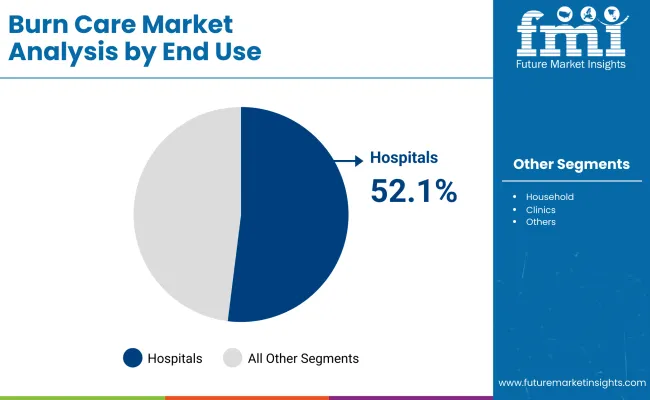
Hospitals Anchor the Market with Comprehensive Infrastructure and Multidisciplinary Burn Management Programs

Hospitals have accounted for 52.1% of market revenue, driven by their central role in delivering specialized burn care across acute, subacute, and reconstructive phases. Adoption has been supported by the availability of dedicated burn units equipped with advanced wound care technologies, infection control measures, and critical care infrastructure.

Multidisciplinary care teams have prioritized evidence-based protocols integrating surgical debridement, antimicrobial dressings, and rehabilitation services to address the complex needs of burn patients. Investments have been directed toward staff training, technology upgrades, and expansion of dedicated bed capacity to address rising caseloads.

The competitive landscape in the burn care market has been shaped by companies investing in advanced wound dressings, bioengineered skin substitutes, and antimicrobial therapies to improve healing outcomes and differentiate their portfolios.

Leading manufacturers have prioritized expanding production capacity and securing regulatory approvals for next-generation products designed to accelerate epithelialization and reduce infection risks. Strategic partnerships with hospitals and specialized burn centers have been established to support clinician training and protocol adoption. Companies have also invested in digital platforms to enable remote monitoring of wound healing progress and enhance patient engagement.

Challenges and Opportunities

Challenge

High Treatment Costs and Limited Access to Advanced Burn Care

Global scarcity of skilled burn care specialists and healthcare workers also acts as a hindrance to the market slow down. There is limited access to specialized burn care centres in the world, especially in low- and middle-income countries, where health systems and hospitals are underdeveloped. Furthermore, post-burn complications like infections, scarring, and long-term rehabilitation needs add to the overall healthcare burden, making affordability and accessibility major issues.

Opportunity

Advancements in Regenerative Medicine and Skin Substitutes

The burn care market with a growing focus on regenerative medicine, bioengineered skin substitutes, and novel therapies for wound healing. Advancements in stem cell therapies, nanotechnology-based dressings, and 3D bio printing of skin are changing the way doctors approach burn treatment.

Moreover, with the growing utilization of telemedicine and the development of AI-based wound assessment platforms, not only the patient management is preserved, but access to specialized treatment is increased as well. Growth in the Advanced Wound Care Market for Innovative, Affordable Products and Customized and Effective Burn Treatment Products.
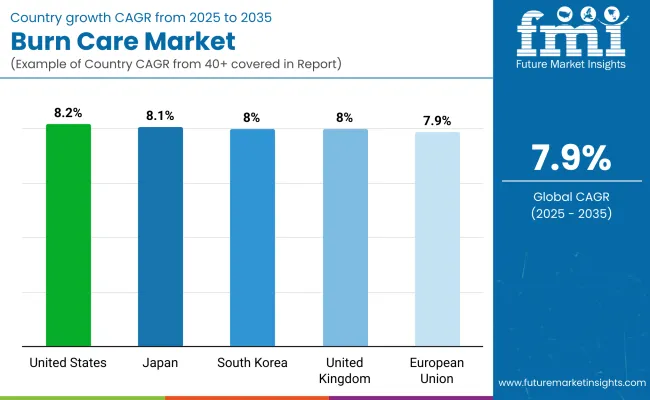
Country-wise Outlook

United States

The United States burn care market is flourishing because of the rising demand for new born healing solutions to deal with necessities of growing burn patients. More than 450,000 burn injuries in the USA require medical treatment every year, and demand for advanced wound care products, skin grafts and bioengineered tissue substitutes is robust, the American Burn Association (ABA) estimates.

A number of next-generation burn care products, such as antimicrobial dressings, hydrogel-based therapies, and biologics, have undergone clinical evaluation, and FDA approval for some to promote healing and reduce the likelihood of infection. Additionally, rising prevalence of diabetes and chronic wounds is augmenting the use of enzymatic debridement and moist wound healing therapies.

Government funding for burn research, along with the establishment of specialized burn centers and trauma hospitals also facilitates market growth. The other major factor is the military and defence segment which calls for increased investments in burn treatment solutions owing to high cases of burn injuries as a result of the combat.

Country CAGR (2025 to 2035)
USA 8.2%

United Kingdom

Rising awareness related to burn injury management, increasing investment in healthcare infrastructure and high demand for bioengineered skin substitutes are some of the factors boosting growth in the burn care market in the United Kingdom. NHS innovations to develop trauma and emergency care services are helping to establish the use of novel burn dressings, including hydrocolloid dressings, and antibiotics.

The UK has a world-leading research base in regenerative medicine and stem cell therapy, both of which are driving developing in skin grafts and bioengineered scaffolds for use in patients with severe burns. In addition, stringent healthcare quality standards mandate hospitals to adopt evidence-based and cost-effective treatments for burn management.

The rise in instances of home accidents along with industrial burns and fire-inflicted injuries are the key factors pushing the growth of the market. Furthermore, partnerships between biotech companies and research universities are speeding up the development of next generation burn healing products, such as nanotech-based bandages and growth-factor therapies.

Country CAGR (2025 to 2035)
UK 8.0%

European Union

The burn care market in European Union (EU) is on a course for a pungent growth ride, making way on swelling healthcare expenditure, favourable regulatory landscape for innovations in burn treatment, and growing incidences of burn injuries. European Union (EU) policies, including the Medical Device Regulation (MDR) and Horizon Europe grant funding, aim to incentivize innovation in advanced wound care products, including hydrofiber dressings, silver-based antimicrobials and bioengineered skin substitutes.

In the fields of clinical research and regenerative medicine, Germany, France, and Italy are leading the way in burn care innovations. Another factor propelling demand for moist wound healing technologies and enzymatic debridement solutions is the aging population and increasing incidences of chronic disorders like diabetes.

In addition, increasing concerns about workplace safety and burn injuries in industrial facilities are driving investments in emergency burn kits, skin regeneration treatments, and autologous cell-based therapies. There is also increased uptake of biodegradable and plant-based wound dressing materials, driven by the EU’s focus on sustainability.

Country CAGR (2025 to 2035)
EU 7.9%

Japan

The key factors driving the Japan burn care market has been biotechnology innovation, high investment in regenerative medicine, and government-driven healthcare modernization initiatives. On the other hand, more research is being conducted on bioengineered skin substitutes, hydrogel dressings, and nanotechnology-based burn treatments by Japanese MHLW initiatives.

The progressive growth of wound care therapies is driven by an aging population in Japan that leads to increased chronic wounds and non-healing patients. Additionally, a strong emphasis on robotics and AI-based healthcare solutions in the country has led to the development of smart dressings and automated burn-stabilization guidelines.

These are also known as burn scar management and skin regeneration therapy products, because the market in Japan has been heavily influenced by the cosmetic and aesthetic industry. In addition, joint ventures between pharmaceutical organizations and scientific institutions are driving innovative burn healing solutions into the market.

Country CAGR (2025 to 2035)
Japan 8.1%

South Korea

Increasing healthcare expenditure, growing usage of aesthetic scar prevention and advancing wound care technologies are some of the factors that have been driving growth in the South Korean burn care market. The MOHW is not that when it comes to the promotion of biotechnology research, which is where the advances in hydrocolloid dressings, growth factor therapies and 3D printed skin substitutes will follow.

Demand for advanced cosmetic surgery is a contributor to the relatively high availability of cosmetic surgery in South Korea, as patients seeking effective scar minimization treatments after burn injuries drive demand. The rising incidence of burn injuries primarily in workplace & industrial settings is also expected to fuel the growing demand for high-performance burn dressings & advance burn treatment solutions in the market.

It is the South Korean advances in nanomedicine and bioactive wound dressings that are scaling up recovery rates for burns, but foreign pharmaceutical companies also enter into accord with the Korean firms to fast-track the development of smart burn dressings (dressings that respond to skin infections) for burn care..

Country CAGR (2025 to 2035)
South Korea 8.0%

Competitive Outlook

The increasing utilization of advanced wound dressings, skin grafts, and biologics, combined with enhancement in healthcare infrastructure and reimbursement policies, is driving the expansion of the market. Moreover, their increasing prevalence on account of burn injuries owing to industrial accidents, household burns, and fire are propelling the demand for efficient burn care products.

Key Development

In 2025, AVITA Medical, Inc. showcased wound care portfolio, including RECELL®, Cohealyx™, and PermeaDerm®, in the American Burn Association (ABA) 2025 Annual Meeting and showcased expanded evidence base and commitment to improving outcomes in burn and wound management.

In 2025, KeriCure Medical and CNTR Begin First Clinical Trial on Cutting Edge Spray-on Wound Dressing for Burns.

Companies

  • Mölnlycke Health Care AB
  • Cardinal Health
  • Smith & Nephew Plc
  • Urgo Medical North America
  • Convatec Inc.
  • Scapa Healthcare
  • Advanced Medical Solutions Ltd
  • AKLA AB
  • Stapleline Medizintechnik GmbH
  • Aero Healthcare
  • Beier Drawtex Healthcare
  • DermaRite Industries, LLC.
  • Coloplast Group
  • B. Braun Melsungen AG

Key Segments

By Product Type:

  • Burn Wound Dressings
  • Topical Burn Medications

By End Use:

  • Household
  • Hospitals
  • Clinics
  • Others

By Severity:

  • First Degree Burns
  • Second Degree Burns
  • Third Degree Burns

By Sales Channel:

  • Online Channel
  • Offline Channel

By Region:

  • North America
  • Latin America
  • Europe
  • East Asia
  • South Asia
  • Oceania
  • MEA

Table of Content

  1. Executive Summary
  2. Industry Introduction, including Taxonomy and Market Definition
  3. Market Trends and Success Factors, including Macro-economic Factors, Market Dynamics, and Recent Industry Developments
  4. Global Market Demand Analysis 2020 to 2024 and Forecast 2025 to 2035, including Historical Analysis and Future Projections
  5. Global Market Analysis 2020 to 2024 and Forecast 2025 to 2035
    • Product Type
    • End Use
    • Severity
    • Sales Channel
  6. Global Market Analysis 2020 to 2024 and Forecast 2025 to 2035, By Product Type
    • Burn Wound Dressings
    • Topical Burn Medications
  7. Global Market Analysis 2020 to 2024 and Forecast 2025 to 2035, By End Use
    • Household
    • Hospitals
    • Clinics
    • Others
  8. Global Market Analysis 2020 to 2024 and Forecast 2025 to 2035, By Severity
    • First Degree Burns
    • Second Degree Burns
    • Third Degree Burns
  9. Global Market Analysis 2020 to 2024 and Forecast 2025 to 2035, By Sales Channel
    • Online Channel
    • Offline Channel
  10. Global Burn Care Market Analysis 2020 to 2024 and Forecast 2025 to 2035, By Region
    • North America
    • Latin America
    • East Asia
    • South Asia & Pacific
    • Eastern Europe
    • Western Europe
    • Middle East & Africa
  11. North America Sales Analysis 2020 to 2024 and Forecast 2025 to 2035, by Key Segments and Countries
  12. Latin America Sales Analysis 2020 to 2024 and Forecast 2025 to 2035, by Key Segments and Countries
  13. East Asia Sales Analysis 2020 to 2024 and Forecast 2025 to 2035, by Key Segments and Countries
  14. South Asia & Pacific Sales Analysis 2020 to 2024 and Forecast 2025 to 2035, by Key Segments and Countries
  15. Eastern Europe Sales Analysis 2020 to 2024 and Forecast 2025 to 2035, by Key Segments and Countries
  16. Western Europe Sales Analysis 2020 to 2024 and Forecast 2025 to 2035, by Key Segments and Countries
  17. Middle East & Africa Sales Analysis 2020 to 2024 and Forecast 2025 to 2035, by Key Segments and Countries
  18. Sales Forecast 2025 to 2035 by Product Type, End Use, Severity, and Sales Channel for 30 Countries
  19. Competition Outlook, including Market Structure Analysis, Company Share Analysis by Key Players, and Competition Dashboard
  20. Company Profile
    • Johnson and Johnson Services, Inc.
    • Smith & Nephew
    • Acme Valued Corporation
    • ConvaTec Group
    • Mölnlycke Health Care
    • Boiron USA
    • Areza Medical
    • Dynarex Corporation
    • De Royal Industries, Inc.
    • Cardinal Health, Inc.

List of Tables

  • Table 1: Global Market Value (USD Million) Forecast by Region, 2020 to 2035
  • Table 2: Global Market Volume (Units) Forecast by Region, 2020 to 2035
  • Table 3: Global Market Value (USD Million) Forecast by Product Type, 2020 to 2035
  • Table 4: Global Market Volume (Units) Forecast by Product Type, 2020 to 2035
  • Table 5: Global Market Value (USD Million) Forecast by Severity, 2020 to 2035
  • Table 6: Global Market Volume (Units) Forecast by Severity, 2020 to 2035
  • Table 7: Global Market Value (USD Million) Forecast by End Use, 2020 to 2035
  • Table 8: Global Market Volume (Units) Forecast by End Use, 2020 to 2035
  • Table 9: North America Market Value (USD Million) Forecast by Country, 2020 to 2035
  • Table 10: North America Market Volume (Units) Forecast by Country, 2020 to 2035
  • Table 11: North America Market Value (USD Million) Forecast by Product Type, 2020 to 2035
  • Table 12: North America Market Volume (Units) Forecast by Product Type, 2020 to 2035
  • Table 13: North America Market Value (USD Million) Forecast by Severity, 2020 to 2035
  • Table 14: North America Market Volume (Units) Forecast by Severity, 2020 to 2035
  • Table 15: North America Market Value (USD Million) Forecast by End Use, 2020 to 2035
  • Table 16: North America Market Volume (Units) Forecast by End Use, 2020 to 2035
  • Table 17: Latin America Market Value (USD Million) Forecast by Country, 2020 to 2035
  • Table 18: Latin America Market Volume (Units) Forecast by Country, 2020 to 2035
  • Table 19: Latin America Market Value (USD Million) Forecast by Product Type, 2020 to 2035
  • Table 20: Latin America Market Volume (Units) Forecast by Product Type, 2020 to 2035
  • Table 21: Latin America Market Value (USD Million) Forecast by Severity, 2020 to 2035
  • Table 22: Latin America Market Volume (Units) Forecast by Severity, 2020 to 2035
  • Table 23: Latin America Market Value (USD Million) Forecast by End Use, 2020 to 2035
  • Table 24: Latin America Market Volume (Units) Forecast by End Use, 2020 to 2035
  • Table 25: Europe Market Value (USD Million) Forecast by Country, 2020 to 2035
  • Table 26: Europe Market Volume (Units) Forecast by Country, 2020 to 2035
  • Table 27: Europe Market Value (USD Million) Forecast by Product Type, 2020 to 2035
  • Table 28: Europe Market Volume (Units) Forecast by Product Type, 2020 to 2035
  • Table 29: Europe Market Value (USD Million) Forecast by Severity, 2020 to 2035
  • Table 30: Europe Market Volume (Units) Forecast by Severity, 2020 to 2035
  • Table 31: Europe Market Value (USD Million) Forecast by End Use, 2020 to 2035
  • Table 32: Europe Market Volume (Units) Forecast by End Use, 2020 to 2035
  • Table 33: Asia Pacific Market Value (USD Million) Forecast by Country, 2020 to 2035
  • Table 34: Asia Pacific Market Volume (Units) Forecast by Country, 2020 to 2035
  • Table 35: Asia Pacific Market Value (USD Million) Forecast by Product Type, 2020 to 2035
  • Table 36: Asia Pacific Market Volume (Units) Forecast by Product Type, 2020 to 2035
  • Table 37: Asia Pacific Market Value (USD Million) Forecast by Severity, 2020 to 2035
  • Table 38: Asia Pacific Market Volume (Units) Forecast by Severity, 2020 to 2035
  • Table 39: Asia Pacific Market Value (USD Million) Forecast by End Use, 2020 to 2035
  • Table 40: Asia Pacific Market Volume (Units) Forecast by End Use, 2020 to 2035
  • Table 41: MEA Market Value (USD Million) Forecast by Country, 2020 to 2035
  • Table 42: MEA Market Volume (Units) Forecast by Country, 2020 to 2035
  • Table 43: MEA Market Value (USD Million) Forecast by Product Type, 2020 to 2035
  • Table 44: MEA Market Volume (Units) Forecast by Product Type, 2020 to 2035
  • Table 45: MEA Market Value (USD Million) Forecast by Severity, 2020 to 2035
  • Table 46: MEA Market Volume (Units) Forecast by Severity, 2020 to 2035
  • Table 47: MEA Market Value (USD Million) Forecast by End Use, 2020 to 2035
  • Table 48: MEA Market Volume (Units) Forecast by End Use, 2020 to 2035

List of Figures

  • Figure 1: Global Market Value (USD Million) by Product Type, 2025 to 2035
  • Figure 2: Global Market Value (USD Million) by Severity, 2025 to 2035
  • Figure 3: Global Market Value (USD Million) by End Use, 2025 to 2035
  • Figure 4: Global Market Value (USD Million) by Region, 2025 to 2035
  • Figure 5: Global Market Value (USD Million) Analysis by Region, 2020 to 2035
  • Figure 6: Global Market Volume (Units) Analysis by Region, 2020 to 2035
  • Figure 7: Global Market Value Share (%) and BPS Analysis by Region, 2025 to 2035
  • Figure 8: Global Market Y-o-Y Growth (%) Projections by Region, 2025 to 2035
  • Figure 9: Global Market Value (USD Million) Analysis by Product Type, 2020 to 2035
  • Figure 10: Global Market Volume (Units) Analysis by Product Type, 2020 to 2035
  • Figure 11: Global Market Value Share (%) and BPS Analysis by Product Type, 2025 to 2035
  • Figure 12: Global Market Y-o-Y Growth (%) Projections by Product Type, 2025 to 2035
  • Figure 13: Global Market Value (USD Million) Analysis by Severity, 2020 to 2035
  • Figure 14: Global Market Volume (Units) Analysis by Severity, 2020 to 2035
  • Figure 15: Global Market Value Share (%) and BPS Analysis by Severity, 2025 to 2035
  • Figure 16: Global Market Y-o-Y Growth (%) Projections by Severity, 2025 to 2035
  • Figure 17: Global Market Value (USD Million) Analysis by End Use, 2020 to 2035
  • Figure 18: Global Market Volume (Units) Analysis by End Use, 2020 to 2035
  • Figure 19: Global Market Value Share (%) and BPS Analysis by End Use, 2025 to 2035
  • Figure 20: Global Market Y-o-Y Growth (%) Projections by End Use, 2025 to 2035
  • Figure 21: Global Market Attractiveness by Product Type, 2025 to 2035
  • Figure 22: Global Market Attractiveness by Severity, 2025 to 2035
  • Figure 23: Global Market Attractiveness by End Use, 2025 to 2035
  • Figure 24: Global Market Attractiveness by Region, 2025 to 2035
  • Figure 25: North America Market Value (USD Million) by Product Type, 2025 to 2035
  • Figure 26: North America Market Value (USD Million) by Severity, 2025 to 2035
  • Figure 27: North America Market Value (USD Million) by End Use, 2025 to 2035
  • Figure 28: North America Market Value (USD Million) by Country, 2025 to 2035
  • Figure 29: North America Market Value (USD Million) Analysis by Country, 2020 to 2035
  • Figure 30: North America Market Volume (Units) Analysis by Country, 2020 to 2035
  • Figure 31: North America Market Value Share (%) and BPS Analysis by Country, 2025 to 2035
  • Figure 32: North America Market Y-o-Y Growth (%) Projections by Country, 2025 to 2035
  • Figure 33: North America Market Value (USD Million) Analysis by Product Type, 2020 to 2035
  • Figure 34: North America Market Volume (Units) Analysis by Product Type, 2020 to 2035
  • Figure 35: North America Market Value Share (%) and BPS Analysis by Product Type, 2025 to 2035
  • Figure 36: North America Market Y-o-Y Growth (%) Projections by Product Type, 2025 to 2035
  • Figure 37: North America Market Value (USD Million) Analysis by Severity, 2020 to 2035
  • Figure 38: North America Market Volume (Units) Analysis by Severity, 2020 to 2035
  • Figure 39: North America Market Value Share (%) and BPS Analysis by Severity, 2025 to 2035
  • Figure 40: North America Market Y-o-Y Growth (%) Projections by Severity, 2025 to 2035
  • Figure 41: North America Market Value (USD Million) Analysis by End Use, 2020 to 2035
  • Figure 42: North America Market Volume (Units) Analysis by End Use, 2020 to 2035
  • Figure 43: North America Market Value Share (%) and BPS Analysis by End Use, 2025 to 2035
  • Figure 44: North America Market Y-o-Y Growth (%) Projections by End Use, 2025 to 2035
  • Figure 45: North America Market Attractiveness by Product Type, 2025 to 2035
  • Figure 46: North America Market Attractiveness by Severity, 2025 to 2035
  • Figure 47: North America Market Attractiveness by End Use, 2025 to 2035
  • Figure 48: North America Market Attractiveness by Country, 2025 to 2035
  • Figure 49: Latin America Market Value (USD Million) by Product Type, 2025 to 2035
  • Figure 50: Latin America Market Value (USD Million) by Severity, 2025 to 2035
  • Figure 51: Latin America Market Value (USD Million) by End Use, 2025 to 2035
  • Figure 52: Latin America Market Value (USD Million) by Country, 2025 to 2035
  • Figure 53: Latin America Market Value (USD Million) Analysis by Country, 2020 to 2035
  • Figure 54: Latin America Market Volume (Units) Analysis by Country, 2020 to 2035
  • Figure 55: Latin America Market Value Share (%) and BPS Analysis by Country, 2025 to 2035
  • Figure 56: Latin America Market Y-o-Y Growth (%) Projections by Country, 2025 to 2035
  • Figure 57: Latin America Market Value (USD Million) Analysis by Product Type, 2020 to 2035
  • Figure 58: Latin America Market Volume (Units) Analysis by Product Type, 2020 to 2035
  • Figure 59: Latin America Market Value Share (%) and BPS Analysis by Product Type, 2025 to 2035
  • Figure 60: Latin America Market Y-o-Y Growth (%) Projections by Product Type, 2025 to 2035
  • Figure 61: Latin America Market Value (USD Million) Analysis by Severity, 2020 to 2035
  • Figure 62: Latin America Market Volume (Units) Analysis by Severity, 2020 to 2035
  • Figure 63: Latin America Market Value Share (%) and BPS Analysis by Severity, 2025 to 2035
  • Figure 64: Latin America Market Y-o-Y Growth (%) Projections by Severity, 2025 to 2035
  • Figure 65: Latin America Market Value (USD Million) Analysis by End Use, 2020 to 2035
  • Figure 66: Latin America Market Volume (Units) Analysis by End Use, 2020 to 2035
  • Figure 67: Latin America Market Value Share (%) and BPS Analysis by End Use, 2025 to 2035
  • Figure 68: Latin America Market Y-o-Y Growth (%) Projections by End Use, 2025 to 2035
  • Figure 69: Latin America Market Attractiveness by Product Type, 2025 to 2035
  • Figure 70: Latin America Market Attractiveness by Severity, 2025 to 2035
  • Figure 71: Latin America Market Attractiveness by End Use, 2025 to 2035
  • Figure 72: Latin America Market Attractiveness by Country, 2025 to 2035
  • Figure 73: Europe Market Value (USD Million) by Product Type, 2025 to 2035
  • Figure 74: Europe Market Value (USD Million) by Severity, 2025 to 2035
  • Figure 75: Europe Market Value (USD Million) by End Use, 2025 to 2035
  • Figure 76: Europe Market Value (USD Million) by Country, 2025 to 2035
  • Figure 77: Europe Market Value (USD Million) Analysis by Country, 2020 to 2035
  • Figure 78: Europe Market Volume (Units) Analysis by Country, 2020 to 2035
  • Figure 79: Europe Market Value Share (%) and BPS Analysis by Country, 2025 to 2035
  • Figure 80: Europe Market Y-o-Y Growth (%) Projections by Country, 2025 to 2035
  • Figure 81: Europe Market Value (USD Million) Analysis by Product Type, 2020 to 2035
  • Figure 82: Europe Market Volume (Units) Analysis by Product Type, 2020 to 2035
  • Figure 83: Europe Market Value Share (%) and BPS Analysis by Product Type, 2025 to 2035
  • Figure 84: Europe Market Y-o-Y Growth (%) Projections by Product Type, 2025 to 2035
  • Figure 85: Europe Market Value (USD Million) Analysis by Severity, 2020 to 2035
  • Figure 86: Europe Market Volume (Units) Analysis by Severity, 2020 to 2035
  • Figure 87: Europe Market Value Share (%) and BPS Analysis by Severity, 2025 to 2035
  • Figure 88: Europe Market Y-o-Y Growth (%) Projections by Severity, 2025 to 2035
  • Figure 89: Europe Market Value (USD Million) Analysis by End Use, 2020 to 2035
  • Figure 90: Europe Market Volume (Units) Analysis by End Use, 2020 to 2035
  • Figure 91: Europe Market Value Share (%) and BPS Analysis by End Use, 2025 to 2035
  • Figure 92: Europe Market Y-o-Y Growth (%) Projections by End Use, 2025 to 2035
  • Figure 93: Europe Market Attractiveness by Product Type, 2025 to 2035
  • Figure 94: Europe Market Attractiveness by Severity, 2025 to 2035
  • Figure 95: Europe Market Attractiveness by End Use, 2025 to 2035
  • Figure 96: Europe Market Attractiveness by Country, 2025 to 2035
  • Figure 97: Asia Pacific Market Value (USD Million) by Product Type, 2025 to 2035
  • Figure 98: Asia Pacific Market Value (USD Million) by Severity, 2025 to 2035
  • Figure 99: Asia Pacific Market Value (USD Million) by End Use, 2025 to 2035
  • Figure 100: Asia Pacific Market Value (USD Million) by Country, 2025 to 2035
  • Figure 101: Asia Pacific Market Value (USD Million) Analysis by Country, 2020 to 2035
  • Figure 102: Asia Pacific Market Volume (Units) Analysis by Country, 2020 to 2035
  • Figure 103: Asia Pacific Market Value Share (%) and BPS Analysis by Country, 2025 to 2035
  • Figure 104: Asia Pacific Market Y-o-Y Growth (%) Projections by Country, 2025 to 2035
  • Figure 105: Asia Pacific Market Value (USD Million) Analysis by Product Type, 2020 to 2035
  • Figure 106: Asia Pacific Market Volume (Units) Analysis by Product Type, 2020 to 2035
  • Figure 107: Asia Pacific Market Value Share (%) and BPS Analysis by Product Type, 2025 to 2035
  • Figure 108: Asia Pacific Market Y-o-Y Growth (%) Projections by Product Type, 2025 to 2035
  • Figure 109: Asia Pacific Market Value (USD Million) Analysis by Severity, 2020 to 2035
  • Figure 110: Asia Pacific Market Volume (Units) Analysis by Severity, 2020 to 2035
  • Figure 111: Asia Pacific Market Value Share (%) and BPS Analysis by Severity, 2025 to 2035
  • Figure 112: Asia Pacific Market Y-o-Y Growth (%) Projections by Severity, 2025 to 2035
  • Figure 113: Asia Pacific Market Value (USD Million) Analysis by End Use, 2020 to 2035
  • Figure 114: Asia Pacific Market Volume (Units) Analysis by End Use, 2020 to 2035
  • Figure 115: Asia Pacific Market Value Share (%) and BPS Analysis by End Use, 2025 to 2035
  • Figure 116: Asia Pacific Market Y-o-Y Growth (%) Projections by End Use, 2025 to 2035
  • Figure 117: Asia Pacific Market Attractiveness by Product Type, 2025 to 2035
  • Figure 118: Asia Pacific Market Attractiveness by Severity, 2025 to 2035
  • Figure 119: Asia Pacific Market Attractiveness by End Use, 2025 to 2035
  • Figure 120: Asia Pacific Market Attractiveness by Country, 2025 to 2035
  • Figure 121: MEA Market Value (USD Million) by Product Type, 2025 to 2035
  • Figure 122: MEA Market Value (USD Million) by Severity, 2025 to 2035
  • Figure 123: MEA Market Value (USD Million) by End Use, 2025 to 2035
  • Figure 124: MEA Market Value (USD Million) by Country, 2025 to 2035
  • Figure 125: MEA Market Value (USD Million) Analysis by Country, 2020 to 2035
  • Figure 126: MEA Market Volume (Units) Analysis by Country, 2020 to 2035
  • Figure 127: MEA Market Value Share (%) and BPS Analysis by Country, 2025 to 2035
  • Figure 128: MEA Market Y-o-Y Growth (%) Projections by Country, 2025 to 2035
  • Figure 129: MEA Market Value (USD Million) Analysis by Product Type, 2020 to 2035
  • Figure 130: MEA Market Volume (Units) Analysis by Product Type, 2020 to 2035
  • Figure 131: MEA Market Value Share (%) and BPS Analysis by Product Type, 2025 to 2035
  • Figure 132: MEA Market Y-o-Y Growth (%) Projections by Product Type, 2025 to 2035
  • Figure 133: MEA Market Value (USD Million) Analysis by Severity, 2020 to 2035
  • Figure 134: MEA Market Volume (Units) Analysis by Severity, 2020 to 2035
  • Figure 135: MEA Market Value Share (%) and BPS Analysis by Severity, 2025 to 2035
  • Figure 136: MEA Market Y-o-Y Growth (%) Projections by Severity, 2025 to 2035
  • Figure 137: MEA Market Value (USD Million) Analysis by End Use, 2020 to 2035
  • Figure 138: MEA Market Volume (Units) Analysis by End Use, 2020 to 2035
  • Figure 139: MEA Market Value Share (%) and BPS Analysis by End Use, 2025 to 2035
  • Figure 140: MEA Market Y-o-Y Growth (%) Projections by End Use, 2025 to 2035
  • Figure 141: MEA Market Attractiveness by Product Type, 2025 to 2035
  • Figure 142: MEA Market Attractiveness by Severity, 2025 to 2035
  • Figure 143: MEA Market Attractiveness by End Use, 2025 to 2035
  • Figure 144: MEA Market Attractiveness by Country, 2025 to 2035

Frequently Asked Questions

What was the overall size of the burn care market in 2025?

The overall market size for burn care market was USD 2.1 billion in 2025.

How big the burn care market is expected in 2035?

The burn care market is expected to reach USD 4.5 billion in 2035.

What will drive the demand for burn care market during the forecast period?

The growth of the burn care market will be driven by increasing incidences of burn injuries, advancements in wound healing treatments, and rising demand for innovative dressings and skin grafting technologies.

List the top 5 countries contributing in burn care market?

The top 5 countries which drives the development of burn care market are USA, European Union, Japan, South Korea and UK.

Which segment in type is expected to lead burn care market?

Hospitals and Households to command significant share over the assessment period.

Explore Similar Insights

Future Market Insights

Burn Care Market