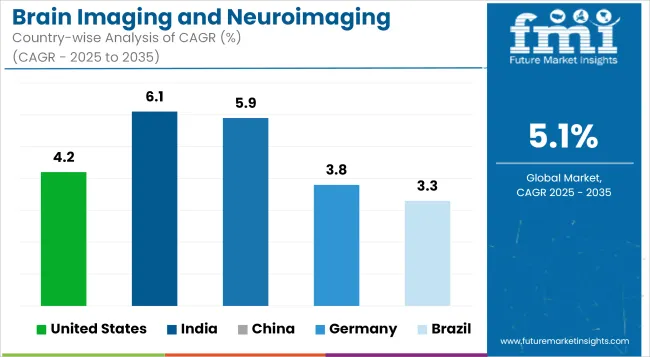
The Brain Imaging and Neuroimaging Market is anticipated to be valued at USD 15.1 billion in 2025 and is expected to reach USD 24.8 billion by 2035, registering a CAGR of 5.1%.
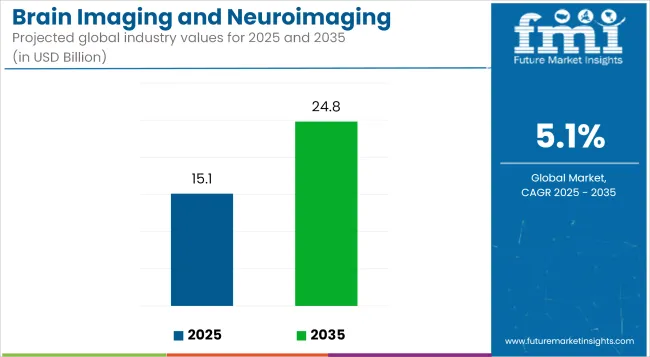
| Metric | Value |
|---|---|
| Industry Size (2025E) | USD 15.1 billion |
| Industry Value (2035F) | USD 24.8 billion |
| CAGR (2025 to 2035) | 5.1% |
The Brain Imaging and Neuroimaging Market is experiencing robust growth, driven by escalating neurological disorders, technological advancements, and increased demand for early diagnosis. Innovations in imaging modalities like MRI, CT, PET, and functional imaging are enhancing the detection and monitoring of brain-related diseases.
The integration of artificial intelligence (AI) and machine learning is further refining diagnostic accuracy and efficiency. Wearable and portable brain imaging technologies are gaining traction, enabling point-of-care and remote applications.
Government and private sector investments in neurology-specific research and development are fueling innovation, particularly in Alzheimer's, Parkinson's, and stroke diagnosis. These factors collectively contribute to the expansion of the neuroimaging solutions market, paving the way for smarter, faster, and more accessible diagnostic tools.
Prominent players in the Brain Imaging and Neuroimaging Market include GE HealthCare, Siemens Healthineers, Philips Healthcare, Canon Medical Systems, and Hitachi Medical Systems. These companies are at the forefront of developing advanced imaging technologies, integrating AI to enhance diagnostic capabilities.
In January 2024, Hyperfine, Inc. announced the launch of the AI-powered eighth generation of Swoop® system software. The latest software improves Swoop® system image quality and introduces valuable ease-of-use features, including a real-time aid for more precise patient loading and positioning and a streamlined image upload process.
“Our latest AI-powered software, the eighth generation of our proprietary software platform, embodies our commitment to supporting clinicians in critical decision-making,” said Tom Teisseyre PhD, Chief Operating Officer of Hyperfine, Inc.
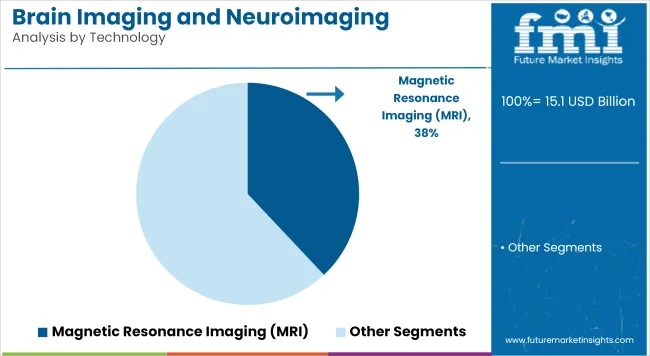
Magnetic Resonance Imaging (MRI) is projected to maintain dominance in the brain imaging and neuroimaging market, accounting for 38.0% of revenue share in 2025. This leadership is being sustained by MRI’s superior soft tissue contrast, which allows for high-resolution visualization of neurological structures without ionizing radiation exposure.
Widespread adoption in both acute and chronic neurological disorder diagnosis has been promoted by its precision in detecting abnormalities in brain anatomy and function. The segment’s growth has also been fueled by technological advancements such as functional MRI (fMRI), diffusion tensor imaging (DTI), and AI-integrated image reconstruction techniques.
These innovations have allowed for more detailed neurofunctional assessments, particularly in cognitive mapping, epilepsy evaluation, and brain tumor characterization. Additionally, reimbursement policies and rising investments in diagnostic imaging infrastructure across hospitals and academic institutes have ensured broad clinical integration. The MRI modality is increasingly preferred in both developed and emerging economies due to its versatility, safety profile, and expanding utility in neuropsychiatric and neurodegenerative applications.
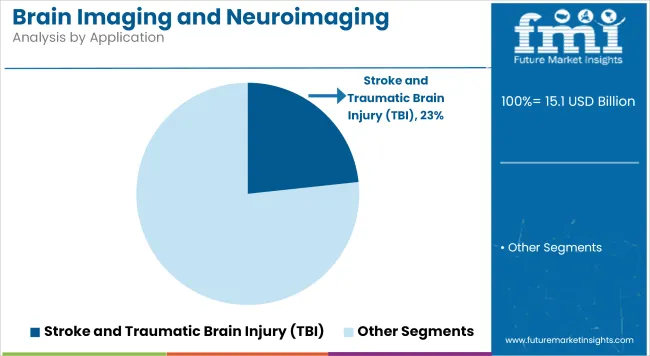
Stroke and Traumatic Brain Injury (TBI) are estimated to hold a 23.3% share of the overall market in 2025, positioning this as the leading application segment. This prominence is being driven by the rising global burden of cerebrovascular and trauma-related neurological emergencies, which require rapid imaging assessment for survival and rehabilitation outcomes.
Imaging modalities such as MRI, CT, and PET have been widely adopted for their efficacy in detecting ischemic damage, hemorrhages, and tissue perfusion deficits in acute stroke and TBI cases. Advancements in perfusion imaging and diffusion-weighted sequences have played a crucial role in enhancing diagnostic speed and accuracy.
The prioritization of stroke-ready hospitals and neurocritical care protocols globally has reinforced the need for immediate imaging in emergency settings. Additionally, increasing awareness of long-term cognitive and motor impacts of TBI has expanded the scope of routine monitoring through neuroimaging. Strategic initiatives by neurological foundations and growing healthcare expenditure on trauma centers are expected to continue supporting the sustained dominance of this application area.
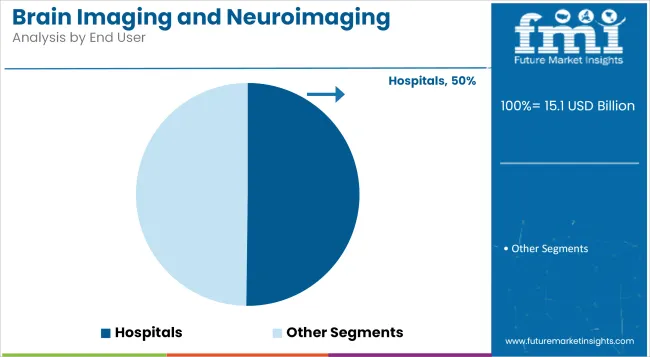
Hospitals are projected to contribute 50.2% of the total revenue share in 2025, making them the dominant end-user in the brain imaging and neuroimaging market. This position is being supported by the centralized deployment of advanced diagnostic infrastructure, including MRI, PET, SPECT, and EEG systems within tertiary and quaternary care institutions.
The availability of specialized neurologists, radiologists, and trained technologists in hospital settings has been critical in ensuring clinical accuracy and timely intervention. Integrated care pathways for neurological emergencies, chronic neurodegenerative disorders, and surgical planning are routinely executed in hospital environments, leading to high patient throughput.
Moreover, favorable reimbursement frameworks and funding for upgrading radiology departments especially in developed countries have accelerated the procurement of AI-enhanced imaging systems. The increasing incidence of hospital-based stroke care programs, trauma response units, and neuro-oncology centers has further strengthened hospital-centric imaging demand. As a result, hospitals continue to serve as the cornerstone for comprehensive brain imaging solutions across both inpatient and outpatient settings.
Regulatory Hurdles Slowing Technological Adoption Are a Major Restraining Factor
Regulatory challenges pose a significant constraint to the commercialization of emerging imaging technologies and the diffusion of the same into the market. The lengthy adjudication time in obtaining those second approvals from FDA, EMA, and other global regulatory authorities lead to longer product development timelines, higher compliance costs, and slower market introductions, all detrimental to the innovative development of those products.
It not only affects the manufacturers but also hinders healthcare providers from accessing new and advanced neuroimaging developments, also influencing the overall growth of the market.The existence of varying regulations across regions adds to barriers for companies wishing to expand their domains internationally.
Although regulations are needed for patient safety and device effectiveness, their elaborative and time- consuming nature frustrates technological progress. Fast-track approval processes with a harmonized international standard and close collaboration between regulators and industry will be therefore vital in solving these challenges to accelerate innovation and improve access without compromising safety.
Rising Demand for Portable and Wearable Imaging Devices Is a Key Market Opportunity
There has been increasing demand for portable and wearable imaging technology, which is a big growth-driving market force because it makes diagnostic access convenient and efficient. Traditional neuroimaging machines like MRI and PET scanners are relatively costly, and in most cases, only well-equipped institutions have access to them.
With the advances of modern miniaturization technology, wireless communication, and artificial intelligence-aided imaging, creation of tiny mobile imaging systems can be brought about to be utilized in home care, in emergency rooms, or in rural clinics.
This transition is decreasing reliance on heavy hospital infrastructure, making it easier and less expensive to obtain brain images. Further, increased investment in telemedicine and precision medicine is fuelling the demand for wearable technology for ongoing brain activity monitoring, stroke detection early in its stages, and monitoring of mental status.
With the focus of healthcare systems on distant diagnostics and point-of-care medicine, the increase in demand for portable neuroimaging technologies is likely to result in significant market growth in the near future.
Trends
AI-Powered Image Analysis Enhancing Diagnostic Accuracy
The integration of AI-powered image analysis is one of the main drivers of this market to ensure better accuracy and efficiency in diagnosis. AI algorithms can catch nuances of anomalies in the brain more quickly than any other traditional method, thus speeding up the process of diagnosis to allow better and faster detection of brain-related diseases.
This will be of great use in cases such as that of Alzheimer’s, stroke, and certain tumors, where early detection is of utmost importance. Moreover, AI-powered automation will help fill the gap that a lack of skilled radiologists in the workforce has created. This, therefore, will work towards easing workflow pressures and melting away human error. With further advancement in AI technologies, the implantation of AI in the area of real-time brain imaging and predictive analytics is expected to add impetus to the market growth.
Growing Adoption of Hybrid Imaging Technologies
The market is also seeing one more important trend in the growth of hybrid imaging solutions, including systems such as PET-MRI and PET-CT. These use combinations of imaging technologies, giving them outstanding diagnostic capabilities among complex neurological cases.
States such as these allow better disease characterization that leads to improved patient outcomes and even enhanced uses in the research arena. Advances in imaging software and hardware technology keep supporting multi-modal imaging lately, which rapidly shapes into the becoming standard in diagnostics in neurology, adding fire to its demand.
Market Outlook
The USA neuroimaging and brain imaging market is increasing primarily due to the extremely high incidence of neurological disorders and strong emphasis on early intervention and diagnosis. MRI or positron emission tomography functions have been incorporated into the diagnostic process by clinicians, in order to possess high diagnostic accuracy and enhance prognostication. The large investments in R&D and a robust healthcare infrastructure base are factors that drive the growth of the market.
Market Growth Factors
Market Forecast
| Country | CAGR (2025 to 2035) |
|---|---|
| United States | 4.2% |
Market Outlook
Because of investments made to enhance health infrastructure in India, the brain imaging and neuroimaging market has been growing. The rising burden of neurological diseases is responsible for the ever-growing demand for holistic imaging solutions for their earlier detection and management. The government is increasing access and affordability of care, in fact, enabling further adoption of advanced imaging technology.
Market Growth Factors
Market Forecast
| Country | CAGR (2025 to 2035) |
|---|---|
| India | 6.1% |
Market Outlook
China's neuroimaging and brain imaging market is growing at a very high rate due to the changes in medical technology and investment in infrastructure. The increase in the burden of neurological disorders has boosted demand for sophisticated imaging solutions for better management of the diseases. Strengthened healthcare services by the government, along with a rising middle-class population that expects higher-quality medical services, are promoting growth.
Market Growth Factors
Market Forecast
| Country | CAGR (2025 to 2035) |
|---|---|
| China | 5.9% |
Market Outlook
The brain imaging and neuroimaging market of Germany has expanded, supported by the country's priority for health care innovations and steadfast high standards of medical care. The advanced imaging technologies are now progressively incorporated into the diagnostics of medical care by the healthcare institutions that contribute to increasing the growth rate in the CT, MRI, PET, and nuclear imaging modalities. Structure health systems, along with an increase in awareness of the neurological health of the society, will further support the growth of this market.
Market Growth Factors
Market Forecast
| Country | CAGR (2025 to 2035) |
|---|---|
| Germany | 3.8% |
Market Outlook
The Brazil market for brain-intensive imaging and neuroimaging is advancing with a strong focus on getting sophisticated technologically and precision diagnostics. Advanced imaging technologies are endorsed in the healthcare sector for early disease detection and effective management of neurological conditions. As this country has an older population, the ratio of people of 60 years and older is rising, which is increasing calls for complete neuroimaging services.
Market Growth Factors
Market Forecast
| Country | CAGR (2025 to 2035) |
|---|---|
| Brazil | 3.3% |
The brain imaging & neuroimaging market is highly competitive due to the rising incidence of neurological disorders, advances in imaging technologies, and the growing uptake of AI-fueled diagnostic tools.
Companies are investing in high-resolution MRI, PET, and CT imaging systems, along with other functional neuroimaging solutions so as to secure a great competitive edge in the market. Well-established medical imaging manufacturers, neuroscience research firms, and now emerging digital health companies shape the market, each contributing in their own regard to the evolving landscape of neuroimaging solutions.
the market is segmented into Magnetic Resonance Imaging (MRI), Computerized Tomography (CT), Positron Emission Tomography (PET), Electroencephalography (EEG), Magnetoencephalography (MEG), Single Photon Emission Computed Tomography (SPECT), and Functional Near-Infrared Spectroscopy (fNIRS).
the market is segmented into Stroke and Traumatic Brain Injury (TBI), Multiple Sclerosis, Brain Tumors, Epilepsy, Neurodegenerative Disease (Alzheimer's Disease and Parkinson's Disease), and Psychiatric Disorders.
the market is segmented into Hospitals, Diagnostic Imaging Centers, Specialty Clinics, Academic and Research Institutes, and Medical Imaging CRO.
the Brain Imaging and Neuroimaging Market is analyzed across North America, Latin America, Western Europe, Eastern Europe, East Asia, South Asia & Pacific, and the Middle East & Africa.
The overall market size for brain imaging and neuroimaging market was USD 15.1 billion in 2025.
The brain imaging and neuroimaging market is expected to reach USD 24.8 billion in 2035.
The increasing incidence of head trauma among athletes and military personnel is driving the demand for advanced neuroimaging solutions.
The top key players that drives the development of brain imaging and neuroimaging market are GE Healthcare, Siemens Healthineers, Philips Healthcare, Canon Medical Systems and Medtronic plc.
Magnetic resonance imaging (MRI) is expected to command significant share over the assessment period.


Full Research Suite comprises of:
Market outlook & trends analysis
Interviews & case studies
Strategic recommendations
Vendor profiles & capabilities analysis
5-year forecasts
8 regions and 60+ country-level data splits
Market segment data splits
12 months of continuous data updates
DELIVERED AS:
PDF EXCEL ONLINE
Brain Monitoring Market Size and Share Forecast Outlook 2025 to 2035
Brain Fitness Market Size and Share Forecast Outlook 2025 to 2035
Brain Computing Interfaces Market Size and Share Forecast Outlook 2025 to 2035
Brain Cancer Diagnostics Market Size and Share Forecast Outlook 2025 to 2035
Brain Metastasis Therapeutics Market Analysis - Size, Share, and Forecast Outlook 2025 to 2035
Brain-Computer Interface Implant Market Analysis Size and Share Forecast Outlook 2025 to 2035
Brain Implants Market Size and Share Forecast Outlook 2025 to 2035
Brain Health Supplement Market Analysis - Size, Share, and Forecast Outlook 2025 to 2035
Brain Tumor Treatment Market Analysis-- Size and Share Forecast Outlook 2025 to 2035
Brain Biomarker Market Trends and Forecast 2025 to 2035
Brain Tumor Drugs Market Forecast & Analysis: 2025 to 2035
Brain Mint Market Analysis by Functionality, Consumer Orientation, Sales Channel and Region Through 2035
Brain Monitoring Systems Market is segmented by Lateral Flow Readers and Kits and Reagents from 2025 to 2035
Brain Fingerprinting Technology Market
Deep Brain Stimulator Market Size and Share Forecast Outlook 2025 to 2035
Kids’ Brain Health Supplements Market Size and Share Forecast Outlook 2025 to 2035
Bovine Brain Extract Size and Share Forecast Outlook 2025 to 2035
Chronic Brain Damage Treatment: Trends, Growth, and Key Developments
Auditory Brainstem Response Analyzers Market Size and Share Forecast Outlook 2025 to 2035
Wireless Brain Sensors Market

Thank you!
You will receive an email from our Business Development Manager. Please be sure to check your SPAM/JUNK folder too.
Chat With
MaRIA