Brain Computing Interfaces Market Outlook (2023 to 2033)

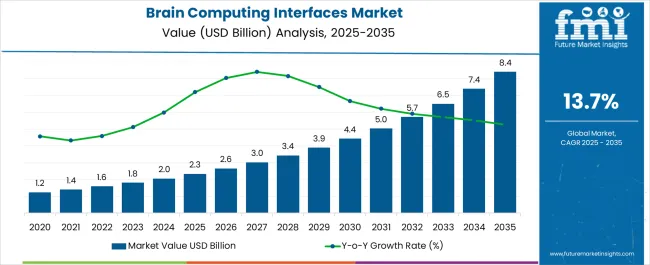
According to Future Market Insights, the global brain computing interfaces market is set to reach US$ 1.8 billion in 2023. With a growth rate of 13.6%, the brain computing interfaces market is projected to reach US$ 6.5 billion by 2033. A significant amount of research has been conducted on brain-computer interfaces (BCIs) in recent years. A brain-computer interface allows humans to interact with technology using their thoughts alone, establishing a direct link that connects the brain to an external device.

Using BCIs raises interesting ethical and policy issues, like cognitive liberty, identity preservation, and access. For the development, deployment, and use of BCIs, researchers, policymakers, and ethicists must discuss their ethical implications.

Among other applications, BCIs have the potential to improve worker safety, improve productivity, and improve human-robot collaboration. For example, BCIs can be used to operate machinery directly from the brain or to monitor cognitive workload as a means of preventing accidents and improving the quality of work performed by employees.

BCIs can provide immersive and interactive experiences that can transform gaming and entertainment. Virtual reality experiences, neurofeedback-equipped entertainment platforms, and brain-controlled games are likely to transform consumer engagement with digital media in the coming years.

Report Attributes Details
Brain Computing Interfaces Market Size (2023) US$ 1.8 billion
Brain Computing Interfaces Projected Market Value (2033) US$ 6.5 billion
North America Market Growth Rate (2023 to 2033) 22%
United Kingdom Growth Rate (2023 to 2033) 13.7% CAGR
Japan Market Growth Rate (2023 to 2033) 13.6% CAGR

Don't pay for what you don't need

Customize your report by selecting specific countries or regions and save 30%!

2018 to 2022 Brain Computing Interfaces Sales Analysis Compared to Demand Forecast from 2023 to 2033

FMI states that the global brain computing interfaces market is expected to grow at a CAGR of 15.6% from 2018 to 2022. BCIs are capable of combining with artificial intelligence (AI) and robotics in order to create powerful systems. For instance, brain activity decoding is done to improve precision when BCIs are used alongside AI algorithms, or advanced prosthetics that can be controlled by the brain. In both human-machine interactions and medical breakthroughs, collaborations like these can be beneficial.

Mental health conditions can be monitored and managed using BCIs. Neurofeedback can improve mental well-being and self-regulation skills by providing real-time information about brain activity. Post-traumatic stress disorder (PTSD) and anxiety are some of the conditions that BCIs may help with.

As BCIs will increasingly develop ethical concerns related to privacy, confidentiality, and informed consent as they become more advanced and widespread. In order for BCIs to be used responsibly, data protection and responsibility for their use will be key. To handle these challenges and protect user rights, guidelines and regulations should be established.

What are the Future Prospects for the Field of Brain Computing Interfaces?

Technological Innovations in BCI Devices to gain Traction in Coming Years

Research is continually being conducted to develop higher precision and spatial resolution methods for recording neural activity. In the near future, new technologies will allow doctors to interpret the activity of the brain more accurately, including optogenetics, electrocorticography (ECoG), and nanotechnology-based sensors.

A growing trend has been observed toward the development of miniaturized and wearable devices for body-computer interfaces. In addition to being mobility-, comfort-, and user-friendly, these compact systems are suitable for long-term use in everyday life. Consumer electronics, healthcare, and assistive technologies can all benefit from wearable BCIs.

The use of BCIs can enhance human capabilities in a number of different areas. For example, BCI is being explored for applications in neurorehabilitation to restore movement and control to people with motor impairments. Cognitive functions can also be enhanced by BCIs, such as improving memory and attention.

With BCIs, brain-to-cloud communication can be achieved directly through the internet. With this, human brains can exchange information with online platforms, databases, and artificial intelligence systems seamlessly. Educational institutions, entertainment, and data analysis could all benefit from this technology.

Sudip Saha
Sudip Saha

Principal Consultant

Talk to Analyst

Find your sweet spots for generating winning opportunities in this market.

Country-wise Insights

What is the Impact of Brain Computing Interfaces on the American Healthcare Industry?

The Use of Military Sectors to Increase Demand for Brain Computer Interfaces

Brain computing interfaces are expected to become widely used in the United States market. By 2033, the brain computing interfaces market is expected to reach a valuation of US$ 1.4 billion in the United States. US economic growth is projected to grow at a CAGR of 13.7% between 2023 and 2033.

The United States military has also explored BCIs for controlling drone swarms, monitoring a soldier's cognitive workload, and interconnecting weapons systems. The use of BCIs in healthcare extends to communicating with patients who are completely confined to prison. There are a number of BCI projects and startups underway in the United States that are exploring this technology's potential applications.

Several clinical trials are being conducted on brain devices in the United States which helps explain the region's dominance. Universities, hospitals, and research centers are increasingly adopting these devices and launching new initiatives such as the human brain project. With rising technologies in the country and dominance in healthcare, the brain computing interface demand is expected to grow.

What is the Sizing of China's Brain Computing Interfaces Market?

China Implements High Levels of Advanced BCI, Paving the Way for the Growth Business

According to FMI, brain computing interfaces sales in China are expected to reach US$ 1.7 billion by 2033. From 2023 to 2033, the Chinese market is predicted to grow by 13.5%. Modernization of healthcare will lead to better options for individuals and healthcare professionals.

The growing incidence of neurodegenerative conditions in these countries has contributed to the growth of the BCI market. The demand for BCIs in this region will be driven by unmet needs, a rise in healthcare expenditures, and increased awareness among patients.

Foreign investors have flocked to China due to low manufacturing costs and favorable taxation policies. Innovations had been developed through intensive research and development. Chinese researchers also developed a brain-machine interface in 2020 using memristor arrays that can analyze neural signals, which achieved 93% accuracy in filtering epilepsy-related neural signals.

Category-based Insights

Which Product Segment is leading the Brain Computing Interfaces Market?

Developing Invasive Products That Improve Performance to Encourage the Use of Brain Computing Interfaces

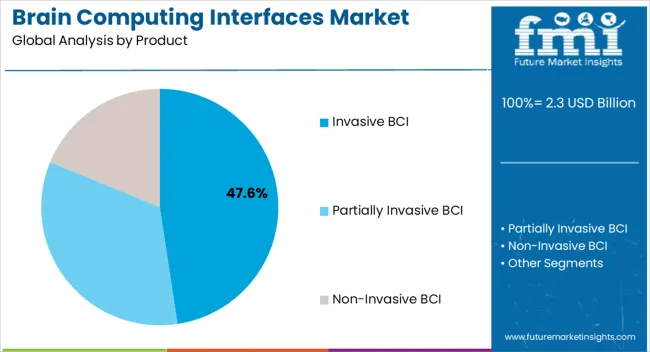
Invasive BCIs are expected to dominate the brain computing interfaces market. According to forecasts, this segment of the market is expected to grow by 13.4% over the next few years. According to the government, the economy is expected to grow at a CAGR of 15.5% between 2018 and 2022. A brain-controlled robotic leg & arm and a camera connected to the brain will be able to restore vision to paralyzed people over the forecast period, so the invasive segment is expected to grow the fastest over the forecast period.

A new development in invasive BCIs would be the development of minimally invasive techniques to decrease the invasiveness of the procedure, thereby increasing market demand. While BCIs may offer potential benefits, they are also ethically problematic, including the risk of adverse effects on the brain and the need for informed consent. The development and use of brain-computer interfaces are expected to be fueled by future demand and growth, but they need to be evaluated for ethical and safety concerns.

Due to its ease of adaptation and various technological advancements, partially invasive BCI will also see significant growth during the forecast period. For instance, Synchron Inc. launched Stentrode in September 2019, a wireless neural interface that records brain activity partially invasively.

What Application is Driving Demand for Brain Computing Interfaces?

Healthcare Application is expected to Increase Demand for Brain Computing Interfaces

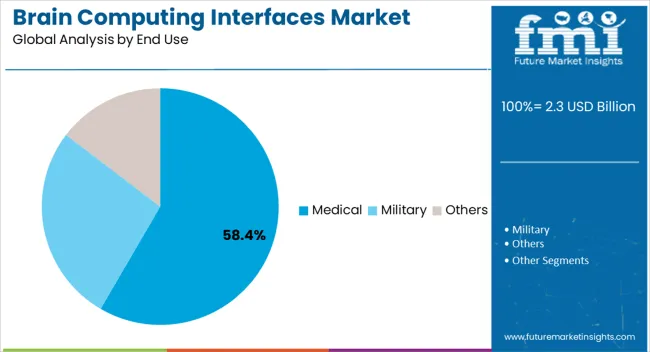
FMI predicts that the healthcare segment will grow at a CAGR of 13.1% by 2033. Cognitive or physical impairments are being treated with brain computer interface (BCI) technology. It promises to significantly improve the autonomy and mobility of these patients, which will greatly enhance their quality of life.

In addition to being an assistive, adaptive, and rehabilitation technology, BCI can be used to identify signals indicating the elderly's intent, which can then be incorporated into commands that can control almost any device. Growing demand for training motor/cognitive abilities is expected to help prevent the effects of aging in the future. As home nursing becomes more prevalent, BCI devices are expected to become more widely used for interacting with others as well as controlling home appliances.

An exoskeleton is a device that controls the joints of the body in order to increase their strength. Besides enhancing the study of neuroscience, BCIs are used to convert the signals from the brain into commands that are then displayed on a device such as a keyboard and a light controller for specific tasks such as reading or typing.

Advanced healthcare systems have been developed using BCI technology integrated with the Internet of Things (IoT). Neuronal interfaces that enable people with disabilities to communicate are being developed by startups such as CereGate. BCIs can be used in healthcare systems to benefit patients and researchers alike, offering numerous opportunities and benefits.

Get the data you need at a Fraction of the cost

Personalize your report by choosing insights you need
and save 40%!

Start-ups in the Brain Computing Interfaces Market

Technological advancements and changing market conditions constantly shape business trends. A growing startup ecosystem is resulting from the growing popularity of brain computing interfaces around the world. Some of the most important brain computing interfaces startups are listed below:
  • Neurolink is a company that provides implants that interface the brain with computers. Humans interact with computers through its surgically implanted neural interfaces.
  • Ceribell specializes in providing pocket-sized EEG devices for point-of-care diagnostics. Devices developed by this company can be used at the point of care for diagnostics. Ceribell offers a battery-operated real-time EEG recorder and headband with 10 channels, as well as a pocket-sized battery-operated EEG headband. In addition to recording data, displaying the EEG signal, analyzing brain activity, and providing alerts on the EEG, the headbands have features to assist in monitoring the EEG.
  • Brain Scope, a provider of non-invasive point-of-care traumatic brain injury diagnosis, develops non-invasive EEG recording devices. Medical professionals can objectively assess brain function by using a handheld, non-invasive instrument developed by the company at the point of care. Developed by BrainScope, the devices are built upon a proprietary technology platform that includes a database of recorded brainwaves, a digital signal processor, linear and non-linear algorithms, compact hardware, and disposable sensors for the headsets. The company's products have been cleared by the FDA under section 510(k).

How Can the Brain Computing Interfaces Industry Remain Competitive?

Many key players are active in the brain computing interfaces industry. Competitors compare the quality of their products, their innovation, their pricing, their distribution network, and their aftersales service. The Internet of Things (IoT) is one of the key technologies being invested in by key players to improve valve operations and decision-making. New technologies such as IoT and brain implants are being introduced by key companies. As a result, it enhances the efficiency of the valve, which in turn enhances the efficiency of the interfaces.

A number of approaches are being used by manufacturers to expand their business with aircraft OEMs, including alliances, mergers, and acquisitions. Various strategies are being adopted by key players to maintain their dominance in the market. Product launches, partnerships, and collaborations are examples of mergers and acquisitions.

A strict regulatory environment presents several challenges to the brain computing interfaces industry. Moreover, the industry must continue to advance its technology in order to keep up with its evolving needs. New entrants can invest in brain computing interfaces despite the challenges. A focus on developing distribution networks, researching and developing improved and cost-effective computing interfaces, and focusing on expanding markets.

  • In June 2023, CraniUS LLC, a company dedicated to improving brain health through the development of new diagnostics and treatments, announces the results of their preclinical study examining their patented NeuroPASS device, which demonstrated successful convection-enhanced delivery.
  • In June 2023, Wearable Devices Ltd., an innovative technology company focused on the development of wearable technology powered by artificial intelligence that provides touchless sensing to users, is delighted to announce the release of the Mudra Band application, which can now be found on the Apple App Store. Additionally, Mudra Band users now have access to an exclusive Apple Watch Face.

Brain Computing Interfaces Industry Report Scope

Attribute Details
Forecast Period 2023 to 2033
Historical Data Available for 2018 to 2022
Market Analysis US$ billion for Value
Key Countries Covered
  • United States
  • Canada
  • Brazil
  • Mexico
  • Germany
  • United Kingdom
  • France
  • Spain
  • Italy
  • India
  • Malaysia
  • Singapore
  • Thailand
  • China
  • Japan
  • South Korea
  • Australia
  • New Zealand
  • GCC Countries
  • South Africa
  • Israel
Key Market Segments Covered
  • Product
  • Application
  • End-use
  • Region
Key Companies Profiled
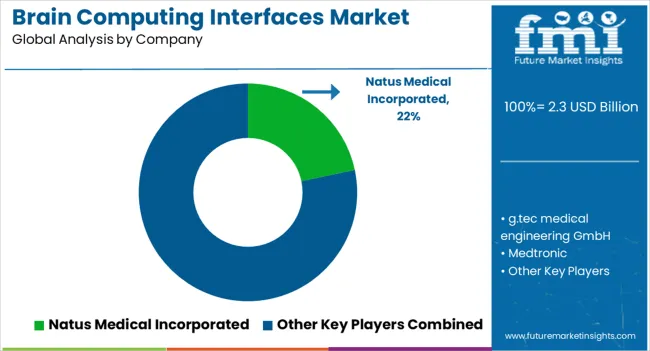
  • Natus Medical Incorporated
  • g.tec medical engineering GmbH
  • Medtronic
  • Compumedics Neuroscan
  • Brain Products GmbH
  • Integra Lifesciences Corporation
  • Advanced Brain Monitoring, Inc.
  • EMOTIV
  • NeuroSky
  • Interaxon, Inc.
  • ANT Neuro
  • Neuroelectrics
  • Ripple Neuro
  • NIRx Medical Technologies, LLC
  • OpenBCI
  • CGX, A Cognionics Company
Customization & Pricing Available upon Request

Brain Computing Interfaces Market Outlook by Category

Product:

  • Invasive BCI
  • Partially Invasive BCI
  • Non-invasive BCI

Application:

  • Healthcare
    • Disabilities Restoration
    • Brain Function Repair
  • Smart Home Control
  • Communication & Control
  • Entertainment & Gaming

End Use:

  • Medical
  • Military
  • Others

Region:

  • North America
  • Latin America
  • Europe
  • South Asia
  • East Asia
  • Oceania
  • Middle East and Africa

Frequently Asked Questions

How Big is the Brain Computing Interfaces Market?

The market is valued at US$ 1.8 billion in 2023.

Who are the Leading Players in the Brain Computing Interfaces Market?

Ripple Neuro and Medtronic are the leading market players.

Which is the Key Segment by Application?

The healthcare sector is likely to remain preferred through 2033.

What is the Go-to-Market Strategy?

Players opt for mergers, collaborations, and acquisitions.

Which are the Key Countries in the Brain Computing Interfaces Market?

The United States and China dominate the global market.

Table of Content

1. Executive Summary

    1.1. Global Market Outlook

    1.2. Demand-side Trends

    1.3. Supply-side Trends

    1.4. Technology Roadmap Analysis

    1.5. Analysis and Recommendations

2. Market Overview

    2.1. Market Coverage / Taxonomy

    2.2. Market Definition / Scope / Limitations

3. Market Background

    3.1. Market Dynamics

        3.1.1. Drivers

        3.1.2. Restraints

        3.1.3. Opportunity

        3.1.4. Trends

    3.2. Scenario Forecast

        3.2.1. Demand in Optimistic Scenario

        3.2.2. Demand in Likely Scenario

        3.2.3. Demand in Conservative Scenario

    3.3. Opportunity Map Analysis

    3.4. Investment Feasibility Matrix

    3.5. PESTLE and Porter’s Analysis

    3.6. Regulatory Landscape

        3.6.1. By Key Regions

        3.6.2. By Key Countries

    3.7. Regional Parent Market Outlook

4. Global Market Analysis 2018 to 2022 and Forecast, 2023 to 2033

    4.1. Historical Market Size Value (US$ Million) Analysis, 2018 to 2022

    4.2. Current and Future Market Size Value (US$ Million) Projections, 2023 to 2033

        4.2.1. Y-o-Y Growth Trend Analysis

        4.2.2. Absolute $ Opportunity Analysis

5. Global Market Analysis 2018 to 2022 and Forecast 2023 to 2033, By Product

    5.1. Introduction / Key Findings

    5.2. Historical Market Size Value (US$ Million) Analysis By Product, 2018 to 2022

    5.3. Current and Future Market Size Value (US$ Million) Analysis and Forecast By Product, 2023 to 2033

        5.3.1. Invasive BCI

        5.3.2. Partially Invasive BCI

        5.3.3. Non-invasive BCI

    5.4. Y-o-Y Growth Trend Analysis By Product, 2018 to 2022

    5.5. Absolute $ Opportunity Analysis By Product, 2023 to 2033

6. Global Market Analysis 2018 to 2022 and Forecast 2023 to 2033, By Application

    6.1. Introduction / Key Findings

    6.2. Historical Market Size Value (US$ Million) Analysis By Application, 2018 to 2022

    6.3. Current and Future Market Size Value (US$ Million) Analysis and Forecast By Application, 2023 to 2033

        6.3.1. Healthcare

        6.3.2. Disabilities Restoration

        6.3.3. Brain Function Repair

        6.3.4. Smart Home Control

        6.3.5. Communication & Control

        6.3.6. Entertainment & Gaming

    6.4. Y-o-Y Growth Trend Analysis By Application, 2018 to 2022

    6.5. Absolute $ Opportunity Analysis By Application, 2023 to 2033

7. Global Market Analysis 2018 to 2022 and Forecast 2023 to 2033, By End-use

    7.1. Introduction / Key Findings

    7.2. Historical Market Size Value (US$ Million) Analysis By End-use, 2018 to 2022

    7.3. Current and Future Market Size Value (US$ Million) Analysis and Forecast By End-use, 2023 to 2033

        7.3.1. Medical

        7.3.2. Military

        7.3.3. Others

    7.4. Y-o-Y Growth Trend Analysis By End-use, 2018 to 2022

    7.5. Absolute $ Opportunity Analysis By End-use, 2023 to 2033

8. Global Market Analysis 2018 to 2022 and Forecast 2023 to 2033, By Region

    8.1. Introduction

    8.2. Historical Market Size Value (US$ Million) Analysis By Region, 2018 to 2022

    8.3. Current Market Size Value (US$ Million) Analysis and Forecast By Region, 2023 to 2033

        8.3.1. North America

        8.3.2. Latin America

        8.3.3. Europe

        8.3.4. South Asia

        8.3.5. East Asia

        8.3.6. Oceania

        8.3.7. MEA

    8.4. Market Attractiveness Analysis By Region

9. North America Market Analysis 2018 to 2022 and Forecast 2023 to 2033, By Country

    9.1. Historical Market Size Value (US$ Million) Trend Analysis By Market Taxonomy, 2018 to 2022

    9.2. Market Size Value (US$ Million) Forecast By Market Taxonomy, 2023 to 2033

        9.2.1. By Country

            9.2.1.1. USA

            9.2.1.2. Canada

        9.2.2. By Product

        9.2.3. By Application

        9.2.4. By End-use

    9.3. Market Attractiveness Analysis

        9.3.1. By Country

        9.3.2. By Product

        9.3.3. By Application

        9.3.4. By End-use

    9.4. Key Takeaways

10. Latin America Market Analysis 2018 to 2022 and Forecast 2023 to 2033, By Country

    10.1. Historical Market Size Value (US$ Million) Trend Analysis By Market Taxonomy, 2018 to 2022

    10.2. Market Size Value (US$ Million) Forecast By Market Taxonomy, 2023 to 2033

        10.2.1. By Country

            10.2.1.1. Brazil

            10.2.1.2. Mexico

            10.2.1.3. Rest of Latin America

        10.2.2. By Product

        10.2.3. By Application

        10.2.4. By End-use

    10.3. Market Attractiveness Analysis

        10.3.1. By Country

        10.3.2. By Product

        10.3.3. By Application

        10.3.4. By End-use

    10.4. Key Takeaways

11. Europe Market Analysis 2018 to 2022 and Forecast 2023 to 2033, By Country

    11.1. Historical Market Size Value (US$ Million) Trend Analysis By Market Taxonomy, 2018 to 2022

    11.2. Market Size Value (US$ Million) Forecast By Market Taxonomy, 2023 to 2033

        11.2.1. By Country

            11.2.1.1. Germany

            11.2.1.2. UK

            11.2.1.3. France

            11.2.1.4. Spain

            11.2.1.5. Italy

            11.2.1.6. Rest of Europe

        11.2.2. By Product

        11.2.3. By Application

        11.2.4. By End-use

    11.3. Market Attractiveness Analysis

        11.3.1. By Country

        11.3.2. By Product

        11.3.3. By Application

        11.3.4. By End-use

    11.4. Key Takeaways

12. South Asia Market Analysis 2018 to 2022 and Forecast 2023 to 2033, By Country

    12.1. Historical Market Size Value (US$ Million) Trend Analysis By Market Taxonomy, 2018 to 2022

    12.2. Market Size Value (US$ Million) Forecast By Market Taxonomy, 2023 to 2033

        12.2.1. By Country

            12.2.1.1. India

            12.2.1.2. Malaysia

            12.2.1.3. Singapore

            12.2.1.4. Thailand

            12.2.1.5. Rest of South Asia

        12.2.2. By Product

        12.2.3. By Application

        12.2.4. By End-use

    12.3. Market Attractiveness Analysis

        12.3.1. By Country

        12.3.2. By Product

        12.3.3. By Application

        12.3.4. By End-use

    12.4. Key Takeaways

13. East Asia Market Analysis 2018 to 2022 and Forecast 2023 to 2033, By Country

    13.1. Historical Market Size Value (US$ Million) Trend Analysis By Market Taxonomy, 2018 to 2022

    13.2. Market Size Value (US$ Million) Forecast By Market Taxonomy, 2023 to 2033

        13.2.1. By Country

            13.2.1.1. China

            13.2.1.2. Japan

            13.2.1.3. South Korea

        13.2.2. By Product

        13.2.3. By Application

        13.2.4. By End-use

    13.3. Market Attractiveness Analysis

        13.3.1. By Country

        13.3.2. By Product

        13.3.3. By Application

        13.3.4. By End-use

    13.4. Key Takeaways

14. Oceania Market Analysis 2018 to 2022 and Forecast 2023 to 2033, By Country

    14.1. Historical Market Size Value (US$ Million) Trend Analysis By Market Taxonomy, 2018 to 2022

    14.2. Market Size Value (US$ Million) Forecast By Market Taxonomy, 2023 to 2033

        14.2.1. By Country

            14.2.1.1. Australia

            14.2.1.2. New Zealand

        14.2.2. By Product

        14.2.3. By Application

        14.2.4. By End-use

    14.3. Market Attractiveness Analysis

        14.3.1. By Country

        14.3.2. By Product

        14.3.3. By Application

        14.3.4. By End-use

    14.4. Key Takeaways

15. MEA Market Analysis 2018 to 2022 and Forecast 2023 to 2033, By Country

    15.1. Historical Market Size Value (US$ Million) Trend Analysis By Market Taxonomy, 2018 to 2022

    15.2. Market Size Value (US$ Million) Forecast By Market Taxonomy, 2023 to 2033

        15.2.1. By Country

            15.2.1.1. GCC Countries

            15.2.1.2. South Africa

            15.2.1.3. Israel

            15.2.1.4. Rest of MEA

        15.2.2. By Product

        15.2.3. By Application

        15.2.4. By End-use

    15.3. Market Attractiveness Analysis

        15.3.1. By Country

        15.3.2. By Product

        15.3.3. By Application

        15.3.4. By End-use

    15.4. Key Takeaways

16. Key Countries Market Analysis

    16.1. USA

        16.1.1. Pricing Analysis

        16.1.2. Market Share Analysis, 2022

            16.1.2.1. By Product

            16.1.2.2. By Application

            16.1.2.3. By End-use

    16.2. Canada

        16.2.1. Pricing Analysis

        16.2.2. Market Share Analysis, 2022

            16.2.2.1. By Product

            16.2.2.2. By Application

            16.2.2.3. By End-use

    16.3. Brazil

        16.3.1. Pricing Analysis

        16.3.2. Market Share Analysis, 2022

            16.3.2.1. By Product

            16.3.2.2. By Application

            16.3.2.3. By End-use

    16.4. Mexico

        16.4.1. Pricing Analysis

        16.4.2. Market Share Analysis, 2022

            16.4.2.1. By Product

            16.4.2.2. By Application

            16.4.2.3. By End-use

    16.5. Germany

        16.5.1. Pricing Analysis

        16.5.2. Market Share Analysis, 2022

            16.5.2.1. By Product

            16.5.2.2. By Application

            16.5.2.3. By End-use

    16.6. UK

        16.6.1. Pricing Analysis

        16.6.2. Market Share Analysis, 2022

            16.6.2.1. By Product

            16.6.2.2. By Application

            16.6.2.3. By End-use

    16.7. France

        16.7.1. Pricing Analysis

        16.7.2. Market Share Analysis, 2022

            16.7.2.1. By Product

            16.7.2.2. By Application

            16.7.2.3. By End-use

    16.8. Spain

        16.8.1. Pricing Analysis

        16.8.2. Market Share Analysis, 2022

            16.8.2.1. By Product

            16.8.2.2. By Application

            16.8.2.3. By End-use

    16.9. Italy

        16.9.1. Pricing Analysis

        16.9.2. Market Share Analysis, 2022

            16.9.2.1. By Product

            16.9.2.2. By Application

            16.9.2.3. By End-use

    16.10. India

        16.10.1. Pricing Analysis

        16.10.2. Market Share Analysis, 2022

            16.10.2.1. By Product

            16.10.2.2. By Application

            16.10.2.3. By End-use

    16.11. Malaysia

        16.11.1. Pricing Analysis

        16.11.2. Market Share Analysis, 2022

            16.11.2.1. By Product

            16.11.2.2. By Application

            16.11.2.3. By End-use

    16.12. Singapore

        16.12.1. Pricing Analysis

        16.12.2. Market Share Analysis, 2022

            16.12.2.1. By Product

            16.12.2.2. By Application

            16.12.2.3. By End-use

    16.13. Thailand

        16.13.1. Pricing Analysis

        16.13.2. Market Share Analysis, 2022

            16.13.2.1. By Product

            16.13.2.2. By Application

            16.13.2.3. By End-use

    16.14. China

        16.14.1. Pricing Analysis

        16.14.2. Market Share Analysis, 2022

            16.14.2.1. By Product

            16.14.2.2. By Application

            16.14.2.3. By End-use

    16.15. Japan

        16.15.1. Pricing Analysis

        16.15.2. Market Share Analysis, 2022

            16.15.2.1. By Product

            16.15.2.2. By Application

            16.15.2.3. By End-use

    16.16. South Korea

        16.16.1. Pricing Analysis

        16.16.2. Market Share Analysis, 2022

            16.16.2.1. By Product

            16.16.2.2. By Application

            16.16.2.3. By End-use

    16.17. Australia

        16.17.1. Pricing Analysis

        16.17.2. Market Share Analysis, 2022

            16.17.2.1. By Product

            16.17.2.2. By Application

            16.17.2.3. By End-use

    16.18. New Zealand

        16.18.1. Pricing Analysis

        16.18.2. Market Share Analysis, 2022

            16.18.2.1. By Product

            16.18.2.2. By Application

            16.18.2.3. By End-use

    16.19. GCC Countries

        16.19.1. Pricing Analysis

        16.19.2. Market Share Analysis, 2022

            16.19.2.1. By Product

            16.19.2.2. By Application

            16.19.2.3. By End-use

    16.20. South Africa

        16.20.1. Pricing Analysis

        16.20.2. Market Share Analysis, 2022

            16.20.2.1. By Product

            16.20.2.2. By Application

            16.20.2.3. By End-use

    16.21. Israel

        16.21.1. Pricing Analysis

        16.21.2. Market Share Analysis, 2022

            16.21.2.1. By Product

            16.21.2.2. By Application

            16.21.2.3. By End-use

17. Market Structure Analysis

    17.1. Competition Dashboard

    17.2. Competition Benchmarking

    17.3. Market Share Analysis of Top Players

        17.3.1. By Regional

        17.3.2. By Product

        17.3.3. By Application

        17.3.4. By End-use

18. Competition Analysis

    18.1. Competition Deep Dive

        18.1.1. Natus Medical Incorporated

            18.1.1.1. Overview

            18.1.1.2. Product Portfolio

            18.1.1.3. Profitability by Market Segments

            18.1.1.4. Sales Footprint

            18.1.1.5. Strategy Overview

                18.1.1.5.1. Marketing Strategy

        18.1.2. g.tec medical engineering GmbH

            18.1.2.1. Overview

            18.1.2.2. Product Portfolio

            18.1.2.3. Profitability by Market Segments

            18.1.2.4. Sales Footprint

            18.1.2.5. Strategy Overview

                18.1.2.5.1. Marketing Strategy

        18.1.3. Medtronic

            18.1.3.1. Overview

            18.1.3.2. Product Portfolio

            18.1.3.3. Profitability by Market Segments

            18.1.3.4. Sales Footprint

            18.1.3.5. Strategy Overview

                18.1.3.5.1. Marketing Strategy

        18.1.4. Compumedics Neuroscan

            18.1.4.1. Overview

            18.1.4.2. Product Portfolio

            18.1.4.3. Profitability by Market Segments

            18.1.4.4. Sales Footprint

            18.1.4.5. Strategy Overview

                18.1.4.5.1. Marketing Strategy

        18.1.5. Brain Products GmbH

            18.1.5.1. Overview

            18.1.5.2. Product Portfolio

            18.1.5.3. Profitability by Market Segments

            18.1.5.4. Sales Footprint

            18.1.5.5. Strategy Overview

                18.1.5.5.1. Marketing Strategy

        18.1.6. Integra Lifesciences Corporation

            18.1.6.1. Overview

            18.1.6.2. Product Portfolio

            18.1.6.3. Profitability by Market Segments

            18.1.6.4. Sales Footprint

            18.1.6.5. Strategy Overview

                18.1.6.5.1. Marketing Strategy

        18.1.7. Advanced Brain Monitoring, Inc.

            18.1.7.1. Overview

            18.1.7.2. Product Portfolio

            18.1.7.3. Profitability by Market Segments

            18.1.7.4. Sales Footprint

            18.1.7.5. Strategy Overview

                18.1.7.5.1. Marketing Strategy

        18.1.8. EMOTIV

            18.1.8.1. Overview

            18.1.8.2. Product Portfolio

            18.1.8.3. Profitability by Market Segments

            18.1.8.4. Sales Footprint

            18.1.8.5. Strategy Overview

                18.1.8.5.1. Marketing Strategy

        18.1.9. NeuroSky

            18.1.9.1. Overview

            18.1.9.2. Product Portfolio

            18.1.9.3. Profitability by Market Segments

            18.1.9.4. Sales Footprint

            18.1.9.5. Strategy Overview

                18.1.9.5.1. Marketing Strategy

        18.1.10. Interaxon, Inc.

            18.1.10.1. Overview

            18.1.10.2. Product Portfolio

            18.1.10.3. Profitability by Market Segments

            18.1.10.4. Sales Footprint

            18.1.10.5. Strategy Overview

                18.1.10.5.1. Marketing Strategy

        18.1.11. ANT Neuro

            18.1.11.1. Overview

            18.1.11.2. Product Portfolio

            18.1.11.3. Profitability by Market Segments

            18.1.11.4. Sales Footprint

            18.1.11.5. Strategy Overview

                18.1.11.5.1. Marketing Strategy

        18.1.12. Neuroelectrics

            18.1.12.1. Overview

            18.1.12.2. Product Portfolio

            18.1.12.3. Profitability by Market Segments

            18.1.12.4. Sales Footprint

            18.1.12.5. Strategy Overview

                18.1.12.5.1. Marketing Strategy

        18.1.13. Ripple Neuro

            18.1.13.1. Overview

            18.1.13.2. Product Portfolio

            18.1.13.3. Profitability by Market Segments

            18.1.13.4. Sales Footprint

            18.1.13.5. Strategy Overview

                18.1.13.5.1. Marketing Strategy

        18.1.14. NIRx Medical Technologies, LLC

            18.1.14.1. Overview

            18.1.14.2. Product Portfolio

            18.1.14.3. Profitability by Market Segments

            18.1.14.4. Sales Footprint

            18.1.14.5. Strategy Overview

                18.1.14.5.1. Marketing Strategy

        18.1.15. OpenBCI

            18.1.15.1. Overview

            18.1.15.2. Product Portfolio

            18.1.15.3. Profitability by Market Segments

            18.1.15.4. Sales Footprint

            18.1.15.5. Strategy Overview

                18.1.15.5.1. Marketing Strategy

        18.1.16. CGX, A Cognionics Company

            18.1.16.1. Overview

            18.1.16.2. Product Portfolio

            18.1.16.3. Profitability by Market Segments

            18.1.16.4. Sales Footprint

            18.1.16.5. Strategy Overview

                18.1.16.5.1. Marketing Strategy

19. Assumptions & Acronyms Used

20. Research Methodology

Recommendations

Technology

Mobile Computing Devices Market

August 2023

REP-GB-4311

342 pages

Technology

Wearable Computing Devices Market

July 2023

REP-GB-252

333 pages

Technology

Wearable Computing Market

July 2022

REP-GB-4513

333 pages

Explore Technology Insights

View Reports
Future Market Insights

Brain Computing Interfaces Market

Schedule a Call