Body Composition Monitor and Scale Market Size and Share Forecast Outlook 2025 to 2035

The Body Composition Monitor and Scale Market is estimated to be valued at USD 0.7 billion in 2025 and is projected to reach USD 1.4 billion by 2035, registering a compound annual growth rate (CAGR) of 7.1% over the forecast period.
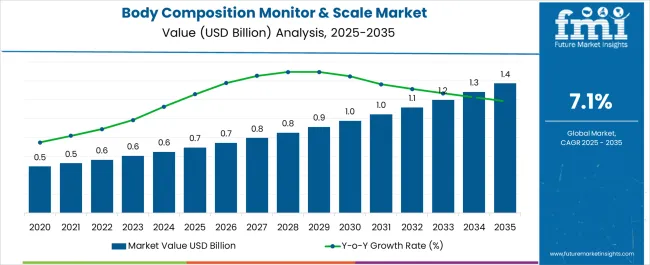
Quick Stats for Body Composition Monitor and Scale Market

  • Body Composition Monitor and Scale Market Industry Value (2025): USD 0.7 billion
  • Body Composition Monitor and Scale Market Forecast Value (2035): USD 1.4 billion
  • Body Composition Monitor and Scale Market Forecast CAGR: 7.1%
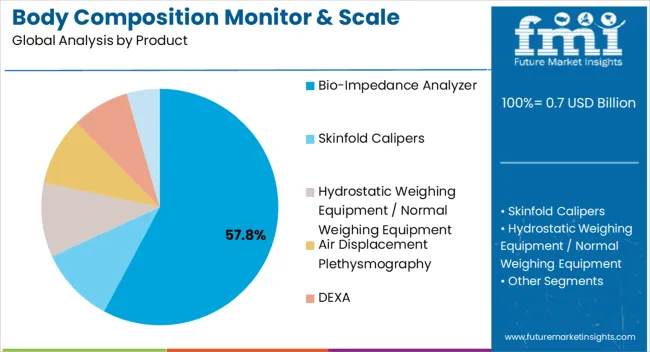
  • Leading Segment in Body Composition Monitor and Scale Market in 2025: Bio-Impedance Analyzer (57.8%)
  • Key Growth Region in Body Composition Monitor and Scale Market: North America, Asia-Pacific, Europe
  • Top Key Players in Body Composition Monitor and Scale Market: InBody Co., Ltd, Hologic, Inc., Omron Corporation, Tanita Corporation, Bodystat, Cosmed S.R.L, Maltron International Ltd, Seca GmbH & Co. Kg., SELVAS AI Inc. (Jawon Medical Co., Ltd.), RJL Systems, Inc., Beijing Sincoheren, Kern & Sohn, Laica International Corporation, Medisante Group AG, Guangzhou Beautylife Electronic Technology, Charder Electronics CO. Ltd

Body Composition Monitor & Scale Market Market Value Analysis

Metric Value
Body Composition Monitor and Scale Market Estimated Value in (2025 E) USD 0.7 billion
Body Composition Monitor and Scale Market Forecast Value in (2035 F) USD 1.4 billion
Forecast CAGR (2025 to 2035) 7.1%

Rationale for Segmental Growth in the Body Composition Monitor and Scale Market

The body composition monitor and scale market is advancing steadily as health awareness, preventive care, and fitness adoption continue to expand across global populations. Growth is being driven by rising prevalence of obesity and lifestyle-related disorders, which has increased the demand for accurate body analysis tools in both professional and personal settings.

Technological improvements in sensors, connectivity, and data integration are enhancing accuracy, reliability, and user experience, making these devices more attractive to a broader customer base. The integration of digital health platforms and mobile applications is further supporting adoption by enabling real-time monitoring and personalized health management.

While premium pricing and limited awareness in developing economies present challenges, market penetration is expected to rise with expanding fitness infrastructure, healthcare investments, and consumer willingness to adopt smart health devices Over the forecast horizon, continuous innovation, growing focus on performance optimization, and the role of body composition monitoring in preventive healthcare strategies will ensure steady revenue growth and broader market acceptance.
Segmental Analysis

Insights into the Product Segment

Body Composition Monitor & Scale Market Analysis By Product

The bio-impedance analyzer segment, accounting for 57.80% of the product category, has remained dominant due to its precision, convenience, and wide applicability across healthcare, fitness, and home-use environments. Its adoption has been driven by advanced electrical impedance technology, which provides reliable measurements of fat, muscle, and water composition.

Enhanced portability, user-friendly interfaces, and integration with mobile health platforms have reinforced consumer and professional preference for this product type. The segment has further benefited from consistent innovation in electrode design and measurement algorithms, improving diagnostic accuracy and reducing variability across diverse user groups.

Commercial fitness facilities, hospitals, and wellness programs have adopted bio-impedance analyzers as a standard, ensuring stable demand Future growth is expected to be supported by rising adoption in home healthcare, increased affordability, and integration with telehealth services, which will continue to strengthen the segment’s market leadership.
Insights into the End-User Segment

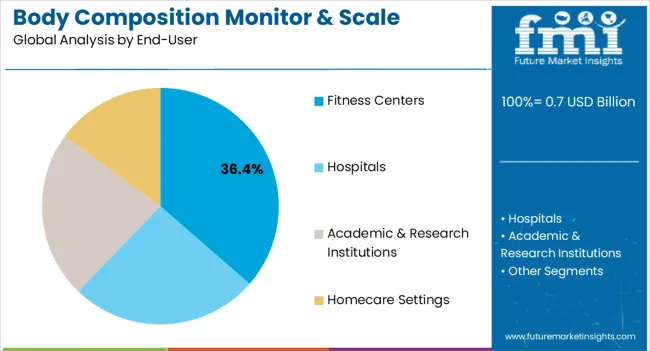
Body Composition Monitor & Scale Market Analysis By End User

The fitness centers segment, representing 36.40% of the end-user category, has secured a leading position as demand for structured fitness programs and health monitoring services continues to rise. Widespread adoption has been facilitated by the integration of body composition tracking into member assessment routines, enabling gyms and fitness clubs to enhance personalized training programs and client engagement.

This segment has further benefited from growing consumer interest in performance tracking, weight management, and preventive health solutions, particularly among urban populations. Consistent investments in digital infrastructure and connected equipment have supported the effective use of advanced body composition monitors in fitness environments.

The increasing role of data-driven health monitoring in promoting customer loyalty and service differentiation has reinforced the segment’s market share Continued expansion of fitness facilities, coupled with rising memberships in both developed and emerging markets, is expected to support ongoing growth and strengthen the dominance of fitness centers within the overall market landscape.

Top Body Composition Monitor and Scale Market Dynamics and Industry Trends

Body composition analysis is becoming an ideal method for calculating body fat, muscle, and bone mass. For this purpose, devices such as body composition monitors and scales are used. The growing adoption of these devices globally is expected to boost the market.

Analyzing body composition is essential to determining the risks associated with high or low body fat levels. Body composition analyzers offer thorough information for individualized health and fitness consultations. They are set to help calculate the makeup of several body components.

Body mass index (BMI), metabolic rate, and weight percentages from muscle, bone, fat, and water are accurately determined with body composition analyzers. The rising prevalence of diseases such as obesity and overweight is expected to drive demand for fat measurement devices, including body composition monitors and scales.

Other factors influencing market growth include:

  • Increasing demand needs advanced body health monitoring tools
  • Growing fitness and wellness trends globally
  • Development of smart body weight measurement devices
  • Growing demand for digital body composition sales

Sales Trend Analysis from 2020 to 2025 Compared to Market Outlook for 2025 to 2035

Sales of body composition monitors and scales grew at a CAGR of 6.2% between 2020 and 2025. The body composition monitor and scales market contributed a 14.6% share of the orthotics market, which was valued at USD 0.7 billion in 2025. Over the forecast period, the global market for body composition monitors and scales is poised to exhibit a CAGR of 7.4%.

Historical CAGR (2020 to 2025) 6.2%
Forecast CAGR (2025 to 2035) 7.4%

Several factors are expected to stimulate the growth of the body composition monitor and scale market. These include an increasing number of obese patients, a rising prevalence of metabolic disorders, and a growing interest in health and fitness.

Obesity is becoming a common metabolic disorder linked to a variety of chronic diseases. Obese individuals are more vulnerable to illnesses, such as cardiovascular issues, gallbladder disease, type 2 diabetes, kidney disease, and certain types of cancer.

According to the World Health Organization (WHO), about 0.6 billion adults 18 and older were overweight in 2024. The rising incidence of these health conditions is expected to drive demand for body composition monitor devices, including fat percentage analyzers.

Fitness enthusiasts and healthcare professionals are placing greater emphasis on using tools such as body composition monitors and scales to counter obesity. This is because these devices can assist in weight management and overall health improvement.

The growing prevalence of musculoskeletal disorders such as arthritis and osteoporosis is also driving the market for body composition equipment. This is because several body composition monitoring products are used globally for monitoring bone density.

For instance, DEXA is used for testing bone density to diagnose osteoporosis and determine the likelihood of developing fractures. As a result, it is anticipated that more hospitals will use DEXA as the incidence of osteoporosis rises.

Lucrative Opportunities Driving Demand Growth in the Body Composition Monitor and Scale Market

A positive growth trajectory has been predicted for the global body composition monitor and scale market. This is attributable to the technological advancements in body composition monitors and scales, the growing incidence of chronic diseases, and rising health awareness.

Key companies are incorporating more features in their devices as a result of technical improvements and inventions. Most body composition gadgets today have Bluetooth or Wi-Fi connectivity, allowing users to upload output data to the cloud or to their smartphones.

Growing awareness among people and an increasing number of fitness clubs are anticipated to foster the growth of the body composition monitor & scale market. Similarly, increasing government initiatives will likely play a key role in driving demand for body composition monitors and scales.

Governments are launching several initiatives to give citizens easy access to advanced healthcare. For instance, the National Health Mission (NHM) supports state governments' initiatives to provide equitable, easily accessible, and reasonably priced healthcare services to all citizens on a technical as well as financial level.

Factors Restraining the Demand for Body Composition Monitor and Scale

Body composition monitors and scales play an important role in terms of measurement of body composition. However, the high cost is becoming an obstacle to the growth of body composition monitor & scale market.

Body composition analyzers cost more because of their sophisticated features and functionality. In addition, due to their tight budgets, academic research laboratories find it challenging to afford these systems.

A handful of accuracy-related problems and limited use can also hinder growth. For example, body fat scales are unable to detect the body fats around the waistline, which is a risk factor for CVD and type 2 diseases. The result of the skinfold caliper can vary according to the expertise of the person who is taking the measurement.

Analysis of Top Countries Using,Importing,Marketing,and Distributing Body Composition Monitors and Scales

The table below shows the anticipated growth rates of the top countries. China and India are set to record higher CAGRs of 9.2% and 11.2%, respectively, through 2035.

Countries CAGR (2025 to 2035)
United States 4.3%
India 11.2%
China 9.5%
United Kingdom 5.8%
Germany 4.7%

Rising Prevalence of Osteoporosis Fueling Demand in the United States

The United States is anticipated to lead the global body composition monitor and scale market during the forecast period. It held a total market share of about 14.5% in the global market in 2025.

Over the forecast period, the United States body composition monitor and scale market is set to register a CAGR of 4.3% through 2035. This is attributable to the rising prevalence of chronic diseases such as osteoporosis, the growing adoption of advanced medical technologies, and an increasing number of fitness enthusiasts.

According to the data published by the osteoporosis workgroup in 2024, 0.6 million people in America aged 50 and older suffer from osteoporosis. Technologies such as body composition monitors and scales are used to tackle this burden. These devices provide an estimate of bone density, which is necessary for assessing bone health and detecting diseases such as osteoporosis.

The growing interest in preventive healthcare is another key factor expected to drive demand for advanced body composition monitoring solutions. Similarly, increasing the influence of social media and fitness trends will improve the United States' body composition and monitor market share.

Increasing Cases of Obesity Bolstering Sales in China

With a valuation of USD 1.4 million, China accounted for a share of about 9.8% in the global body composition monitor and scale market in 2035. Over the assessment period, sales of body composition monitors and scales are predicted to rise at a 9.5% CAGR.

Rising cases of obesity in China are expected to drive the demand for body composition equipment. According to the study published in the journal Circulation, China overtook the United States as the country with the most obese people.

In China, more than one in seven people and one in three people fulfill the threshold for abdominal obesity. Due to the increased diagnosis-related body mass index in the country, the market for body composition monitors and scales shows lucrative growth.

Growing Health Awareness Boosting India’s Market

India is expected to emerge as the most lucrative market for body composition monitors and scales. This is attributable to the growing awareness about health and fitness, favorable government support, and increasing prevalence of chronic diseases, and the high popularity of portable health monitoring systems.

In 2025, India’s body composition monitor and scale market value totaled USD 44.0 million, holding a market share value of about 7.3% globally. Over the forecast period, demand for body composition monitors and scales in India is predicted to rise at an 11.2% CAGR.

The rising public consciousness regarding health and the implementation of several government initiatives are expected to contribute to the expansion of the market in India. People in India are becoming aware of the importance of maintaining a healthy body composition, thereby driving demand for body composition monitors and scales.

In Delhi and Haryana, government hospitals, along with the Central Council for Research in Yoga and Naturopathy (CCRYN), have established eight yoga outpatient departments, thereby raising health awareness among the population. As a result, the demand for body composition monitor equipment has surged in these yoga centers and health facilities, leading to increased sales of such equipment.

Rising Popularity of Wearable Technology Driving Demand in the United Kingdom

The United Kingdom body composition monitor and scale market size reached USD 0.7 million in 2025. Demand for body composition monitors and scales in the country is set to surge at a 5.8% CAGR throughout the assessment period.

Several factors are expected to uplift body composition monitor and scale demand in the United Kingdom. These include the surging popularity of wearable technology, growing fitness & wellness trends, and rising demand for personalized nutrition.

Body composition monitors and scales allow users to monitor changes in their body composition, thereby aiding in fitness planning and progress tracking. Hence, the growing emphasis on fitness and wellness in the United Kingdom will likely create demand for tools such as body composition and scales.

Increasing Interest in Preventive Healthcare Spurring Growth in Germany

Sales of body composition monitors and scales in Japan are anticipated to soar at a CAGR of around 4.7% during the assessment period. In 2025, total valuation in Germany reached USD 22.75 million.

There is a rising trend in Germany toward preventive healthcare. This is expected to drive sales of body composition monitoring devices as they can provide valuable insights into an individual’s risk for several health conditions.

Ongoing technological advancements in body composition monitoring devices will further improve Germany's body composition monitor and scale industry share. Key companies across Germany are utilizing technologies such as dual-energy X-ray absorptiometry and bioelectrical impedance analysis to develop more sophisticated and accurate body composition monitors and scales.

Body Composition Monitor and Scale Industry Analysis by Top Investment Segments

The below section shows the bio-impedance analyzer segment dominating the body composition monitor and scale market. It is set to rise at a CAGR of 7.2% during the forecast period.

Based on end-users, the hospital segment is expected to hold a prominent market share. It will likely thrive at a CAGR of 6.7% between 2025 and 2035.

Multiple Advantages of Bio-impedance Analyzers Fueling their Demand

Market Growth Outlook by Product

Product Value CAGR
Bio-impedance Analyzer 7.2%
Skinfold Callipers 5.7%
Hydrostatic Weighing Equipment 8.9%
Air Displacement Plethysmography 7.7%
DEXA 7.6%
Others 6.3%

The bio-impedance analyzer segment accounted for a prominent market share of 25.4% in 2025 and is expected to expand with a CAGR of 7.2% during the forecast period. This is due to several advantages of bio-impedance analyzers, including cost-effectiveness and non-invasive nature.

Bio-impedance analyzers are non-invasive, as they do not require needles, blood samples, or any invasive procedures. This non-invasive feature attracts a wide range of users, including individuals who may be uncomfortable with invasive procedures.

The materials used in bioimpedance analysis devices, such as medical-grade plastics, ensure user comfort and safety during the measurement process. Bioimpedance analyzers are convenient and can be used in a variety of settings, such as fitness centers, clinics, and hospitals.

Growing usage of bioimpedance analyzers in-home devices such as smart scales is expected to further boost the target segment. To gain maximum benefits, key players are expected to upgrade their bioimpedance analyzers portfolio by launching novel solutions.

Hospitals Remain Leading Users of Body Composition Monitors and Scales

Market Growth Outlook by End-user

End User Value CAGR
Hospitals 6.7%
Fitness Centers 8.6%
Academic & Research Institutions 6.6%
Homecare Settings 8.0%

As per the latest body composition monitor and scale market analysis, the hospital segment will retain its market dominance through 2035. It accounted for a revenue share of 36.4% in 2025 and is expected to surge with a CAGR of 6.7% during the forecasted period.

The rising number of hospitals globally is expected to drive demand for body composition monitors and scales. Similarly, the increasing preference of patients toward opting for treatments and diagnostic procedures in hospitals will boost the target segment.

Governments worldwide are investing huge amounts in upgrading medical technologies in hospitals. This will create lucrative growth prospects for body composition monitor and scale manufacturers during the assessment period.
Leading Suppliers of Body Composition Monitor and Scale

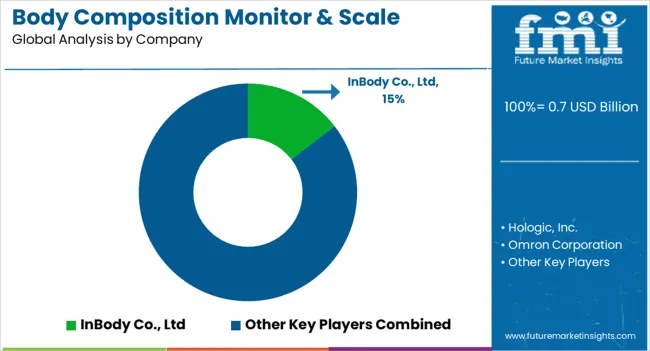
Body Composition Monitor & Scale Market Analysis By Company

Key manufacturers of body composition monitors and scales are introducing novel solutions and apps to meet consumer demand and boost their revenue. They are also implementing strategies such as collaborations, partnerships, alliances, mergers, and acquisitions to expand their global footprint.

Recent Developments in the Body Composition Monitor & Scale Market:

  • In February 2025, Withings acquired 8fit, a prominent health and fitness app, to bolster Withings' capabilities and allow the company to offer enhanced services and assistance to its user base.
  • In December 2024, Contentserv, a leading global provider of Product Experience Cloud, teamed up with Anest Iwata Corporation.

Top Segments Studied in the Body Composition Monitor and Scale Market Report

By Product:

  • Bio-impedance Analyzer
  • Skinfold Calipers
  • Hydrostatic Weighing Equipment / Normal Weighing Equipment
  • Air Displacement Plethysmography
  • DEXA
  • Others

By End-user:

  • Hospitals
  • Fitness Centers
  • Academic & Research Institutions
  • Homecare Settings

By Region:

  • North America
  • Latin America
  • Europe
  • South Asia
  • East Asia
  • Oceania
  • Middle East and Africa

Frequently Asked Questions

How big is the body composition monitor and scale market in 2025?

The global body composition monitor and scale market is estimated to be valued at USD 0.7 billion in 2025.

What will be the size of body composition monitor and scale market in 2035?

The market size for the body composition monitor and scale market is projected to reach USD 1.4 billion by 2035.

How much will be the body composition monitor and scale market growth between 2025 and 2035?

The body composition monitor and scale market is expected to grow at a 7.1% CAGR between 2025 and 2035.

What are the key product types in the body composition monitor and scale market?

The key product types in body composition monitor and scale market are bio-impedance analyzer, skinfold calipers, hydrostatic weighing equipment / normal weighing equipment, air displacement plethysmography, dexa and others.

Which end-user segment to contribute significant share in the body composition monitor and scale market in 2025?

In terms of end-user, fitness centers segment to command 36.4% share in the body composition monitor and scale market in 2025.

Table of Content

  1. Executive Summary
    • Global Market Outlook
    • Demand-side Trends
    • Supply-side Trends
    • Technology Roadmap Analysis
    • Analysis and Recommendations
  2. Market Overview
    • Market Coverage / Taxonomy
    • Market Definition / Scope / Limitations
  3. Market Background
    • Market Dynamics
      • Drivers
      • Restraints
      • Opportunity
      • Trends
    • Scenario Forecast
      • Demand in Optimistic Scenario
      • Demand in Likely Scenario
      • Demand in Conservative Scenario
    • Opportunity Map Analysis
    • Product Life Cycle Analysis
    • Supply Chain Analysis
    • Investment Feasibility Matrix
    • Value Chain Analysis
    • PESTLE and Porter’s Analysis
    • Regulatory Landscape
    • Regional Parent Market Outlook
    • Production and Consumption Statistics
    • Import and Export Statistics
  4. Global Market Analysis 2020 to 2024 and Forecast, 2025 to 2035
    • Historical Market Size Value (USD Million) Analysis, 2020 to 2024
    • Current and Future Market Size Value (USD Million) Projections, 2025 to 2035
      • Y-o-Y Growth Trend Analysis
      • Absolute $ Opportunity Analysis
  5. Global Market Pricing Analysis 2020 to 2024 and Forecast 2025 to 2035
  6. Global Market Analysis 2020 to 2024 and Forecast 2025 to 2035, By Product
    • Introduction / Key Findings
    • Historical Market Size Value (USD Million) Analysis By Product , 2020 to 2024
    • Current and Future Market Size Value (USD Million) Analysis and Forecast By Product , 2025 to 2035
      • Bio-Impedance Analyzer
      • Skinfold Calipers
      • Hydrostatic Weighing Equipment / Normal Weighing Equipment
      • Air Displacement Plethysmography
      • DEXA
      • Others
    • Y-o-Y Growth Trend Analysis By Product , 2020 to 2024
    • Absolute $ Opportunity Analysis By Product , 2025 to 2035
  7. Global Market Analysis 2020 to 2024 and Forecast 2025 to 2035, By End-User
    • Introduction / Key Findings
    • Historical Market Size Value (USD Million) Analysis By End-User, 2020 to 2024
    • Current and Future Market Size Value (USD Million) Analysis and Forecast By End-User, 2025 to 2035
      • Fitness Centers
      • Hospitals
      • Academic & Research Institutions
      • Homecare Settings
    • Y-o-Y Growth Trend Analysis By End-User, 2020 to 2024
    • Absolute $ Opportunity Analysis By End-User, 2025 to 2035
  8. Global Market Analysis 2020 to 2024 and Forecast 2025 to 2035, By Region
    • Introduction
    • Historical Market Size Value (USD Million) Analysis By Region, 2020 to 2024
    • Current Market Size Value (USD Million) Analysis and Forecast By Region, 2025 to 2035
      • North America
      • Latin America
      • Western Europe
      • Eastern Europe
      • East Asia
      • South Asia and Pacific
      • Middle East & Africa
    • Market Attractiveness Analysis By Region
  9. North America Market Analysis 2020 to 2024 and Forecast 2025 to 2035, By Country
    • Historical Market Size Value (USD Million) Trend Analysis By Market Taxonomy, 2020 to 2024
    • Market Size Value (USD Million) Forecast By Market Taxonomy, 2025 to 2035
      • By Country
        • USA
        • Canada
        • Mexico
      • By Product
      • By End-User
    • Market Attractiveness Analysis
      • By Country
      • By Product
      • By End-User
    • Key Takeaways
  10. Latin America Market Analysis 2020 to 2024 and Forecast 2025 to 2035, By Country
    • Historical Market Size Value (USD Million) Trend Analysis By Market Taxonomy, 2020 to 2024
    • Market Size Value (USD Million) Forecast By Market Taxonomy, 2025 to 2035
      • By Country
        • Brazil
        • Chile
        • Rest of Latin America
      • By Product
      • By End-User
    • Market Attractiveness Analysis
      • By Country
      • By Product
      • By End-User
    • Key Takeaways
  11. Western Europe Market Analysis 2020 to 2024 and Forecast 2025 to 2035, By Country
    • Historical Market Size Value (USD Million) Trend Analysis By Market Taxonomy, 2020 to 2024
    • Market Size Value (USD Million) Forecast By Market Taxonomy, 2025 to 2035
      • By Country
        • Germany
        • UK
        • Italy
        • Spain
        • France
        • Nordic
        • BENELUX
        • Rest of Western Europe
      • By Product
      • By End-User
    • Market Attractiveness Analysis
      • By Country
      • By Product
      • By End-User
    • Key Takeaways
  12. Eastern Europe Market Analysis 2020 to 2024 and Forecast 2025 to 2035, By Country
    • Historical Market Size Value (USD Million) Trend Analysis By Market Taxonomy, 2020 to 2024
    • Market Size Value (USD Million) Forecast By Market Taxonomy, 2025 to 2035
      • By Country
        • Russia
        • Poland
        • Hungary
        • Balkan & Baltic
        • Rest of Eastern Europe
      • By Product
      • By End-User
    • Market Attractiveness Analysis
      • By Country
      • By Product
      • By End-User
    • Key Takeaways
  13. East Asia Market Analysis 2020 to 2024 and Forecast 2025 to 2035, By Country
    • Historical Market Size Value (USD Million) Trend Analysis By Market Taxonomy, 2020 to 2024
    • Market Size Value (USD Million) Forecast By Market Taxonomy, 2025 to 2035
      • By Country
        • China
        • Japan
        • South Korea
      • By Product
      • By End-User
    • Market Attractiveness Analysis
      • By Country
      • By Product
      • By End-User
    • Key Takeaways
  14. South Asia and Pacific Market Analysis 2020 to 2024 and Forecast 2025 to 2035, By Country
    • Historical Market Size Value (USD Million) Trend Analysis By Market Taxonomy, 2020 to 2024
    • Market Size Value (USD Million) Forecast By Market Taxonomy, 2025 to 2035
      • By Country
        • India
        • ASEAN
        • Australia & New Zealand
        • Rest of South Asia and Pacific
      • By Product
      • By End-User
    • Market Attractiveness Analysis
      • By Country
      • By Product
      • By End-User
    • Key Takeaways
  15. Middle East & Africa Market Analysis 2020 to 2024 and Forecast 2025 to 2035, By Country
    • Historical Market Size Value (USD Million) Trend Analysis By Market Taxonomy, 2020 to 2024
    • Market Size Value (USD Million) Forecast By Market Taxonomy, 2025 to 2035
      • By Country
        • Kingdom of Saudi Arabia
        • Other GCC Countries
        • Turkiye
        • South Africa
        • Other African Union
        • Rest of Middle East & Africa
      • By Product
      • By End-User
    • Market Attractiveness Analysis
      • By Country
      • By Product
      • By End-User
    • Key Takeaways
  16. Key Countries Market Analysis
    • USA
      • Pricing Analysis
      • Market Share Analysis, 2024
        • By Product
        • By End-User
    • Canada
      • Pricing Analysis
      • Market Share Analysis, 2024
        • By Product
        • By End-User
    • Mexico
      • Pricing Analysis
      • Market Share Analysis, 2024
        • By Product
        • By End-User
    • Brazil
      • Pricing Analysis
      • Market Share Analysis, 2024
        • By Product
        • By End-User
    • Chile
      • Pricing Analysis
      • Market Share Analysis, 2024
        • By Product
        • By End-User
    • Germany
      • Pricing Analysis
      • Market Share Analysis, 2024
        • By Product
        • By End-User
    • UK
      • Pricing Analysis
      • Market Share Analysis, 2024
        • By Product
        • By End-User
    • Italy
      • Pricing Analysis
      • Market Share Analysis, 2024
        • By Product
        • By End-User
    • Spain
      • Pricing Analysis
      • Market Share Analysis, 2024
        • By Product
        • By End-User
    • France
      • Pricing Analysis
      • Market Share Analysis, 2024
        • By Product
        • By End-User
    • India
      • Pricing Analysis
      • Market Share Analysis, 2024
        • By Product
        • By End-User
    • ASEAN
      • Pricing Analysis
      • Market Share Analysis, 2024
        • By Product
        • By End-User
    • Australia & New Zealand
      • Pricing Analysis
      • Market Share Analysis, 2024
        • By Product
        • By End-User
    • China
      • Pricing Analysis
      • Market Share Analysis, 2024
        • By Product
        • By End-User
    • Japan
      • Pricing Analysis
      • Market Share Analysis, 2024
        • By Product
        • By End-User
    • South Korea
      • Pricing Analysis
      • Market Share Analysis, 2024
        • By Product
        • By End-User
    • Russia
      • Pricing Analysis
      • Market Share Analysis, 2024
        • By Product
        • By End-User
    • Poland
      • Pricing Analysis
      • Market Share Analysis, 2024
        • By Product
        • By End-User
    • Hungary
      • Pricing Analysis
      • Market Share Analysis, 2024
        • By Product
        • By End-User
    • Kingdom of Saudi Arabia
      • Pricing Analysis
      • Market Share Analysis, 2024
        • By Product
        • By End-User
    • Turkiye
      • Pricing Analysis
      • Market Share Analysis, 2024
        • By Product
        • By End-User
    • South Africa
      • Pricing Analysis
      • Market Share Analysis, 2024
        • By Product
        • By End-User
  17. Market Structure Analysis
    • Competition Dashboard
    • Competition Benchmarking
    • Market Share Analysis of Top Players
      • By Regional
      • By Product
      • By End-User
  18. Competition Analysis
    • Competition Deep Dive
      • InBody Co., Ltd
        • Overview
        • Product Portfolio
        • Profitability by Market Segments (Product/Age /Sales Channel/Region)
        • Sales Footprint
        • Strategy Overview
          • Marketing Strategy
          • Product Strategy
          • Channel Strategy
      • Hologic, Inc.
      • Omron Corporation
      • Tanita Corporation
      • Bodystat
      • Cosmed S.R.L
      • Maltron International Ltd
      • Seca GmbH & Co. Kg.
      • SELVAS AI Inc. (Jawon Medical Co., Ltd.)
      • RJL Systems, Inc.
      • Beijing Sincoheren
      • Kern & Sohn
      • Laica International Corporation
      • Medisante Group AG
      • Guangzhou Beautylife Electronic Technology
      • Charder Electronics CO. Ltd
  19. Assumptions & Acronyms Used
  20. Research Methodology

List of Tables

  • Table 1: Global Market Value (USD Million) Forecast by Region, 2020-2035
  • Table 2: Global Market Value (USD Million) Forecast by Product , 2020-2035
  • Table 3: Global Market Value (USD Million) Forecast by End-User, 2020-2035
  • Table 4: North America Market Value (USD Million) Forecast by Country, 2020-2035
  • Table 5: North America Market Value (USD Million) Forecast by Product , 2020-2035
  • Table 6: North America Market Value (USD Million) Forecast by End-User, 2020-2035
  • Table 7: Latin America Market Value (USD Million) Forecast by Country, 2020-2035
  • Table 8: Latin America Market Value (USD Million) Forecast by Product , 2020-2035
  • Table 9: Latin America Market Value (USD Million) Forecast by End-User, 2020-2035
  • Table 10: Western Europe Market Value (USD Million) Forecast by Country, 2020-2035
  • Table 11: Western Europe Market Value (USD Million) Forecast by Product , 2020-2035
  • Table 12: Western Europe Market Value (USD Million) Forecast by End-User, 2020-2035
  • Table 13: Eastern Europe Market Value (USD Million) Forecast by Country, 2020-2035
  • Table 14: Eastern Europe Market Value (USD Million) Forecast by Product , 2020-2035
  • Table 15: Eastern Europe Market Value (USD Million) Forecast by End-User, 2020-2035
  • Table 16: East Asia Market Value (USD Million) Forecast by Country, 2020-2035
  • Table 17: East Asia Market Value (USD Million) Forecast by Product , 2020-2035
  • Table 18: East Asia Market Value (USD Million) Forecast by End-User, 2020-2035
  • Table 19: South Asia and Pacific Market Value (USD Million) Forecast by Country, 2020-2035
  • Table 20: South Asia and Pacific Market Value (USD Million) Forecast by Product , 2020-2035
  • Table 21: South Asia and Pacific Market Value (USD Million) Forecast by End-User, 2020-2035
  • Table 22: Middle East & Africa Market Value (USD Million) Forecast by Country, 2020-2035
  • Table 23: Middle East & Africa Market Value (USD Million) Forecast by Product , 2020-2035
  • Table 24: Middle East & Africa Market Value (USD Million) Forecast by End-User, 2020-2035

List of Figures

  • Figure 1: Global Market Pricing Analysis
  • Figure 2: Global Market Value (USD Million) Forecast 2020-2035
  • Figure 3: Global Market Value Share and BPS Analysis by Product , 2025 and 2035
  • Figure 4: Global Market Y-o-Y Growth Comparison by Product , 2025-2035
  • Figure 5: Global Market Attractiveness Analysis by Product
  • Figure 6: Global Market Value Share and BPS Analysis by End-User, 2025 and 2035
  • Figure 7: Global Market Y-o-Y Growth Comparison by End-User, 2025-2035
  • Figure 8: Global Market Attractiveness Analysis by End-User
  • Figure 9: Global Market Value (USD Million) Share and BPS Analysis by Region, 2025 and 2035
  • Figure 10: Global Market Y-o-Y Growth Comparison by Region, 2025-2035
  • Figure 11: Global Market Attractiveness Analysis by Region
  • Figure 12: North America Market Incremental Dollar Opportunity, 2025-2035
  • Figure 13: Latin America Market Incremental Dollar Opportunity, 2025-2035
  • Figure 14: Western Europe Market Incremental Dollar Opportunity, 2025-2035
  • Figure 15: Eastern Europe Market Incremental Dollar Opportunity, 2025-2035
  • Figure 16: East Asia Market Incremental Dollar Opportunity, 2025-2035
  • Figure 17: South Asia and Pacific Market Incremental Dollar Opportunity, 2025-2035
  • Figure 18: Middle East & Africa Market Incremental Dollar Opportunity, 2025-2035
  • Figure 19: North America Market Value Share and BPS Analysis by Country, 2025 and 2035
  • Figure 20: North America Market Value Share and BPS Analysis by Product , 2025 and 2035
  • Figure 21: North America Market Y-o-Y Growth Comparison by Product , 2025-2035
  • Figure 22: North America Market Attractiveness Analysis by Product
  • Figure 23: North America Market Value Share and BPS Analysis by End-User, 2025 and 2035
  • Figure 24: North America Market Y-o-Y Growth Comparison by End-User, 2025-2035
  • Figure 25: North America Market Attractiveness Analysis by End-User
  • Figure 26: Latin America Market Value Share and BPS Analysis by Country, 2025 and 2035
  • Figure 27: Latin America Market Value Share and BPS Analysis by Product , 2025 and 2035
  • Figure 28: Latin America Market Y-o-Y Growth Comparison by Product , 2025-2035
  • Figure 29: Latin America Market Attractiveness Analysis by Product
  • Figure 30: Latin America Market Value Share and BPS Analysis by End-User, 2025 and 2035
  • Figure 31: Latin America Market Y-o-Y Growth Comparison by End-User, 2025-2035
  • Figure 32: Latin America Market Attractiveness Analysis by End-User
  • Figure 33: Western Europe Market Value Share and BPS Analysis by Country, 2025 and 2035
  • Figure 34: Western Europe Market Value Share and BPS Analysis by Product , 2025 and 2035
  • Figure 35: Western Europe Market Y-o-Y Growth Comparison by Product , 2025-2035
  • Figure 36: Western Europe Market Attractiveness Analysis by Product
  • Figure 37: Western Europe Market Value Share and BPS Analysis by End-User, 2025 and 2035
  • Figure 38: Western Europe Market Y-o-Y Growth Comparison by End-User, 2025-2035
  • Figure 39: Western Europe Market Attractiveness Analysis by End-User
  • Figure 40: Eastern Europe Market Value Share and BPS Analysis by Country, 2025 and 2035
  • Figure 41: Eastern Europe Market Value Share and BPS Analysis by Product , 2025 and 2035
  • Figure 42: Eastern Europe Market Y-o-Y Growth Comparison by Product , 2025-2035
  • Figure 43: Eastern Europe Market Attractiveness Analysis by Product
  • Figure 44: Eastern Europe Market Value Share and BPS Analysis by End-User, 2025 and 2035
  • Figure 45: Eastern Europe Market Y-o-Y Growth Comparison by End-User, 2025-2035
  • Figure 46: Eastern Europe Market Attractiveness Analysis by End-User
  • Figure 47: East Asia Market Value Share and BPS Analysis by Country, 2025 and 2035
  • Figure 48: East Asia Market Value Share and BPS Analysis by Product , 2025 and 2035
  • Figure 49: East Asia Market Y-o-Y Growth Comparison by Product , 2025-2035
  • Figure 50: East Asia Market Attractiveness Analysis by Product
  • Figure 51: East Asia Market Value Share and BPS Analysis by End-User, 2025 and 2035
  • Figure 52: East Asia Market Y-o-Y Growth Comparison by End-User, 2025-2035
  • Figure 53: East Asia Market Attractiveness Analysis by End-User
  • Figure 54: South Asia and Pacific Market Value Share and BPS Analysis by Country, 2025 and 2035
  • Figure 55: South Asia and Pacific Market Value Share and BPS Analysis by Product , 2025 and 2035
  • Figure 56: South Asia and Pacific Market Y-o-Y Growth Comparison by Product , 2025-2035
  • Figure 57: South Asia and Pacific Market Attractiveness Analysis by Product
  • Figure 58: South Asia and Pacific Market Value Share and BPS Analysis by End-User, 2025 and 2035
  • Figure 59: South Asia and Pacific Market Y-o-Y Growth Comparison by End-User, 2025-2035
  • Figure 60: South Asia and Pacific Market Attractiveness Analysis by End-User
  • Figure 61: Middle East & Africa Market Value Share and BPS Analysis by Country, 2025 and 2035
  • Figure 62: Middle East & Africa Market Value Share and BPS Analysis by Product , 2025 and 2035
  • Figure 63: Middle East & Africa Market Y-o-Y Growth Comparison by Product , 2025-2035
  • Figure 64: Middle East & Africa Market Attractiveness Analysis by Product
  • Figure 65: Middle East & Africa Market Value Share and BPS Analysis by End-User, 2025 and 2035
  • Figure 66: Middle East & Africa Market Y-o-Y Growth Comparison by End-User, 2025-2035
  • Figure 67: Middle East & Africa Market Attractiveness Analysis by End-User
  • Figure 68: Global Market - Tier Structure Analysis
  • Figure 69: Global Market - Company Share Analysis
Dashboard
Dashboard
Dashboard
Dashboard
Dashboard
Dashboard

Full Research Suite comprises of:

Market outlook & trends analysis

Market outlook & trends analysis

Interviews & case studies

Interviews & case studies

Strategic recommendations

Strategic recommendations

Vendor profiles & capabilities analysis

Vendor profiles & capabilities analysis

5-year forecasts

5-year forecasts

8 regions and 60+ country-level data splits

8 regions and 60+ country-level data splits

Market segment data splits

Market segment data splits

12 months of continuous data updates

12 months of continuous data updates

DELIVERED AS:

PDF EXCEL ONLINE

Full Research Suite


$5000

$7500

$10000

Buy Report Now
Similar Industry Reports

Similar Industry Reports

Body Armor Plates Market

Body Armor Plates Market Size and Share Forecast Outlook 2025 to 2035

Body Tape Market
Body Tape Market

Body Tape Market Size and Share Forecast Outlook 2025 to 2035

Body Blurring Cosmetics Market

Body Blurring Cosmetics Market Size and Share Forecast Outlook 2025 to 2035

Body Contouring Market

Body Contouring Market Size and Share Forecast Outlook 2025 to 2035

Body Fat Reduction Market

Body Fat Reduction Market Growth - Trends & Forecast 2025 to 2035

Body Armor Market
Body Armor Market

Body Armor Market Analysis - Size, Share & Forecast 2025 to 2035

Body-Worn Temperature Sensors Market

Body-Worn Temperature Sensors Market Analysis by Type, Application, and Region through 2025 to 2035

Body Fat Measurement Market

Body Fat Measurement Market Analysis - Trends, Growth & Forecast 2025 to 2035

Body Slimming Devices Market

Body Slimming Devices Market Analysis by Product, End-User and Region through 2035

Body Augmentation Fillers Market Share Analysis

Leading Providers & Market Share in Body Augmentation Fillers

Body Firming Creams Market

Body Firming Creams Market Growth & Forecast 2025-2035

Body Luminizer Market

Body Luminizer Market Trends & Forecast 2025 to 2035

Body Scrub Market
Body Scrub Market

Body Scrub Market Growth & Forecast 2025 to 2035

Body Dryer Market
Body Dryer Market

Body Dryer Market

Body In White Market

Body In White Market

Antibody Market
Antibody Market

Antibody Market Size and Share Forecast Outlook 2025 to 2035

Antibody Specificity Testing Market

Antibody Specificity Testing Market Size and Share Forecast Outlook 2025 to 2035

Antibody Therapy Market

Antibody Therapy Market Insights - Growth, Demand & Forecast 2025 to 2035

Antibody Profiling Market

Antibody Profiling Market Analysis - Size, Share, & Forecast Outlook 2025 to 2035

Antibody Purification Service Market

Antibody Purification Service Market - Growth, Demand & Forecast 2025 to 2035

Future Market Insights

Body Composition Monitor and Scale Market

Chat With MaRIA

Chat With

MaRIA

Hi There, I am MaRIA, Your Market Research Intelligence Assistant. How may I help you?