Blood Warmer Devices Market Outlook (2022 to 2032)

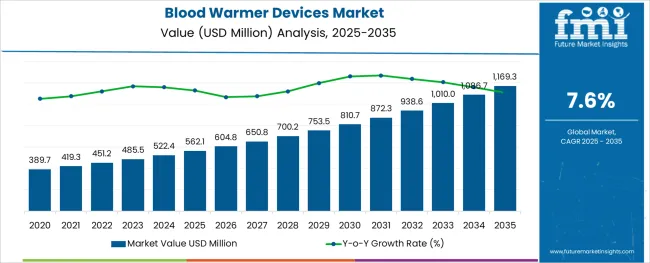
[276 Pages Report] The global blood warmer devices market size is expected to reach a valuation of US$ 451.2 Million in 2022, and further expand at a CAGR of 7.6% from 2022 to 2032. The market is projected to reach a valuation of ~US$ 937.5 Million by the end of 2032. Intravenous warming systems in terms of products are leading the market and it held a share of about 47.1% in 2021.

Growth in the blood warmer devices market is set to be driven by the rising prevalence of conditions like hypothermia in which the body temperature drops. Such a situation arises when the body loses heat faster than it can produce heat, and the temperature drops below 35 C. Hypothermia is generally caused due to prolonged exposure to very cold temperatures. It is also common in the neonatal period, and old age, as well as in medical conditions like dementia, hypothyroidism, and low blood sugar. Trauma patients are also highly susceptible to hypothermia.

As per the Centers for Disease Control and Prevention (CDC), from 2018 to 2020, death rates caused by hypothermia were about 0.40 per 100,000 for rural area females and 0.93 for men in rural areas. It is also predicted that the number of untracked hypothermia deaths is on the rise.

To overcome conditions of hypothermia, there are different devices used to warm the blood to minimize the risk of hypothermia, as in many instances, hypothermia can lead to abnormal functioning of the heart, nervous system, and respiratory system. Even in extreme cases, it can lead to complete failure of the heart or respiratory system. Thus, the use of blood warmers is a necessity in this aspect and so the blood warmer devices market is anticipated to grow at a rapid pace in the forecast period.

Attributes Key Statistics
Global Blood Warmer Devices Market Estimated Size (2022E) US$ 451.2 Million
Projected Market Valuation (2032F) US$ 937.5 Million
Value-based CAGR (2022 to 2032) 7.6%
Collective Value Share: Top 5 Countries 56.2%

Don't pay for what you don't need

Customize your report by selecting specific countries or regions and save 30%!

Development of Healthcare Infrastructure in North America to Facilitate Blood Warmer Devices Market Growth

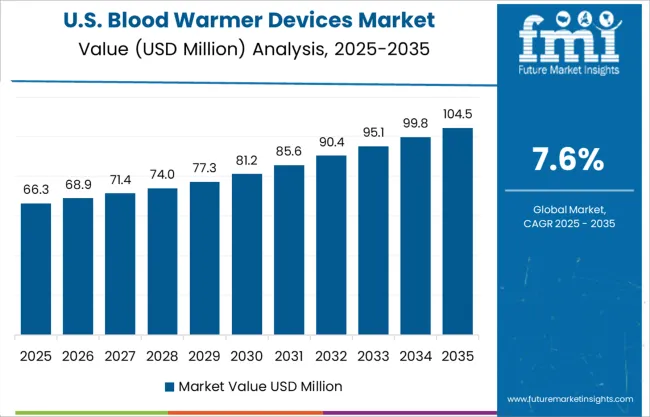
Government agencies in the North American region are ordering blood warmer devices in a number of countries to provide good treatment in emergency scenarios. North America is one of the leading markets for Blood Warmer Devices products, driven largely by the USA with a total market share of about 93.3% in 2021, and a similar trend is expected over the forecast period.

In the USA, the adoption of technologically advanced products is quite higher which is why it is a dominating region. The increasing trauma cases in the USA lead to hypothermia which in turn increases the adoption of blood-warmer devices. As per LERN, Louisiana Emergency Response Network, the number of trauma cases in the USA accounts for about 37 million emergency department visits in hospitals. Hence, the sales of blood warmer devices are quite high in the USA and are anticipated to grow in the forecast period.

The presence of major industry players like 3M, BD, ICU Medical Inc., (Smith Medical, Inc.) and others are quite high in the USA market and this has also increased the availability of blood warmer devices in the USA For instance, in March 2021, MEQU, a medical technology business, won a public tender to offer portable blood warmers to the Norwegian National Air Ambulance Services. Most of the time, air ambulance services deal with crisis circumstances. Before administering to the patient, all solutions should be warmed up. Hence, ambulance services are equipped with blood warmers to facilitate this practice.

Blood Warmer Devices Market

What are the Key Opportunities for Blood Warmer Devices Providers?

Major technological shifts in healthcare infrastructure and the rising use of advanced machinery are expected to positively affect the growth of Blood Warmer Devices production over the forecast period. The manufacturers are penetrating into various market segments by introducing Blood Warmer Devices-based products. Further, a number of international market participants are entering into acquisitions and mergers to gain a major revenue share.

For instance, in January 2022, QinFlow Inc. received a group buy agreement from Premier, Inc. for blood and fluid warming products. This arrangement will give healthcare organizations access to their next-generation blood-warming technology, which has been fine-tuned to suit the stringent requirements of emergency departments, intensive care units, operating rooms, and trauma bays. Thus, the industry is expected to grow rapidly in the coming years.

The growth of the blood warmer devices market is inclined to the prevalence of conditions like hypothermia in which the body temperature drops. The situation arises when the body loses heat faster than it can produce heat, and the temperature drops below 35 C. Hypothermia is generally caused by prolonged exposure to very cold temperatures. It is also common in the neonatal period, old age as well as in medical conditions like dementia, hypothyroidism, and low blood sugar. Trauma patients are also highly susceptible to hypothermia.

As per the Centers for Disease Control and Prevention, from 2018 to 2020, death rates caused by hypothermia were about 0.40 per 100,000 for rural area females and 0.93 for men in rural areas.

It is also predicted that the number of untracked hypothermia deaths is also on the rise. To overcome the conditions of hypothermia there are different devices used to warm the blood to minimize the risk of hypothermia because in many instances hypothermia can lead to abnormal functioning of the heart, nervous system, and respiratory system, even in extreme cases it can lead to complete failure of the heart or respiratory system. Thus the use of blood warmers is quite a necessity in this aspect and so there will be growth in the blood warmer devices market in the forecast period

Sabyasachi Ghosh
Sabyasachi Ghosh

Principal Consultant

Talk to Analyst

Find your sweet spots for generating winning opportunities in this market.

2017 to 2021 Global Blood Warmer Devices Demand Outlook Compared to 2022 to 2032 Forecast

The global blood warmer devices market holds approximately 5.0% of the global fluid management systems market, which was worth ~US$ 8.5 Billion in 2021. Sales in the blood warmer devices market expanded at a CAGR of 6.4% from 2017 to 2021.

The increasing neonatal and geriatric population globally is a leading driver of the blood warmer devices market. Rising cases of neonatal hypothermia are mainly attributed to the high surface area as per their body weight, less subcutaneous fat, and increased body water content. With advancing age, people lose their ability to endure long exposure to cold, which usually leads to hypothermia. This is set to positively impact the blood warmer devices market in the upcoming decade.

Technological advancements can also be considered to be a recognizable driver for this market. There are different types of blood warmers that could be useful for various medical conditions. For instance, ICU Medical, Inc. provides technologically advanced products for surgical procedures.

There are also devices such as Snuggle Warm Blankets that reduce the risk of surgical site infection and fluid warmers with air detectors that allow for quick removal of air and restoration of flow without disconnecting from the patient. Thus, technological advancement is set to lead to the wider adoption of blood-warmer devices globally. Owing to the aforementioned factors, the global blood warmer devices market is expected to grow at a CAGR of 7.6% during the forecast period from 2022 to 2032.

Top Trend Driving Sales of Blood Warmer Devices

  • Increasing Prevalence of Hypothermia to Drive Demand by 2032

The global market is set to exhibit an assertive outlook owing to increased awareness about the care of hypothermia in countries where awareness is low. For instance, the Faculty of Medicine, Menoufia University, Egypt has analyzed the effect of designed guidelines on nurses′ performance to prevent hypothermia in preterm infants as hypothermia is a major factor causing neonatal death in developing countries.

Increased research and technology development, as well as rising awareness among people, would thus contribute to growth in the adoption of blood warmer devices across hospitals and clinics. These devices help to maintain one’s overall body temperature. This can be considered to be an opportunistic factor for growth in the blood warmer devices market.

Get the data you need at a Fraction of the cost

Personalize your report by choosing insights you need
and save 40%!

Which Factors Are Restraining the Demand for Blood Warmer Devices?

The cost linked with advanced blood warmer products is quite high for certain settings like home care. The individual cost is higher for low and middle-income countries. For instance, the price range in India is from 50,000 to 1, 50,000 INR per piece. These high costs, along with no reimbursement rate can hamper growth in the blood warmer devices market in certain developing countries.

Apart from this, strict regulations in various countries concerning the efficacy and safety of blood warmer devices may hamper the market to a certain extent. For instance, in September 2021, the USA Food and Drug Administration (FDA) identified blood warmer devices that possess the potential risk of aluminum leaching and instructed a voluntary recall action. Thus, the above-mentioned factors collectively propose a negative effect on growth in the blood warmer devices market.
Country-wise Insights

Why is the USA a Significant Manufacturing Hub for Blood Warmer Devices?

Rising Number of Trauma Cases in the USA to Push Sales of Blood Warmer Machines

The USA dominates the North American blood warmer devices market and held a total share of about 93.3% in 2021. In the USA, the adoption of technologically advanced products is quite high, which is why it is a dominating country. An increasing number of trauma cases in the USA would lead to hypothermia, which in turn, can push the adoption of blood-warmer devices.

As per Louisiana Emergency Response Network (LERN), the number of trauma cases in the USA accounts for about 37 million emergency department visits in hospitals. Hence, sales of blood warmer devices are quite high in the USA and are anticipated to grow in the forecast period. The presence of major industry players like 3M, BD, ICU Medical Inc., (Smith Medical, Inc.), and others in the USA market has also increased the availability of blood warmer devices in the country.

What Makes the UK a Highly Lucrative Industry for Blood Warmer Devices?

Demand for Medical Fluid Warmers to Soar in the UK with Growing Cold-Related Deaths

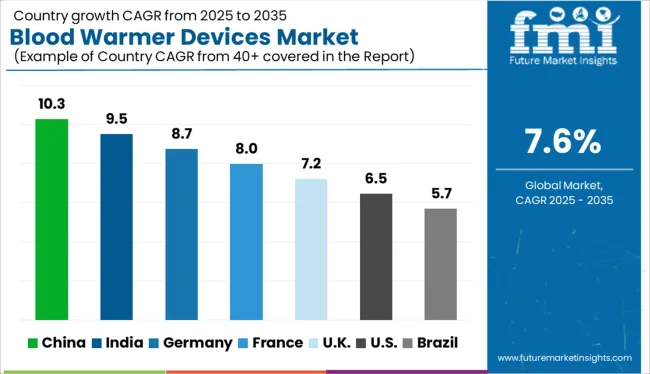
The UK is set to hold a share of 5.1% in the global blood warmer devices market during the forecast period. In 2021, the UK held a share of about 16.3% in the Europe blood warmer devices market, finds FMI.

As per the London School of Hygiene and Tropical Medicine, in England and Wales, the number of cold-related deaths was around 60,500 between 2000 and 2019. It is mainly because of the extremely cold weather conditions in the region and accordingly, the adoption of blood-warmer devices is also increasing. Hence, the blood warmer devices market in the UK is set to be very lucrative.

What is the Outlook of China in the Blood Warmer Devices Industry?

Chinese Blood and Fluid Warmer Manufacturers to Offer Portable Devices by 2032

China held approximately 4.3% of the share in the global blood warmer devices market in 2021. The market is estimated to grow at a CAGR of about 8.0% in the next decade. The country is considered to be a growing market in terms of the adoption of blood warmer devices. There are several Chinese manufacturers such as Wuhan Union Medical Technology Co., Ltd, Suzhou Power Biotech Co., Ltd, and Anjue Medical Equipment Co., Ltd. providing products such as portable and hospital-use devices. This factor has contributed to the high growth of the blood warmer devices market in China.

Category-wise Insights

Which is the Highly Preferred Blood Warmer Device Worldwide?

Demand for Portable Blood Warmers and Intravenous Warming Systems to Grow by 2032

By product, the intravenous warming system segment is expected to showcase high growth at a CAGR of 7.4% by the end of the forecast period. As per FMI, the segment held a steady share of nearly 47.1% in the global blood warmer devices market in 2021.

The use of intravenous warming systems has a direct and immediate effect on the patient prior to surgery or prior to blood transfusion, and thus their utilization is more. This further helps the patient to reduce shivering and increase their overall comfort. Therefore, the intravenous warming system segment is significantly dominating in terms of products.

Which is the Dominant Application of Blood Warmer Devices?

Medical Fluid Warmers Are to Be Extensively Used for Preoperative Care

Preoperative care accounted for a revenue share of 36.5% globally in 2021 and is expected to display a CAGR of 7.4% over the forecast period. The use of blood warmers is highest during preoperative care because the temperature of the human body generally drops during this period. There are symptoms of shivering and drops in blood pressure, which often lead to the urgent need for blood warmer devices prior to blood transfusion and surgery. Thus, preoperative care holds the highest market share in terms of application.

Who is the Leading End User of Blood Warmer Devices Globally?

Hospitals and Clinics to Highly Prefer Fluid Warming Devices for Acute Care

The hospitals and clinics segment held the highest market share of 49.8% in the year 2021. The use of blood warmer devices is highest in such settings because of the increased patient flow, including preoperative cases, acute care, surgical procedures, and neonatal care. Usage is the highest in the surgery department of hospitals. Thus, the hospitals and clinics end-user segment is estimated to generate the largest market share in the forecast period.
Competitive Landscape

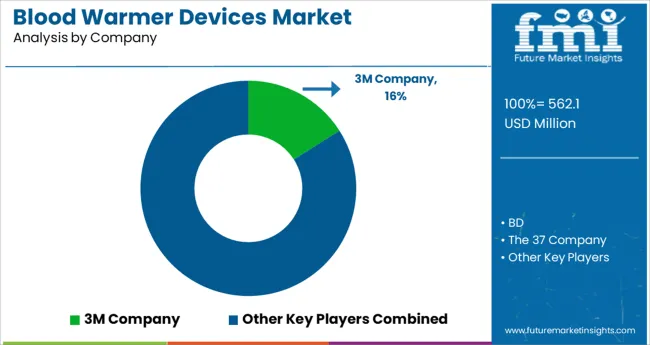
To strengthen their presence around the globe and improve their business strategies, key players are involved in various product launches, expansions, collaborations, and mergers & acquisitions. Below are some of the key promotional strategies adopted by key players in the global blood warmer devices market:

  • On January 6, 2022, ICU Medical Inc. announced its acquisition of Smiths Medical from Smiths Group plc.
  • In March 2019, Smiths Medical announced the launch of Level 1 Convective Warmer. It is a simple thermal care product to help patients maintain their normal body temperature.

Scope of the Blood Warmer Devices Market Report

Attribute Details
Estimated Market Size (2022) US$ 451.2 Million
Projected Market Valuation (2032) US$ 937.5 Million
Value-based CAGR (2022 to 2032) 7.6%
Forecast Period 2022 to 2032
Historical Data Available for 2017 to 2021
Market Analysis Value (US$ Million)
Key Regions Covered North America; Latin America; Europe; East Asia; South Asia; Oceania; and Middle East & Africa
Key Countries Covered USA, Canada, Mexico, Brazil, Argentina, UK, Germany, Italy, France, Spain, Russia, BENELUX, China, Japan, South Korea, India, Indonesia, Malaysia, Thailand, Australia, New Zealand, GCC Countries, Turkey, South Africa, and North Africa.
Key Market Segments Covered Product, Application, End User, and Region
Key Companies Profiled 3M Company; Becton Dickinson (BD); The 37 Company; Emit Corporation; GE Healthcare; Stryker Corporation; Barkey GmbH & Co. KG; Geratherm Medical; Stihler Electronic GmbH; Belmont Instrument; Biegler GmbH; Baxter International Inc. (Gambro); Keewell Medical Technology Co. Ltd.; ICU Medical Inc. (Smiths Medical); Vyaire Medical, Inc.,; The Surgical Company; Life Warmer; MEQU; Estill Medical Technologies, Inc.; Smisson-Cartledge Biomedical
Report Coverage Market Forecast, Company Share Analysis, Competition Intelligence, Drivers, Restraints, Opportunities and Threats Analysis, Market Dynamics and Challenges, and Strategic Growth Initiatives

Key Segments Covered in Blood Warmer Devices Market Report

By Product:

  • Intravenous Warming System
  • Surface Warming System
  • Blood Warming Accessories

By Application:

  • Preoperative Care
  • Home Care
  • Acute Care
  • New Born Care
  • Others

By End User:

  • Hospitals and Clinics
  • Ambulatory Services
  • Blood Banks
  • Home Care Settings
  • Others

By Region:

  • North America
  • Latin America
  • Europe
  • South Asia
  • East Asia
  • Oceania
  • Middle East and Africa (MEA)

Frequently Asked Questions

How much was the blood warmer devices market worth in 2021?

The global blood warmer devices market was worth US$ 423.7 Million in 2021.

What is the sales forecast for the blood warmer devices market through 2032?

The blood warmer devices market is expected to reach US$ 937.5 Million by end of 2032 and grow at a CAGR of 7.6% from 2022 to 2032.

Which region has the highest share in the global blood warmer devices market?

North America dominated the global blood warmer devices market, accounting for the highest share of 38.7% in 2021.

What is the share of Latin America in the global blood warmer devices market?

Latin America held a share of 4.2% in 2021 and exhibited growth at a CAGR of 7.5%.

What is the outlook of the UK blood warmer devices market?

The UK accounted for a share of around 16.3% in 2021 in the Europe blood warmer devices market and the country is set to showcase a lucrative CAGR of 7.5% during the forecast period.

How likely is the blood warmer devices market to grow in China?

China accounted for about 36.8% of the East Asia blood warmer devices market share in 2021 and is projected to grow at a CAGR of 8.0% in the forecast period.

Which are the top five countries driving demand in the blood warmer devices market?

The USA, the UK, Germany, China, and Japan are the top five countries, which are expected to drive demand in the blood warmer devices market.

What was the historical CAGR of the blood warmer devices market?

From 2017 to 2021, the blood warmer devices market grew at a CAGR of 6.4%.

How is the Japan blood warmer devices market progressing?

The blood warmer devices market in Japan is expected to grow at 7.9% CAGR during the forecast period.

What is the outlook of Germany in the blood warmer devices market?

Germany is set to witness a lucrative CAGR of 7.4% during the forecast period.

Table of Content
1. Executive Summary | Blood Warmer Devices Market
    1.1. Global Market Outlook
    1.2. Demand Side Trends
    1.3. Supply-Side Side Trends
    1.4. Analysis and Recommendations
2. Market Overview
    2.1. Market Coverage / Taxonomy
    2.2. Market Definition / Scope / Limitations
    2.3. Inclusions and Exclusions
3. Key Market Trends
    3.1. Key Trends Impacting the Market
    3.2. Product Innovation / Development Trends
4. Key Success Factors
    4.1. Product Adoption / Usage Analysis
    4.2. Product USP Analysis
    4.3. Key Strategies Adopted by Manufacturers
    4.4. Regulatory Scenario
    4.5. PESTLE Analysis
    4.6. Porter’s Analysis
    4.7. Value Chain Analysis
5. Market Background
    5.1. Macro-Economic Factors
        5.1.1. Global GDP Growth Outlook
        5.1.2. Global Healthcare Spending Outlook
        5.1.3. Global Medical Devices Market Overview
    5.2. Forecast Factors - Relevance & Impact
        5.2.1. Key Players Historical Growth
        5.2.2. Technological Advancements
        5.2.3. Increased Growth Strategies of Top Players
        5.2.4. Regulatory Landscape
        5.2.5. Product Setup Cost
        5.2.6. Product Adoption
        5.2.7. Increase in Research and Development
    5.3. Market Dynamics
        5.3.1. Drivers
        5.3.2. Restraints
        5.3.3. Opportunity Analysis
6. COVID-19 Crisis Analysis
    6.1. COVID-19 and Impact Analysis
        6.1.1. By Product
        6.1.2. By Application
        6.1.3. By End User
        6.1.4. By Region
    6.2. 2021 Market Scenario
7. Global Market Demand Analysis 2017 to 2021 and Forecast, 2022 to 2032
    7.1. Historical Market Volume (Units) Analysis, 2017 to 2021
    7.2. Current and Future Market Volume (Units) Projections, 2022 to 2032
        7.2.1. Y-o-Y Growth Trend Analysis
8. Global Market - Pricing Analysis
    8.1. Regional Pricing Analysis by Product
    8.2. Pricing Break Up
        8.2.1. Manufacturer Level
        8.2.2. Distributor Level
    8.3. Global Average Pricing Analysis Benchmark
    8.4. Pricing Assumptions
9. Global Market Demand (in Value or Size in US$ Million) Analysis 2017 to 2021 and Forecast, 2022 to 2032
    9.1. Historical Market Value (US$ Million) Analysis 2017 to 2021
    9.2. Current and Future Market Value (US$ Million) Projections, 2022 to 2032
        9.2.1. Y-o-Y Growth Trend Analysis
        9.2.2. Absolute $ Opportunity Analysis
10. Global Market Analysis 2017 to 2021 and Forecast 2022 to 2032, By Product
    10.1. Introduction / Key Findings
    10.2. Historical Market Size (US$ Million) and Volume (Units) Analysis by Product, 2017 to 2021
    10.3. Current and Future Market Size (US$ Million) and Volume (Units) Analysis and Forecast by Product, 2022 to 2032
        10.3.1. Intravenous Warming System
        10.3.2. Surface Warming System
        10.3.3. Blood Warming Accessories
    10.4. Market Attractiveness Analysis by Product
11. Global Market Analysis 2017 to 2021 and Forecast 2022 to 2032, By Application
    11.1. Introduction / Key Findings
    11.2. Historical Market Size (US$ Million) and Volume (Units) Analysis by Application, 2017 to 2021
    11.3. Current and Future Market Size (US$ Million) and Volume (Units) Analysis and Forecast by Application, 2022 to 2032
        11.3.1. Preoperative Care
        11.3.2. Home Care
        11.3.3. Acute Care
        11.3.4. New Born Care
        11.3.5. Others
    11.4. Market Attractiveness Analysis by Application
12. Global Market Analysis 2017 to 2021 and Forecast 2022 to 2032, By End User
    12.1. Introduction / Key Findings
    12.2. Historical Market Size (US$ Million) and Volume (Units) Analysis by End User, 2017 to 2021
    12.3. Current and Future Market Size (US$ Million) and Volume (Units) Analysis and Forecast by End User, 2022 to 2032
        12.3.1. Hospitals and Clinics
        12.3.2. Ambulatory Services
        12.3.3. Blood Banks
        12.3.4. Home care settings
        12.3.5. Others
    12.4. Market Attractiveness Analysis by End User
13. Global Market Analysis 2017 to 2021 and Forecast 2022 to 2032, by Region
    13.1. Introduction
    13.2. Historical Market Size (US$ Million) Analysis by Region, 2017 to 2021
    13.3. Current and Future Market Size (US$ Million) Analysis and Forecast by Region, 2022 to 2032
        13.3.1. North America
        13.3.2. Latin America
        13.3.3. Europe
        13.3.4. South Asia
        13.3.5. East Asia
        13.3.6. Oceania
        13.3.7. Middle East & Africa
    13.4. Market Attractiveness Analysis by Region
14. North America Market Analysis 2017 to 2021 and Forecast 2022 to 2032
    14.1. Introduction
    14.2. Historical Market Size (US$ Million) and Volume (Units) Analysis by Market Taxonomy, 2017 to 2021
    14.3. Current and Future Market Size (US$ Million) and Volume (Units) Analysis and Forecast by Market Taxonomy, 2022 to 2032
        14.3.1. By Country
            14.3.1.1. United States of America
            14.3.1.2. Canada
        14.3.2. By Product
        14.3.3. By Application
        14.3.4. By End User
    14.4. Market Attractiveness Analysis
        14.4.1. By Product
        14.4.2. By Application
        14.4.3. By End User
    14.5. Market Trends
    14.6. Key Market Participants - Intensity Mapping
    14.7. Drivers and Restraints - Impact Analysis
    14.8. Country-Level Analysis & Forecast
        14.8.1. USA Market
            14.8.1.1. Introduction
            14.8.1.2. Market Analysis and Forecast by Market Taxonomy
                14.8.1.2.1. By Product
                14.8.1.2.2. By Application
                14.8.1.2.3. By End User
        14.8.2. Canada Market
        14.8.3. Introduction
        14.8.4. Market Analysis and Forecast by Market Taxonomy
                14.8.4.1.1. By Product
                14.8.4.1.2. By Application
                14.8.4.1.3. By End User
15. Latin America Market Analysis 2017 to 2021 and Forecast 2022 to 2032
    15.1. Introduction
    15.2. Historical Market Size (US$ Million) and Volume (Units) Analysis by Market Taxonomy, 2017 to 2021
    15.3. Current and Future Market Size (US$ Million) and Volume (Units) Analysis and Forecast by Market Taxonomy, 2022 to 2032
        15.3.1. By Country
            15.3.1.1. Mexico
            15.3.1.2. Brazil
            15.3.1.3. Argentina
            15.3.1.4. Rest of Latin America
        15.3.2. By Product
        15.3.3. By Application
        15.3.4. By End User
    15.4. Market Attractiveness Analysis
        15.4.1. By Product
        15.4.2. By Application
        15.4.3. By End User
    15.5. Market Trends
    15.6. Key Market Participants - Intensity Mapping
    15.7. Drivers and Restraints - Impact Analysis
    15.8. Country-Level Analysis & Forecast
        15.8.1. Mexico Market
            15.8.1.1. Introduction
            15.8.1.2. Market Analysis and Forecast by Market Taxonomy
                15.8.1.2.1. By Product
                15.8.1.2.2. By Application
                15.8.1.2.3. By End User
        15.8.2. Brazil Market
            15.8.2.1. Introduction
            15.8.2.2. Market Analysis and Forecast by Market Taxonomy
                15.8.2.2.1. By Product
                15.8.2.2.2. By Application
                15.8.2.2.3. By End User
        15.8.3. Argentina Market
        15.8.4. Introduction
        15.8.5. Market Analysis and Forecast by Market Taxonomy
                15.8.5.1.1. By Product
                15.8.5.1.2. By Application
                15.8.5.1.3. By End User
16. Europe Market Analysis 2017 to 2021 and Forecast 2022 to 2032
    16.1. Introduction
    16.2. Historical Market Size (US$ Million) and Volume (Units) Analysis by Market Taxonomy, 2017 to 2021
    16.3. Current and Future Market Size (US$ Million) and Volume (Units) Analysis and Forecast by Market Taxonomy, 2022 to 2032
        16.3.1. By Country
            16.3.1.1. United Kingdom
            16.3.1.2. Germany
            16.3.1.3. Italy
            16.3.1.4. France
            16.3.1.5. Spain
            16.3.1.6. Russia
            16.3.1.7. BENELUX
            16.3.1.8. Rest of Europe
        16.3.2. By Product
    16.4. Market Attractiveness Analysis
        16.4.1. By Product
        16.4.2. By Application
        16.4.3. By End User
    16.5. Market Trends
    16.6. Key Market Participants - Intensity Mapping
    16.7. Drivers and Restraints - Impact Analysis
    16.8. Country-Level Analysis & Forecast
        16.8.1. UK Market
            16.8.1.1. Introduction
            16.8.1.2. Market Analysis and Forecast by Market Taxonomy
                16.8.1.2.1. By Product
                16.8.1.2.2. By Application
                16.8.1.2.3. By End User
        16.8.2. Germany Market
            16.8.2.1. Introduction
            16.8.2.2. Market Analysis and Forecast by Market Taxonomy
                16.8.2.2.1. By Product
                16.8.2.2.2. By Application
                16.8.2.2.3. By End User
        16.8.3. Italy Market
            16.8.3.1. Introduction
            16.8.3.2. Market Analysis and Forecast by Market Taxonomy
                16.8.3.2.1. By Product
                16.8.3.2.2. By Application
                16.8.3.2.3. By End User
        16.8.4. France Market
            16.8.4.1. Introduction
            16.8.4.2. Market Analysis and Forecast by Market Taxonomy
                16.8.4.2.1. By Product
                16.8.4.2.2. By Application
                16.8.4.2.3. By End User
        16.8.5. Spain Market
            16.8.5.1. Introduction
            16.8.5.2. Market Analysis and Forecast by Market Taxonomy
                16.8.5.2.1. By Product
                16.8.5.2.2. By Application
                16.8.5.2.3. By End User
        16.8.6. Benelux Market
            16.8.6.1. Introduction
            16.8.6.2. Market Analysis and Forecast by Market Taxonomy
                16.8.6.2.1. By Product
                16.8.6.2.2. By Application
                16.8.6.2.3. By End User
        16.8.7. Russia Market
            16.8.7.1. Introduction
            16.8.7.2. Market Analysis and Forecast by Market Taxonomy
                16.8.7.2.1. By Product
                16.8.7.2.2. By Application
                16.8.7.2.3. By End User
17. East Asia Market Analysis 2017 to 2021 and Forecast 2022 to 2032
    17.1. Introduction
    17.2. Historical Market Size (US$ Million) and Volume (Units) Analysis by Market Taxonomy, 2017 to 2021
    17.3. Current and Future Market Size (US$ Million) and Volume (Units) Analysis and Forecast by Market Taxonomy, 2022 to 2032
        17.3.1. By Country
            17.3.1.1. China
            17.3.1.2. Japan
            17.3.1.3. South Korea
        17.3.2. By Product
        17.3.3. By Application
        17.3.4. By End User
    17.4. Market Attractiveness Analysis
        17.4.1. By Product
        17.4.2. By Application
        17.4.3. By End User
    17.5. Market Trends
    17.6. Key Market Participants - Intensity Mapping
    17.7. Drivers and Restraints - Impact Analysis
    17.8. Country-Level Analysis & Forecast
        17.8.1. China Market
            17.8.1.1. Introduction
            17.8.1.2. Market Analysis and Forecast by Market Taxonomy
                17.8.1.2.1. By Product
                17.8.1.2.2. By Application
                17.8.1.2.3. By End User
        17.8.2. Japan Market
            17.8.2.1. Introduction
            17.8.2.2. Market Analysis and Forecast by Market Taxonomy
                17.8.2.2.1. By Product
                17.8.2.2.2. By Application
                17.8.2.2.3. By End User
        17.8.3. South Korea Market
            17.8.3.1. Introduction
            17.8.3.2. Market Analysis and Forecast by Market Taxonomy
                17.8.3.2.1. By Product
                17.8.3.2.2. By Application
                17.8.3.2.3. By End User
18. South Asia Market Analysis 2017 to 2021 and Forecast 2022 to 2032
    18.1. Introduction
    18.2. Historical Market Size (US$ Million) and Volume (Units) Analysis by Market Taxonomy, 2017 to 2021
    18.3. Current and Future Market Size (US$ Million) and Volume (Units) Analysis and Forecast by Market Taxonomy, 2022 to 2032
        18.3.1. By Country
            18.3.1.1. India
            18.3.1.2. Indonesia
            18.3.1.3. Malaysia
            18.3.1.4. Thailand
            18.3.1.5. Rest of South Asia
        18.3.2. By Product
        18.3.3. By Application
        18.3.4. By End User
    18.4. Market Attractiveness Analysis
        18.4.1. By Product
        18.4.2. By Application
        18.4.3. By End User
    18.5. Market Trends
    18.6. Key Market Participants - Intensity Mapping
    18.7. Drivers and Restraints - Impact Analysis
    18.8. Country-Level Analysis & Forecast
        18.8.1. India Market
            18.8.1.1. Introduction
            18.8.1.2. Market Analysis and Forecast by Market Taxonomy
                18.8.1.2.1. By Product
                18.8.1.2.2. By Application
                18.8.1.2.3. By End User
        18.8.2. Indonesia Market
            18.8.2.1. Introduction
            18.8.2.2. Market Analysis and Forecast by Market Taxonomy
                18.8.2.2.1. By Product
                18.8.2.2.2. By Application
                18.8.2.2.3. By End User
        18.8.3. Malaysia Market
            18.8.3.1. Introduction
            18.8.3.2. Market Analysis and Forecast by Market Taxonomy
                18.8.3.2.1. By Product
                18.8.3.2.2. By Application
                18.8.3.2.3. By End User
        18.8.4. Thailand Market
            18.8.4.1. Introduction
            18.8.4.2. Market Analysis and Forecast by Market Taxonomy
                18.8.4.2.1. By Product
                18.8.4.2.2. By Application
                18.8.4.2.3. By End User
19. Oceania Market Analysis 2017 to 2021 and Forecast 2022 to 2032
    19.1. Introduction
    19.2. Historical Market Size (US$ Million) and Volume (Units) Analysis by Market Taxonomy, 2017 to 2021
    19.3. Current and Future Market Size (US$ Million) and Volume (Units) Analysis and Forecast by Market Taxonomy, 2022 to 2032
        19.3.1. By Country
            19.3.1.1. Australia
            19.3.1.2. New Zealand
        19.3.2. By Product
        19.3.3. By Application
        19.3.4. By End User
    19.4. Market Attractiveness Analysis
        19.4.1. By Product
        19.4.2. By Application
        19.4.3. By End User
    19.5. Market Trends
    19.6. Key Market Participants - Intensity Mapping
    19.7. Drivers and Restraints - Impact Analysis
    19.8. Country-Level Analysis & Forecast
        19.8.1. Australia Market
            19.8.1.1. Introduction
            19.8.1.2. Market Analysis and Forecast by Market Taxonomy
                19.8.1.2.1. By Product
                19.8.1.2.2. By Application
                19.8.1.2.3. By End User
        19.8.2. New Zealand Market
            19.8.2.1. Introduction
            19.8.2.2. Market Analysis and Forecast by Market Taxonomy
                19.8.2.2.1. By Product
                19.8.2.2.2. By Application
                19.8.2.2.3. By End User
20. Middle East and Africa Market Analysis 2017 to 2021 and Forecast 2022 to 2032
    20.1. Introduction
    20.2. Historical Market Size (US$ Million) and Volume (Units) Analysis by Market Taxonomy, 2017 to 2021
    20.3. Current and Future Market Size (US$ Million) and Volume (Units) Analysis and Forecast by Market Taxonomy, 2022 to 2032
        20.3.1. By Country
            20.3.1.1. GCC Countries
            20.3.1.2. Turkey
            20.3.1.3. South Africa
            20.3.1.4. North Africa
            20.3.1.5. Rest of Middle East and Africa
        20.3.2. By Product
        20.3.3. By Application
        20.3.4. By End User
    20.4. Market Attractiveness Analysis
        20.4.1. By Product
        20.4.2. By Application
        20.4.3. By End User
    20.5. Market Trends
    20.6. Key Market Participants - Intensity Mapping
    20.7. Drivers and Restraints - Impact Analysis
    20.8. Country-Level Analysis & Forecast
        20.8.1. GCC Countries Market
            20.8.1.1. Introduction
            20.8.1.2. Market Analysis and Forecast by Market Taxonomy
                20.8.1.2.1. By Product
                20.8.1.2.2. By Application
                20.8.1.2.3. By End User
        20.8.2. Turkey Market
            20.8.2.1. Introduction
            20.8.2.2. Market Analysis and Forecast by Market Taxonomy
                20.8.2.2.1. By Product
                20.8.2.2.2. By Application
                20.8.2.2.3. By End User
        20.8.3. South Africa Market
            20.8.3.1. Introduction
            20.8.3.2. Market Analysis and Forecast by Market Taxonomy
                20.8.3.2.1. By Product
                20.8.3.2.2. By Application
                20.8.3.2.3. By End User
        20.8.4. North Africa Market
            20.8.4.1. Introduction
            20.8.4.2. Market Analysis and Forecast by Market Taxonomy
                20.8.4.2.1. By Product
                20.8.4.2.2. By Application
                20.8.4.2.3. By End User
21. Market Structure Analysis
    21.1. Market Analysis by Tier of Companies
    21.2. Market Share Analysis of Top Players
    21.3. Market Presence Analysis
        21.3.1. Regional Footprint by Players
        21.3.2. Product Footprint by Players
        21.3.3. Channel Foot Print by Players
22. Competition Analysis
    22.1. Competition Dashboard
    22.2. Competition Benchmarking
    22.3. Competition Deep Dive
        22.3.1. 3M Company
            22.3.1.1. Overview
            22.3.1.2. Product Portfolio
            22.3.1.3. Sales Footprint
            22.3.1.4. Key Financials
            22.3.1.5. SWOT Analysis
            22.3.1.6. Strategy Overview
                22.3.1.6.1. Marketing Strategy
                22.3.1.6.2. Product Strategy
                22.3.1.6.3. Channel Strategy
        22.3.2. 3M Company
            22.3.2.1. Overview
            22.3.2.2. Product Portfolio
            22.3.2.3. Sales Footprint
            22.3.2.4. Key Financials
            22.3.2.5. SWOT Analysis
            22.3.2.6. Strategy Overview
                22.3.2.6.1. Marketing Strategy
                22.3.2.6.2. Product Strategy
                22.3.2.6.3. Channel Strategy
        22.3.3. BD
            22.3.3.1. Overview
            22.3.3.2. Product Portfolio
            22.3.3.3. Sales Footprint
            22.3.3.4. Key Financials
            22.3.3.5. SWOT Analysis
            22.3.3.6. Strategy Overview
                22.3.3.6.1. Marketing Strategy
                22.3.3.6.2. Product Strategy
                22.3.3.6.3. Channel Strategy
        22.3.4. The 37 Company
            22.3.4.1. Overview
            22.3.4.2. Product Portfolio
            22.3.4.3. Sales Footprint
            22.3.4.4. Key Financials
            22.3.4.5. SWOT Analysis
            22.3.4.6. Strategy Overview
                22.3.4.6.1. Marketing Strategy
                22.3.4.6.2. Product Strategy
                22.3.4.6.3. Channel Strategy
        22.3.5. Emit Corporation
            22.3.5.1. Overview
            22.3.5.2. Product Portfolio
            22.3.5.3. Sales Footprint
            22.3.5.4. Key Financials
            22.3.5.5. SWOT Analysis
            22.3.5.6. Strategy Overview
                22.3.5.6.1. Marketing Strategy
                22.3.5.6.2. Product Strategy
                22.3.5.6.3. Channel Strategy
        22.3.6. GE Healthcare
            22.3.6.1. Overview
            22.3.6.2. Product Portfolio
            22.3.6.3. Sales Footprint
            22.3.6.4. Key Financials
            22.3.6.5. SWOT Analysis
            22.3.6.6. Strategy Overview
                22.3.6.6.1. Marketing Strategy
                22.3.6.6.2. Product Strategy
                22.3.6.6.3. Channel Strategy
        22.3.7. Stryker Corporation
            22.3.7.1. Overview
            22.3.7.2. Product Portfolio
            22.3.7.3. Sales Footprint
            22.3.7.4. Key Financials
            22.3.7.5. SWOT Analysis
            22.3.7.6. Strategy Overview
                22.3.7.6.1. Marketing Strategy
                22.3.7.6.2. Product Strategy
                22.3.7.6.3. Channel Strategy
        22.3.8. Barkey GmbH & Co. KG
            22.3.8.1. Overview
            22.3.8.2. Product Portfolio
            22.3.8.3. Sales Footprint
            22.3.8.4. Key Financials
            22.3.8.5. SWOT Analysis
            22.3.8.6. Strategy Overview
                22.3.8.6.1. Marketing Strategy
                22.3.8.6.2. Product Strategy
                22.3.8.6.3. Channel Strategy
        22.3.9. Geratherm Medical
            22.3.9.1. Overview
            22.3.9.2. Product Portfolio
            22.3.9.3. Sales Footprint
            22.3.9.4. Key Financials
            22.3.9.5. SWOT Analysis
            22.3.9.6. Strategy Overview
                22.3.9.6.1. Marketing Strategy
                22.3.9.6.2. Product Strategy
                22.3.9.6.3. Channel Strategy
        22.3.10. Stihler Electronic GmbH
            22.3.10.1. Overview
            22.3.10.2. Product Portfolio
            22.3.10.3. Sales Footprint
            22.3.10.4. Key Financials
            22.3.10.5. SWOT Analysis
            22.3.10.6. Strategy Overview
                22.3.10.6.1. Marketing Strategy
                22.3.10.6.2. Product Strategy
                22.3.10.6.3. Channel Strategy
        22.3.11. Belmont Instrument
            22.3.11.1. Overview
            22.3.11.2. Product Portfolio
            22.3.11.3. Sales Footprint
            22.3.11.4. Key Financials
            22.3.11.5. SWOT Analysis
            22.3.11.6. Strategy Overview
                22.3.11.6.1. Marketing Strategy
                22.3.11.6.2. Product Strategy
                22.3.11.6.3. Channel Strategy
        22.3.12. Biegler GmbH
            22.3.12.1. Overview
            22.3.12.2. Product Portfolio
            22.3.12.3. Sales Footprint
            22.3.12.4. Key Financials
            22.3.12.5. SWOT Analysis
            22.3.12.6. Strategy Overview
                22.3.12.6.1. Marketing Strategy
                22.3.12.6.2. Product Strategy
                22.3.12.6.3. Channel Strategy
        22.3.13. Baxter International Inc. (Gambro)
            22.3.13.1. Overview
            22.3.13.2. Product Portfolio
            22.3.13.3. Sales Footprint
            22.3.13.4. Key Financials
            22.3.13.5. SWOT Analysis
            22.3.13.6. Strategy Overview
                22.3.13.6.1. Marketing Strategy
                22.3.13.6.2. Product Strategy
                22.3.13.6.3. Channel Strategy
        22.3.14. Keewell Medical Technology Co. Ltd.
            22.3.14.1. Overview
            22.3.14.2. Product Portfolio
            22.3.14.3. Sales Footprint
            22.3.14.4. Key Financials
            22.3.14.5. SWOT Analysis
            22.3.14.6. Strategy Overview
                22.3.14.6.1. Marketing Strategy
                22.3.14.6.2. Product Strategy
                22.3.14.6.3. Channel Strategy
        22.3.15. ICU Medical Inc. (Smiths Medical)
            22.3.15.1. Overview
            22.3.15.2. Product Portfolio
            22.3.15.3. Sales Footprint
            22.3.15.4. Key Financials
            22.3.15.5. SWOT Analysis
            22.3.15.6. Strategy Overview
                22.3.15.6.1. Marketing Strategy
                22.3.15.6.2. Product Strategy
                22.3.15.6.3. Channel Strategy
        22.3.16. Vyaire Medical, Inc.,
            22.3.16.1. Overview
            22.3.16.2. Product Portfolio
            22.3.16.3. Sales Footprint
            22.3.16.4. Key Financials
            22.3.16.5. SWOT Analysis
            22.3.16.6. Strategy Overview
                22.3.16.6.1. Marketing Strategy
                22.3.16.6.2. Product Strategy
                22.3.16.6.3. Channel Strategy
        22.3.17. The Surgical Company
            22.3.17.1. Overview
            22.3.17.2. Product Portfolio
            22.3.17.3. Sales Footprint
            22.3.17.4. Key Financials
            22.3.17.5. SWOT Analysis
            22.3.17.6. Strategy Overview
                22.3.17.6.1. Marketing Strategy
                22.3.17.6.2. Product Strategy
                22.3.17.6.3. Channel Strategy
        22.3.18. Life Warmer
            22.3.18.1. Overview
            22.3.18.2. Product Portfolio
            22.3.18.3. Sales Footprint
            22.3.18.4. Key Financials
            22.3.18.5. SWOT Analysis
            22.3.18.6. Strategy Overview
                22.3.18.6.1. Marketing Strategy
                22.3.18.6.2. Product Strategy
                22.3.18.6.3. Channel Strategy
        22.3.19. MEQU
            22.3.19.1. Overview
            22.3.19.2. Product Portfolio
            22.3.19.3. Sales Footprint
            22.3.19.4. Key Financials
            22.3.19.5. SWOT Analysis
            22.3.19.6. Strategy Overview
                22.3.19.6.1. Marketing Strategy
                22.3.19.6.2. Product Strategy
                22.3.19.6.3. Channel Strategy
        22.3.20. Estill Medical Technologies, Inc.
            22.3.20.1. Overview
            22.3.20.2. Product Portfolio
            22.3.20.3. Sales Footprint
            22.3.20.4. Key Financials
            22.3.20.5. SWOT Analysis
            22.3.20.6. Strategy Overview
                22.3.20.6.1. Marketing Strategy
                22.3.20.6.2. Product Strategy
                22.3.20.6.3. Channel Strategy
        22.3.21. Smisson-Cartledge Biomedical
            22.3.21.1. Overview
            22.3.21.2. Product Portfolio
            22.3.21.3. Sales Footprint
            22.3.21.4. Key Financials
            22.3.21.5. SWOT Analysis
            22.3.21.6. Strategy Overview
                22.3.21.6.1. Marketing Strategy
                22.3.21.6.2. Product Strategy
                22.3.21.6.3. Channel Strategy
23. Assumptions and Acronyms Used
24. Research Methodology
Recommendations

Healthcare

Blood Cancer Treatment Market

July 2023

REP-GB-1425

339 pages

Healthcare

Blood Fluid Warming System Market

July 2023

REP-GB-1750

317 pages

Healthcare

Portable Medical Devices Market

February 2023

REP-GB-404

313 pages

Explore Healthcare Insights

View Reports
Future Market Insights

Blood Warmer Devices Market

Schedule a Call