Bio-wax Market Size and Share Forecast Outlook 2025 to 2035

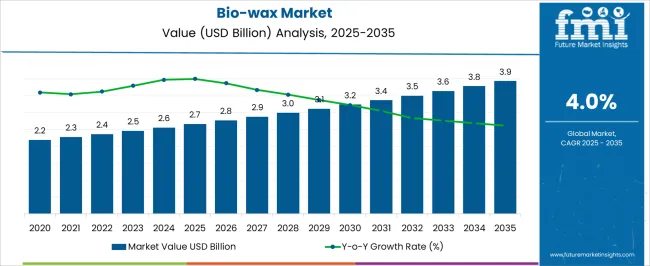
The Bio-wax Market is estimated to be valued at USD 2.7 billion in 2025 and is projected to reach USD 3.9 billion by 2035, registering a compound annual growth rate (CAGR) of 4.0% over the forecast period.

The bio-wax market is experiencing robust expansion driven by growing consumer preference for sustainable, biodegradable, and naturally derived materials. Increasing demand from personal care, pharmaceuticals, and packaging industries is shaping the market’s growth trajectory. Regulatory encouragement for eco-friendly alternatives and corporate commitments toward carbon reduction have accelerated adoption of bio-based waxes.

Current dynamics reflect a structural shift from petroleum-derived products toward renewable feedstocks. Advancements in extraction and refining technologies have improved product purity, performance, and cost efficiency, enhancing the competitiveness of bio-wax in commercial formulations.

The future outlook indicates continued market penetration, supported by consistent innovation in formulation flexibility and scalability of production Growth rationale is anchored on the alignment of bio-wax with global sustainability goals, its functional versatility across multiple end-use sectors, and the expanding base of manufacturers investing in circular and low-impact material solutions that ensure long-term market stability and profitability.

Quick Stats for Bio-wax Market

  • Bio-wax Market Industry Value (2025): USD 2.7 billion
  • Bio-wax Market Forecast Value (2035): USD 3.9 billion
  • Bio-wax Market Forecast CAGR: 4.0%
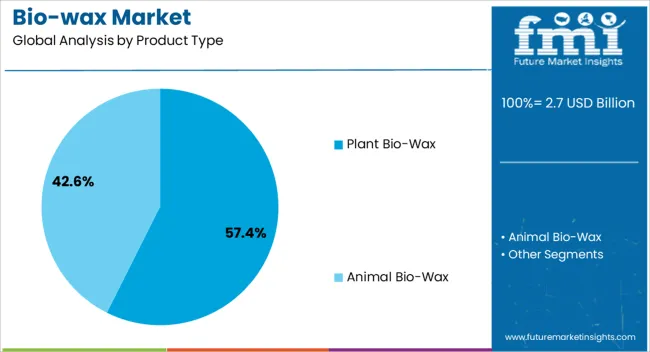
  • Leading Segment in Bio-wax Market in 2025: Plant Bio-Wax (57.4%)
  • Key Growth Region in Bio-wax Market: North America, Asia-Pacific, Europe
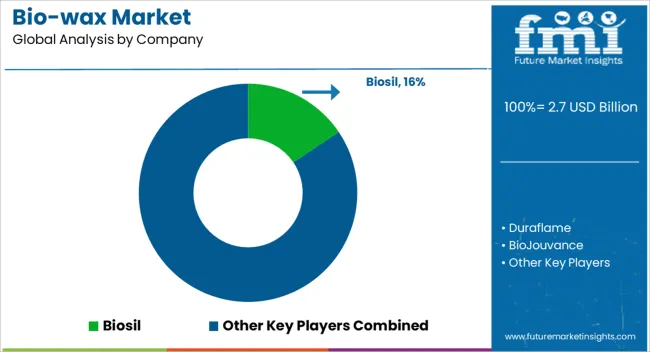
  • Top Key Players in Bio-wax Market: Biosil, Duraflame, BioJouvance, Fisch, Remmers, Chant Oil Co. Ltd.

Bio Wax Market Market Value Analysis

Metric Value
Bio-wax Market Estimated Value in (2025 E) USD 2.7 billion
Bio-wax Market Forecast Value in (2035 F) USD 3.9 billion
Forecast CAGR (2025 to 2035) 4.0%

Segmental Analysis

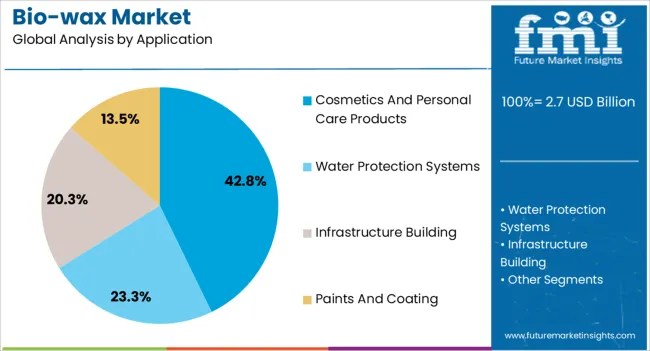
The market is segmented by Product Type and Application and region. By Product Type, the market is divided into Plant Bio-Wax and Animal Bio-Wax. In terms of Application, the market is classified into Cosmetics And Personal Care Products, Water Protection Systems, Infrastructure Building, and Paints And Coating. Regionally, the market is classified into North America, Latin America, Western Europe, Eastern Europe, Balkan & Baltic Countries, Russia & Belarus, Central Asia, East Asia, South Asia & Pacific, and the Middle East & Africa.
Insights into the Product Type Segment

Bio Wax Market Analysis By Product Type

The plant bio-wax segment, representing 57.40% of the product type category, has maintained its leadership position due to abundant availability of plant-derived raw materials and favorable production economics. Its dominance is being reinforced by its superior biodegradability, non-toxicity, and compatibility with cosmetic and pharmaceutical formulations.

Consistent demand from industries seeking sustainable alternatives to synthetic waxes has strengthened its market position. Processing advancements have improved yield and purity, enhancing end-product performance.

Global brands have been incorporating plant bio-wax in product lines to meet regulatory and consumer expectations for natural ingredients Market growth is also supported by steady technological progress in refining processes, which ensures stability and extended shelf life, making plant bio-wax a preferred choice for both industrial and premium product applications.

Insights into the Application Segment

Bio Wax Market Analysis By Application

The cosmetics and personal care products segment, accounting for 42.80% of the application category, has been leading due to strong integration of bio-wax in formulations such as lip balms, lotions, and creams. Its application has expanded owing to its emulsifying properties, moisture retention capabilities, and smooth texture that enhance product performance.

Rising consumer demand for natural and vegan cosmetics has significantly boosted segment growth. Regulatory initiatives promoting sustainable ingredients and increasing brand transparency have further driven adoption.

Manufacturers are leveraging bio-wax’s multifunctionality to replace synthetic and animal-derived waxes without compromising product quality Continued product innovation, branding strategies emphasizing sustainability, and expansion in premium cosmetic ranges are expected to sustain the segment’s market share and strengthen its contribution to overall bio-wax market growth.

2020 to 2025 Global Bio-wax Sales Analysis Compared to Demand Forecast for 2025 to 2035

Global bio wax sales increased at a CAGR of 3.3% between 2020 to 2025. Total industry size at the end of 2025 reached USD 2476.8 million. This high growth was fueled by rising awareness regarding the harmful effects of synthetic waxes and the shift towards eco-friendly alternatives.

Climate change led to the adoption of sustainable processes that lowered the environmental footprint of companies, thereby catering to environmental conscious consumers. Bio-based wax allowed producers to formulate products with a sustainable profile, thereby driving growth.

There was also a growing demand for natural and organic cosmetics and bio waxes offered the desired functionalities while aligning with the clean beauty movement. Advances in research for bio-based wax production further opened the door for more sustainable and potentially cost-competitive wax options during the historical period.

The global sector is witnessing robust growth and the trend is likely to persist through 2035. With a projected CAGR of 4%, the industry is estimated to reach USD 3.9 million by 2035. A leading factor behind the growth of the sector is rapid expansion of feedstock options.

The sector is moving beyond traditional sources and exploring alternative options like algae oil or insect fats to enhance sustainability. These are potentially reduce the reliance on agricultural land for bio wax production.

Technological advancements are being made to further create progress in the sector. Integration of biotechnology through fermentation processes and enzyme technology can streamline bio-based wax, potentially improving efficiency and reducing costs.

The sector is expected to progressively find new applications in various sectors that hold promise for future growth, thereby providing opportunities for bio-wax producers in emerging markets. Regulations related to bio-based products and sustainability are expected to continue evolving. Companies that can adapt production processes and demonstrate the environmental benefits of bio waxes will be well positioned in the sector.

Country-wise Insights

The section below depicts the bio wax market share and size across various countries. The section evaluates the latest trends of the industry in leading countries. India and China have emerged as the prominent countries in the sector and are estimated to experience considerable CAGRs of 6% and 4.5%, respectively, through 2035.

The regional analysis of the sector is also presented for companies to determine the key locations for investment. The full report contains detailed information on the current trends, growth drives, and challenges in the industry.

The sector is experiencing robust growth in various countries. This growth is attributed to factors including rising environmental concerns resulting in a shift towards sustainable and renewable products. High versatility, government initiatives, and continuous research and development efforts by leading players in the industry also play a significant role in the expansion of the market.

Countries CAGR 2025 to 2035
United States 2.2%
Germany 1.9%
China 4.5%
Japan 1.7%
India 6%

India’s Large Workforce Propelling Growth of the Industry

India is emerging as the dominant sector with an estimated CAGR of 6% during the forecast period from 2025 to 2035. This is attributed to changing bio wax market trends and the vast production of oilseed crops such as castor, rapeseed, and mustard in the country. These crops are considered the potential feedstock for bio-based wax production.

Demand for cosmetics and personal care products is rapidly increasing in the country, leading to a significant expansion of the sector. Bio-based waxes have emerged as a popular choice in the cosmetics sector owing to natural and sustainable properties, which is contributing to growth.

Another key factor for the advancement of the sector in India is the availability of low-cost labor. The country has a large workforce that can potentially contribute to cost-competitive production of bio-based waxes compared to other developed countries. Abundant availability of natural resources coupled with the availability of workforce and government norms facilitates growth of the sector.

China’s Robust Infrastructure Plays a Crucial Role in Bolstering the Industry

China’s bio wax sector is projected to grow at a CAGR of 4.5% through the forecast period from 2025 to 2035. The country has a well-established chemical industry and with a strong infrastructure for large-scale production that can be adopted for the manufacturing of wax products.

The country also has a huge workforce, mainly in the chemical and manufacturing sectors that can be efficiently trained and employed in bio-based wax production facilities. China is heavily investing in research and development of bio-based products.

The country has launched initiatives to promote the development of a bio-based economy, thereby encouraging the production and utilization of bio-based products. Owing to these initiatives, China-based companies have easier access to capital for investing in wax production facilities and technology compared to other nations.

There is also a rise in disposable income due to the growing middle-class population demanding high-quality consumer goods. These goods include cosmetics and personal care products. Expansion of sectors of products that utilizes bio-based wax, such as food packaging, coatings, candles, and other industrial products, is set to result in the progressive growth of China.

Canada’s Vast Agricultural Lands to Facilitate the Supply of Potential Feedstock

Canada has a strong potential for future growth in the bio-wax industry. The country is expected to grow at a CAGR of 2.4% between the assessment period of 2025 to 2035. Canada has a vast agricultural land, which is boasting a strong agricultural sector that translates into a readily available supply of potential feedstock for wax production.

The country’s government prioritizes environmental sustainability and aims to reduce reliance on fossil fuels. Being a renewable and eco-friendly alternative, bio-based wax aligns with these goals. Government support through funding for research and development, policies, and incentives for bio-based product manufacturers can greatly benefit the industry.

Category-wise Insights

The section provides information regarding the leading segments in the bio-wax industry. The sectipon has details regarding the anticipated growth rates that will help companies identify the dominating sectors and invest accordingly.

Based on product type, the plant segment is leading with a market share of 62.8% in 2025. By application, the cosmetics and personal care products segment is dominating the industry with a value share of 38.5% in 2025.

Government Incentives Paving the Way for Increased Demand of Plant-based Wax

Segment Plant Bio-wax (Product Type)
Value Share (2025) 62.8%

The plant segment accounted for a value share of 62.8% in 2025, owing to sustainable profile amid rising environmental concerns. Being derived from readily available and renewable resources like vegetable oils, the product aligns with the surging demand for sustainable and eco-friendly products.

Plant-based waxes can be easily formulated based on requirements, thereby achieving functionality for various uses. These can even be tailored to have different hardness levels, viscosities, and melting points.

High compatibility with other natural ingredients and certain synthetic components allows for easy blending and customization to achieve the desired functionalities in the final product. Manufacturers prefer plant-based products as these have cost-effective production methods due to the established technologies and processes for extracting and refining waxes from vegetable oils.

Government regulations in favor of the use of bio-based products are further improving popularity and production. These regulations include subsidies for companies using plant-based waxes or tax breaks.

Clean Beauty Movement Driving Demand in Cosmetics and Personal Care Products

Segment Cosmetics and Personal Care Products (Application)
Value Share (2025) 38.5%

Based on application, the cosmetics and personal care products segment is witnessing significant growth, with a value share of 38.5% in 2025. This dominance is attributed to several functional benefits, which include emollient properties and film-forming ability.

Bio waxes offer a wide range of textures and consistencies, allowing manufacturers to create a variety of cosmetic products. A few types of waxes help soften and moisturize the skin, adding to the sensory experience. These often act as thickening agents in products and provide structure to lipsticks and balms, enhancing the spreadability of ointments.

A key driver of the industry is non-toxic and hypoallergenic nature, which makes the wax suitable for sensitive skin types. Bio-based waxes are biodegradable, perfectly aligning with the increasing focus on sustainability and the clean beauty movement worldwide. These also have a lower environmental footprint compared to petroleum-based waxes.

Bio-based waxes are versatile and compatible, thereby offering a luxurious feel and natural sheen to cosmetic products. These are anticipated to further enhance visual appeal, raising demand.
Competition Outlook

Bio Wax Market Analysis By Company

The bio-based wax market is expected to experience steady growth throughout the forecast period. Key players are investing in research and development to create new waxes that have wide applications and functionalities.

While the market is dominated by established brands, many new entrants are progressively strengthening positions, especially those from emerging economies with abundant renewable resources. The competitive landscape of the bio wax market is challenging and will evolve according to industry trends.

A key challenge for bio-wax manufacturers is achieving cost parity with traditional waxes. Brands that can succeed in optimizing production processes along with lowering prices of products will have a competitive edge in the market.

Increasing awareness of sustainability is a key trend with a potential to drive growth in the market. Both consumers and businesses are progressively seeking eco-friendly alternatives for petroleum-based waxes. As a result, companies capable of providing sustainable solutions such as bio-based waxes from renewable resources like vegetable oil are poised to experience growth.

Technological advancements are driving the market. These include tailoring the molecular structure of bio waxes to achieve specific functionalities. This can lead to improved hardness, melting points, and high compatibility with other ingredients.

Industry Updates

  • In April 2025, Upwell Cosmetics, based in the United States, introduced a new revolutionary algae-derived wax that can replace harmful petroleum in cosmetics and personal care products.
  • In October 2025, Emulco Ghent Seaport N.V., headquartered in Belgium, developed AquaVeg bio-wax emulsions. The new product is ideal for eco-building and is mainly targeted at the panel board sector.

Leading Bio-wax Brands

  • Biosil
  • Duraflame
  • BioJouvance
  • Fisch
  • Remmers
  • Chant Oil Co. Ltd.

Key Segments of Market Report

By Product Type:

The bio-wax industry is segmented into animal and plant bio-wax based on product type.

By Application:

Based on application, the industry is distributed in bio wax for cosmetics and personal care products, water protection systems, infrastructure building, and paints and coating.

By Region:

Details of key countries across North America, Latin America, East Asia, South Asia and Pacific, Western Europe, Eastern Europe, and the Middle East and Africa is given.

Frequently Asked Questions

How big is the bio-wax market in 2025?

The global bio-wax market is estimated to be valued at USD 2.7 billion in 2025.

What will be the size of bio-wax market in 2035?

The market size for the bio-wax market is projected to reach USD 3.9 billion by 2035.

How much will be the bio-wax market growth between 2025 and 2035?

The bio-wax market is expected to grow at a 4.0% CAGR between 2025 and 2035.

What are the key product types in the bio-wax market?

The key product types in bio-wax market are plant bio-wax and animal bio-wax.

Which application segment to contribute significant share in the bio-wax market in 2025?

In terms of application, cosmetics and personal care products segment to command 42.8% share in the bio-wax market in 2025.

Table of Content

  1. Executive Summary
    • Global Market Outlook
    • Demand-side Trends
    • Supply-side Trends
    • Technology Roadmap Analysis
    • Analysis and Recommendations
  2. Market Overview
    • Market Coverage / Taxonomy
    • Market Definition / Scope / Limitations
  3. Market Background
    • Market Dynamics
      • Drivers
      • Restraints
      • Opportunity
      • Trends
    • Scenario Forecast
      • Demand in Optimistic Scenario
      • Demand in Likely Scenario
      • Demand in Conservative Scenario
    • Opportunity Map Analysis
    • Product Life Cycle Analysis
    • Supply Chain Analysis
    • Investment Feasibility Matrix
    • Value Chain Analysis
    • PESTLE and Porter’s Analysis
    • Regulatory Landscape
    • Regional Parent Market Outlook
    • Production and Consumption Statistics
    • Import and Export Statistics
  4. Global Market Analysis 2020 to 2024 and Forecast, 2025 to 2035
    • Historical Market Size Value (USD Million) Analysis, 2020 to 2024
    • Current and Future Market Size Value (USD Million) Projections, 2025 to 2035
      • Y-o-Y Growth Trend Analysis
      • Absolute $ Opportunity Analysis
  5. Global Market Pricing Analysis 2020 to 2024 and Forecast 2025 to 2035
  6. Global Market Analysis 2020 to 2024 and Forecast 2025 to 2035, By Product Type
    • Introduction / Key Findings
    • Historical Market Size Value (USD Million) Analysis By Product Type , 2020 to 2024
    • Current and Future Market Size Value (USD Million) Analysis and Forecast By Product Type , 2025 to 2035
      • Plant Bio-Wax
      • Animal Bio-Wax
    • Y-o-Y Growth Trend Analysis By Product Type , 2020 to 2024
    • Absolute $ Opportunity Analysis By Product Type , 2025 to 2035
  7. Global Market Analysis 2020 to 2024 and Forecast 2025 to 2035, By Application
    • Introduction / Key Findings
    • Historical Market Size Value (USD Million) Analysis By Application, 2020 to 2024
    • Current and Future Market Size Value (USD Million) Analysis and Forecast By Application, 2025 to 2035
      • Cosmetics And Personal Care Products
      • Water Protection Systems
      • Infrastructure Building
      • Paints And Coating
    • Y-o-Y Growth Trend Analysis By Application, 2020 to 2024
    • Absolute $ Opportunity Analysis By Application, 2025 to 2035
  8. Global Market Analysis 2020 to 2024 and Forecast 2025 to 2035, By Region
    • Introduction
    • Historical Market Size Value (USD Million) Analysis By Region, 2020 to 2024
    • Current Market Size Value (USD Million) Analysis and Forecast By Region, 2025 to 2035
      • North America
      • Latin America
      • Western Europe
      • Eastern Europe
      • East Asia
      • South Asia and Pacific
      • Middle East & Africa
    • Market Attractiveness Analysis By Region
  9. North America Market Analysis 2020 to 2024 and Forecast 2025 to 2035, By Country
    • Historical Market Size Value (USD Million) Trend Analysis By Market Taxonomy, 2020 to 2024
    • Market Size Value (USD Million) Forecast By Market Taxonomy, 2025 to 2035
      • By Country
        • USA
        • Canada
        • Mexico
      • By Product Type
      • By Application
    • Market Attractiveness Analysis
      • By Country
      • By Product Type
      • By Application
    • Key Takeaways
  10. Latin America Market Analysis 2020 to 2024 and Forecast 2025 to 2035, By Country
    • Historical Market Size Value (USD Million) Trend Analysis By Market Taxonomy, 2020 to 2024
    • Market Size Value (USD Million) Forecast By Market Taxonomy, 2025 to 2035
      • By Country
        • Brazil
        • Chile
        • Rest of Latin America
      • By Product Type
      • By Application
    • Market Attractiveness Analysis
      • By Country
      • By Product Type
      • By Application
    • Key Takeaways
  11. Western Europe Market Analysis 2020 to 2024 and Forecast 2025 to 2035, By Country
    • Historical Market Size Value (USD Million) Trend Analysis By Market Taxonomy, 2020 to 2024
    • Market Size Value (USD Million) Forecast By Market Taxonomy, 2025 to 2035
      • By Country
        • Germany
        • UK
        • Italy
        • Spain
        • France
        • Nordic
        • BENELUX
        • Rest of Western Europe
      • By Product Type
      • By Application
    • Market Attractiveness Analysis
      • By Country
      • By Product Type
      • By Application
    • Key Takeaways
  12. Eastern Europe Market Analysis 2020 to 2024 and Forecast 2025 to 2035, By Country
    • Historical Market Size Value (USD Million) Trend Analysis By Market Taxonomy, 2020 to 2024
    • Market Size Value (USD Million) Forecast By Market Taxonomy, 2025 to 2035
      • By Country
        • Russia
        • Poland
        • Hungary
        • Balkan & Baltic
        • Rest of Eastern Europe
      • By Product Type
      • By Application
    • Market Attractiveness Analysis
      • By Country
      • By Product Type
      • By Application
    • Key Takeaways
  13. East Asia Market Analysis 2020 to 2024 and Forecast 2025 to 2035, By Country
    • Historical Market Size Value (USD Million) Trend Analysis By Market Taxonomy, 2020 to 2024
    • Market Size Value (USD Million) Forecast By Market Taxonomy, 2025 to 2035
      • By Country
        • China
        • Japan
        • South Korea
      • By Product Type
      • By Application
    • Market Attractiveness Analysis
      • By Country
      • By Product Type
      • By Application
    • Key Takeaways
  14. South Asia and Pacific Market Analysis 2020 to 2024 and Forecast 2025 to 2035, By Country
    • Historical Market Size Value (USD Million) Trend Analysis By Market Taxonomy, 2020 to 2024
    • Market Size Value (USD Million) Forecast By Market Taxonomy, 2025 to 2035
      • By Country
        • India
        • ASEAN
        • Australia & New Zealand
        • Rest of South Asia and Pacific
      • By Product Type
      • By Application
    • Market Attractiveness Analysis
      • By Country
      • By Product Type
      • By Application
    • Key Takeaways
  15. Middle East & Africa Market Analysis 2020 to 2024 and Forecast 2025 to 2035, By Country
    • Historical Market Size Value (USD Million) Trend Analysis By Market Taxonomy, 2020 to 2024
    • Market Size Value (USD Million) Forecast By Market Taxonomy, 2025 to 2035
      • By Country
        • Kingdom of Saudi Arabia
        • Other GCC Countries
        • Turkiye
        • South Africa
        • Other African Union
        • Rest of Middle East & Africa
      • By Product Type
      • By Application
    • Market Attractiveness Analysis
      • By Country
      • By Product Type
      • By Application
    • Key Takeaways
  16. Key Countries Market Analysis
    • USA
      • Pricing Analysis
      • Market Share Analysis, 2024
        • By Product Type
        • By Application
    • Canada
      • Pricing Analysis
      • Market Share Analysis, 2024
        • By Product Type
        • By Application
    • Mexico
      • Pricing Analysis
      • Market Share Analysis, 2024
        • By Product Type
        • By Application
    • Brazil
      • Pricing Analysis
      • Market Share Analysis, 2024
        • By Product Type
        • By Application
    • Chile
      • Pricing Analysis
      • Market Share Analysis, 2024
        • By Product Type
        • By Application
    • Germany
      • Pricing Analysis
      • Market Share Analysis, 2024
        • By Product Type
        • By Application
    • UK
      • Pricing Analysis
      • Market Share Analysis, 2024
        • By Product Type
        • By Application
    • Italy
      • Pricing Analysis
      • Market Share Analysis, 2024
        • By Product Type
        • By Application
    • Spain
      • Pricing Analysis
      • Market Share Analysis, 2024
        • By Product Type
        • By Application
    • France
      • Pricing Analysis
      • Market Share Analysis, 2024
        • By Product Type
        • By Application
    • India
      • Pricing Analysis
      • Market Share Analysis, 2024
        • By Product Type
        • By Application
    • ASEAN
      • Pricing Analysis
      • Market Share Analysis, 2024
        • By Product Type
        • By Application
    • Australia & New Zealand
      • Pricing Analysis
      • Market Share Analysis, 2024
        • By Product Type
        • By Application
    • China
      • Pricing Analysis
      • Market Share Analysis, 2024
        • By Product Type
        • By Application
    • Japan
      • Pricing Analysis
      • Market Share Analysis, 2024
        • By Product Type
        • By Application
    • South Korea
      • Pricing Analysis
      • Market Share Analysis, 2024
        • By Product Type
        • By Application
    • Russia
      • Pricing Analysis
      • Market Share Analysis, 2024
        • By Product Type
        • By Application
    • Poland
      • Pricing Analysis
      • Market Share Analysis, 2024
        • By Product Type
        • By Application
    • Hungary
      • Pricing Analysis
      • Market Share Analysis, 2024
        • By Product Type
        • By Application
    • Kingdom of Saudi Arabia
      • Pricing Analysis
      • Market Share Analysis, 2024
        • By Product Type
        • By Application
    • Turkiye
      • Pricing Analysis
      • Market Share Analysis, 2024
        • By Product Type
        • By Application
    • South Africa
      • Pricing Analysis
      • Market Share Analysis, 2024
        • By Product Type
        • By Application
  17. Market Structure Analysis
    • Competition Dashboard
    • Competition Benchmarking
    • Market Share Analysis of Top Players
      • By Regional
      • By Product Type
      • By Application
  18. Competition Analysis
    • Competition Deep Dive
      • Biosil
        • Overview
        • Product Portfolio
        • Profitability by Market Segments (Product/Age /Sales Channel/Region)
        • Sales Footprint
        • Strategy Overview
          • Marketing Strategy
          • Product Strategy
          • Channel Strategy
      • Duraflame
      • BioJouvance
      • Fisch
      • Remmers
      • Chant Oil Co. Ltd.
  19. Assumptions & Acronyms Used
  20. Research Methodology

List of Tables

  • Table 1: Global Market Value (USD Million) Forecast by Region, 2020-2035
  • Table 2: Global Market Value (USD Million) Forecast by Product Type , 2020-2035
  • Table 3: Global Market Value (USD Million) Forecast by Application, 2020-2035
  • Table 4: North America Market Value (USD Million) Forecast by Country, 2020-2035
  • Table 5: North America Market Value (USD Million) Forecast by Product Type , 2020-2035
  • Table 6: North America Market Value (USD Million) Forecast by Application, 2020-2035
  • Table 7: Latin America Market Value (USD Million) Forecast by Country, 2020-2035
  • Table 8: Latin America Market Value (USD Million) Forecast by Product Type , 2020-2035
  • Table 9: Latin America Market Value (USD Million) Forecast by Application, 2020-2035
  • Table 10: Western Europe Market Value (USD Million) Forecast by Country, 2020-2035
  • Table 11: Western Europe Market Value (USD Million) Forecast by Product Type , 2020-2035
  • Table 12: Western Europe Market Value (USD Million) Forecast by Application, 2020-2035
  • Table 13: Eastern Europe Market Value (USD Million) Forecast by Country, 2020-2035
  • Table 14: Eastern Europe Market Value (USD Million) Forecast by Product Type , 2020-2035
  • Table 15: Eastern Europe Market Value (USD Million) Forecast by Application, 2020-2035
  • Table 16: East Asia Market Value (USD Million) Forecast by Country, 2020-2035
  • Table 17: East Asia Market Value (USD Million) Forecast by Product Type , 2020-2035
  • Table 18: East Asia Market Value (USD Million) Forecast by Application, 2020-2035
  • Table 19: South Asia and Pacific Market Value (USD Million) Forecast by Country, 2020-2035
  • Table 20: South Asia and Pacific Market Value (USD Million) Forecast by Product Type , 2020-2035
  • Table 21: South Asia and Pacific Market Value (USD Million) Forecast by Application, 2020-2035
  • Table 22: Middle East & Africa Market Value (USD Million) Forecast by Country, 2020-2035
  • Table 23: Middle East & Africa Market Value (USD Million) Forecast by Product Type , 2020-2035
  • Table 24: Middle East & Africa Market Value (USD Million) Forecast by Application, 2020-2035

List of Figures

  • Figure 1: Global Market Pricing Analysis
  • Figure 2: Global Market Value (USD Million) Forecast 2020-2035
  • Figure 3: Global Market Value Share and BPS Analysis by Product Type , 2025 and 2035
  • Figure 4: Global Market Y-o-Y Growth Comparison by Product Type , 2025-2035
  • Figure 5: Global Market Attractiveness Analysis by Product Type
  • Figure 6: Global Market Value Share and BPS Analysis by Application, 2025 and 2035
  • Figure 7: Global Market Y-o-Y Growth Comparison by Application, 2025-2035
  • Figure 8: Global Market Attractiveness Analysis by Application
  • Figure 9: Global Market Value (USD Million) Share and BPS Analysis by Region, 2025 and 2035
  • Figure 10: Global Market Y-o-Y Growth Comparison by Region, 2025-2035
  • Figure 11: Global Market Attractiveness Analysis by Region
  • Figure 12: North America Market Incremental Dollar Opportunity, 2025-2035
  • Figure 13: Latin America Market Incremental Dollar Opportunity, 2025-2035
  • Figure 14: Western Europe Market Incremental Dollar Opportunity, 2025-2035
  • Figure 15: Eastern Europe Market Incremental Dollar Opportunity, 2025-2035
  • Figure 16: East Asia Market Incremental Dollar Opportunity, 2025-2035
  • Figure 17: South Asia and Pacific Market Incremental Dollar Opportunity, 2025-2035
  • Figure 18: Middle East & Africa Market Incremental Dollar Opportunity, 2025-2035
  • Figure 19: North America Market Value Share and BPS Analysis by Country, 2025 and 2035
  • Figure 20: North America Market Value Share and BPS Analysis by Product Type , 2025 and 2035
  • Figure 21: North America Market Y-o-Y Growth Comparison by Product Type , 2025-2035
  • Figure 22: North America Market Attractiveness Analysis by Product Type
  • Figure 23: North America Market Value Share and BPS Analysis by Application, 2025 and 2035
  • Figure 24: North America Market Y-o-Y Growth Comparison by Application, 2025-2035
  • Figure 25: North America Market Attractiveness Analysis by Application
  • Figure 26: Latin America Market Value Share and BPS Analysis by Country, 2025 and 2035
  • Figure 27: Latin America Market Value Share and BPS Analysis by Product Type , 2025 and 2035
  • Figure 28: Latin America Market Y-o-Y Growth Comparison by Product Type , 2025-2035
  • Figure 29: Latin America Market Attractiveness Analysis by Product Type
  • Figure 30: Latin America Market Value Share and BPS Analysis by Application, 2025 and 2035
  • Figure 31: Latin America Market Y-o-Y Growth Comparison by Application, 2025-2035
  • Figure 32: Latin America Market Attractiveness Analysis by Application
  • Figure 33: Western Europe Market Value Share and BPS Analysis by Country, 2025 and 2035
  • Figure 34: Western Europe Market Value Share and BPS Analysis by Product Type , 2025 and 2035
  • Figure 35: Western Europe Market Y-o-Y Growth Comparison by Product Type , 2025-2035
  • Figure 36: Western Europe Market Attractiveness Analysis by Product Type
  • Figure 37: Western Europe Market Value Share and BPS Analysis by Application, 2025 and 2035
  • Figure 38: Western Europe Market Y-o-Y Growth Comparison by Application, 2025-2035
  • Figure 39: Western Europe Market Attractiveness Analysis by Application
  • Figure 40: Eastern Europe Market Value Share and BPS Analysis by Country, 2025 and 2035
  • Figure 41: Eastern Europe Market Value Share and BPS Analysis by Product Type , 2025 and 2035
  • Figure 42: Eastern Europe Market Y-o-Y Growth Comparison by Product Type , 2025-2035
  • Figure 43: Eastern Europe Market Attractiveness Analysis by Product Type
  • Figure 44: Eastern Europe Market Value Share and BPS Analysis by Application, 2025 and 2035
  • Figure 45: Eastern Europe Market Y-o-Y Growth Comparison by Application, 2025-2035
  • Figure 46: Eastern Europe Market Attractiveness Analysis by Application
  • Figure 47: East Asia Market Value Share and BPS Analysis by Country, 2025 and 2035
  • Figure 48: East Asia Market Value Share and BPS Analysis by Product Type , 2025 and 2035
  • Figure 49: East Asia Market Y-o-Y Growth Comparison by Product Type , 2025-2035
  • Figure 50: East Asia Market Attractiveness Analysis by Product Type
  • Figure 51: East Asia Market Value Share and BPS Analysis by Application, 2025 and 2035
  • Figure 52: East Asia Market Y-o-Y Growth Comparison by Application, 2025-2035
  • Figure 53: East Asia Market Attractiveness Analysis by Application
  • Figure 54: South Asia and Pacific Market Value Share and BPS Analysis by Country, 2025 and 2035
  • Figure 55: South Asia and Pacific Market Value Share and BPS Analysis by Product Type , 2025 and 2035
  • Figure 56: South Asia and Pacific Market Y-o-Y Growth Comparison by Product Type , 2025-2035
  • Figure 57: South Asia and Pacific Market Attractiveness Analysis by Product Type
  • Figure 58: South Asia and Pacific Market Value Share and BPS Analysis by Application, 2025 and 2035
  • Figure 59: South Asia and Pacific Market Y-o-Y Growth Comparison by Application, 2025-2035
  • Figure 60: South Asia and Pacific Market Attractiveness Analysis by Application
  • Figure 61: Middle East & Africa Market Value Share and BPS Analysis by Country, 2025 and 2035
  • Figure 62: Middle East & Africa Market Value Share and BPS Analysis by Product Type , 2025 and 2035
  • Figure 63: Middle East & Africa Market Y-o-Y Growth Comparison by Product Type , 2025-2035
  • Figure 64: Middle East & Africa Market Attractiveness Analysis by Product Type
  • Figure 65: Middle East & Africa Market Value Share and BPS Analysis by Application, 2025 and 2035
  • Figure 66: Middle East & Africa Market Y-o-Y Growth Comparison by Application, 2025-2035
  • Figure 67: Middle East & Africa Market Attractiveness Analysis by Application
  • Figure 68: Global Market - Tier Structure Analysis
  • Figure 69: Global Market - Company Share Analysis
Dashboard
Dashboard
Dashboard
Dashboard
Dashboard
Dashboard

Full Research Suite comprises of:

Market outlook & trends analysis

Market outlook & trends analysis

Interviews & case studies

Interviews & case studies

Strategic recommendations

Strategic recommendations

Vendor profiles & capabilities analysis

Vendor profiles & capabilities analysis

5-year forecasts

5-year forecasts

8 regions and 60+ country-level data splits

8 regions and 60+ country-level data splits

Market segment data splits

Market segment data splits

12 months of continuous data updates

12 months of continuous data updates

DELIVERED AS:

PDF EXCEL ONLINE

Full Research Suite


$5000

$7500

$10000

Buy Report Now
Future Market Insights

Bio-wax Market

Chat With MaRIA

Chat With

MaRIA

Hi There, I am MaRIA, Your Market Research Intelligence Assistant. How may I help you?