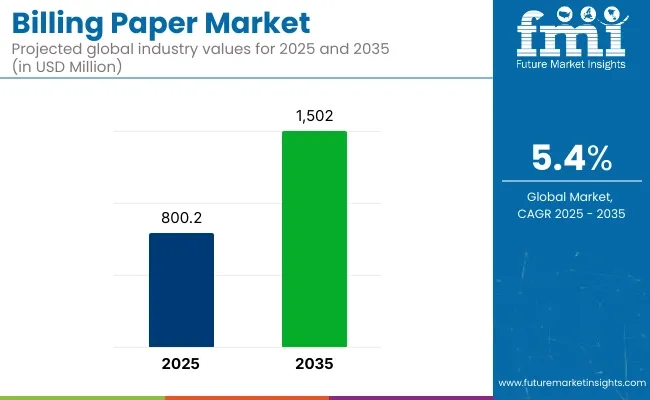
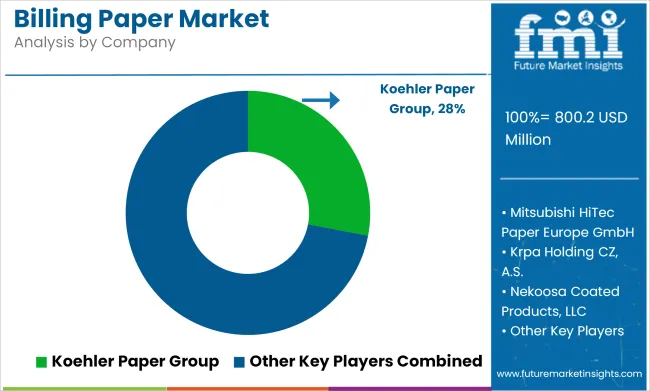
The billing paper market is expected to experience strong demand, with a total valuation of US$ 897.1 million in 2023 rising to US$ 1,536.5 million by 2033. FMI also forecasts billing paper sales to increase at a steady 5.9% CAGR between 2023 and 2033.
Key factor propelling the market growth is the rising adoption of POS terminals and credit card terminals, particularly in the retail industry. Additionally, during the anticipated period, adoption of billing paper rises with the expanding demand for thermal paper in the banking sector.
Also, billing paper industry players active in the global thermal paper market benefit from the growing acceptance of mPOS terminals among businesses, particularly in emerging nations.
The billing paper sector also represented nearly 1% of the total US$ ~62 billion worth global printing paper market in 2020. The percentage of shares held by the market is expected to improve over the assessment period.
Attributes | Details |
---|---|
Billing Paper Market CAGR (2023 to 2033) | 5.9% |
Billing Paper Market Size (2023) | US$ 897.1 million |
Billing Paper Market Size (2033) | US$ 1,536.5 million |
Don't pay for what you don't need
Customize your report by selecting specific countries or regions and save 30%!
Driven by the staggering need for invoices and receipts in institutional and commercial sectors globally, the billing paper market was expanding with a CAGR of 3.3% between 2016 and 2022.
Particulars | Details |
---|---|
Jan-Jun (H1), 2021 (A) | 3.2% |
Jan-Jun (H1), 2022 Projected (P) | 3.3% |
Jan-Jun (H1), 2022 Outlook (O) | 3.7% |
BPS: H1,2022 (O) - H1,2022 (A) | 50 |
BPS: H1,2022 (O) - H1,2021 (A) | 40 |
Billing papers are used when more copies of invoices and receipts are required in businesses. Hence, the billing paper business is driven by the rising demand for convenience, budget-friendly, and user-friendly billing transactions.
With these factors, the market rose from US$ 705.4 million in 2016 to US$ 869.83 million in 2022. The pre-printed billing invoice copies are an excellent way to keep data on business organized in an efficient and effective manner by offering customers an instant and tangible transactional record.
Short-term growth (2023 to 2026): Increasing environmental protection concerns boost the demand for billing paper due to its eco-friendly, recyclable, and sustainable features. The global sales are expanding at a Y-o-Y of 3.1% in 2023.
Medium-term growth (2027-2030): The retail and e-commerce industries' expanding need for direct thermal billing paper, together with the proliferation of novel applications, are anticipated to fuel the market's medium-term expansion.
Long-term growth (2031 to 2033): The market is anticipated to see many opportunities as a result of the rising demand for eco-friendly billing paper solutions, and is projected to reach US$ 1,489.8 million by 2031.
Billing paper is an excellent way to keep the business organized efficiently and effectively. Sales of billing paper are projected to rise, since it gives firms a personal touch by including a distinctive design logo, catchy captions, a slogan, and crucial information.
It also saves time, energy, and printing costs by offering customers an instant and tangible transactional record or agreement. Companies can edit, add, or replace information to the billing paper.
Companies can customize billing papers to keep the pre-printed sequential numbering for easy tracking, hole punching, and other business work to keep the copies together for quick reference.
The self-designed billing paper forms offer convenience and ease of use. They are also user-friendly, showcasing specific and essential information. Hence, self-designed and customized billing paper improves a company’s brand image and promotes business.
Application of billing papers in diverse end-use industries, such as grocery stores, pharmaceutical shops, and offices, is increasing. Billing paper (carbon copying paper) manufacturing consumes a substantial amount of montan wax, which is extracted from brown coal or certain types of lignite.
Wide use of lignite wax is unsustainable and costly. Hence, considering the environmental drawbacks of carbon copying papers, carbonless paper is biodegradable and far more environmentally viable.
Carbonless paper is more efficient than carbon copying paper, as each carbonless paper sheet produces legible, neat, and clear 2-part, 3-part, or multiple-part copies at a time. As it is more efficient and effective than carbon paper, billing paper provides more profit margins to the manufacturers.
It is manufactured by using environmentally friendly wood pulp and has a significant impact on conserving the green cover. Hence, growing preference for eco-friendly, sustainable carbonless paper reduces the carbon footprint.
In order to curb the carbon emissions, demand for eco-friendly and sustainable carbonless paper is likely to improve the growth in the billing paper industry.
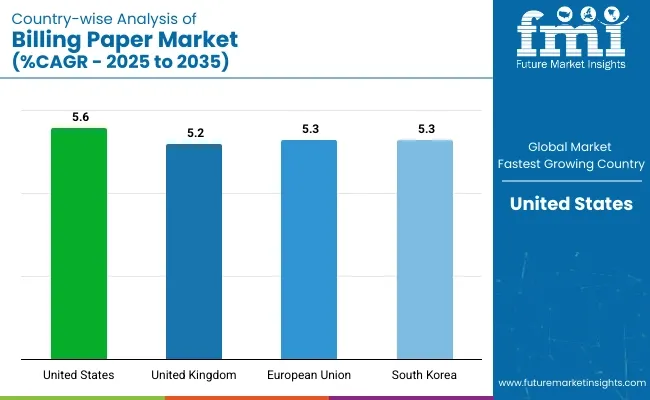
According to the study, the United States accounted for 15.3% market share, with a value of US$ 132.8 million in 2022.
According to the American Forest and Paper Association, paper products are sustainable and essential for a circular economy made from renewable resources and recycled paper products, which can be reused and recycled multiple times by reducing the dumping of landfills.
As billing invoice paper has made billing more convenient and more manageable, adoption of billing paper is likely to see high growth by 2033. For instance, manufacturers of billing papers, such as Pixelle Specialty Solutions, have developed carbonless papers (billing paper) made from NatureSolv™ technology. It ensures naturally based, organic solvent to create capsules.
Xcelerator® Digital Carbonless Rolls (billing rolls) are the environment-friendly responsible choice for printable carbonless papers (billing papers) with proprietary NatureSolv™ capsule technology and 30% Post-Consumer Waste (PCW) options.
As per FMI, demand for renewable raw materials and low-carbon bio economy products is expected to propel the growth in the billing paper market. Germany accounted for 5.7% market share, with a value of US$ 49.8 million in 2022.
According to the Confederation of European Paper Industry (Cepi), the European paper industry wants to lead the decarbonizing process and invest significantly on the route towards a low-carbon European bio economy.
Hence, Europe's billing paper sector is highly sustainable and competitive due to the transformation in the sector by using new technologies, new bio-values, and business opportunities.
For instance, Germany's amusement park, Europa-park, has started using the innovative Blue4est® receipt paper of Koehler paper (from Koehler Paper Group), which is sustainable, durable, and recyclable by taking into consideration the customer's interest in increased sustainable importance.
Rising demand for user-friendly, cost-effective billing papers, coupled with growing environmental concern, bolster the growth in the market.
The billing paper market in India is expected to account for a significant 50% value share during the forecast period. According to the Indian Paper Manufacturers Association (IPMA), the paper industry is taking new strides in India due to cutting-edge technology, the Make in India initiative, manufacturing excellence, and sustainability.
Attributes | Statistics |
---|---|
India Market Value 2022 | US$ 90.7 million |
India Market Value 2033 | US$ 186.3 million |
India Market CAGR (2023 to 2033) | 8.33% |
India is among the leading paper markets across the globe. It exhibits an exciting scenario using a variety of raw materials, such as wood, bamboo, bagasse, wheat straw, and rice husk, in paper production.
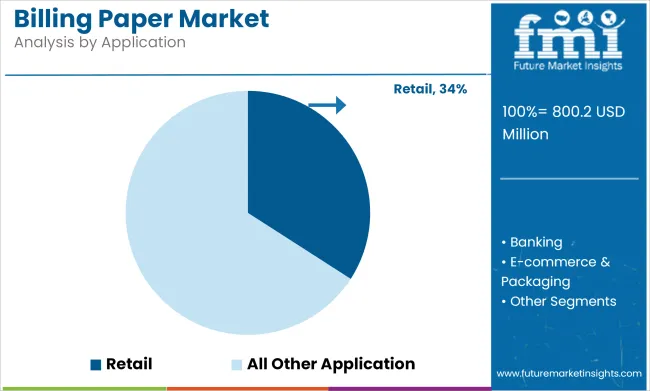
India's rapid growth in fast-moving consumer goods (FMCG), ready-to-eat food, pharmacy, healthcare, educational, and organized retail sector is expected to have a remarkable impact on the billing paper market.
The billing paper consumption is poised for a big leap forward, as the Indian paper industry supports about 5% of the world's paper production.
Companies are focusing on keeping track of sale transactions with high-quality invoice paper, which maintains reliable records in an organized manner. Also, the rising trend of shopping in supermarkets, e-commerce, and ready-made takeaway food is likely to augment the growth of the billing paper market.
China’s billing paper market is projected to expand at 7.16% CAGR during the forecast period. Rising demand for convenience and security of billing transactions in business, institutions, and the commercial sector are the leading factors propelling the growth in China's billing paper industry.
According to the Chinese Paper Industry Association, China is one of the leading countries for paper production and consumption. However, the paper market is experiencing both opportunities and challenges.
In developed regions of China, consumers have a relatively higher quality of life. With increasing transaction and purchase from shopping malls and growing popularity of e-commerce, consumption of billing paper in China is expected to increase.
Also, the growing consumer’s inclination towards convenience and security against forgery boosts the adoption of billing paper in China. The market is likely to grow from US$ 155.2 million in 2022 to US$ 289.3 million by 2033.
Australia’s billing paper market accounted for 0.9% market share, with a value of US$ 8 million in 2022. Rapid growth in paper recovery, recycling, and customized billing papers are the factors propelling the growth in the market.
According to the Australasian Paper Industry Association (APIA), the paper recycling rate in Australia is the maximum globally, as more than 87% of paper and paperboard consumed have been recovered.
Since paper is one of the most recycled materials, it plays a crucial role in the circular economy. Bill, invoice, and receipt books are required for daily business transactions. Also, customizing and pre-printed bills or receipt books with premium quality adds a professional status.
Hence, businesses are using environment-friendly paper to advertise and boost the brand image. Subsequently, growing manufacturer’s and consumer’s preference for eco-friendly, recyclable, and customized billing paper propels the demand in Australia.
Get the data you need at a Fraction of the cost
Personalize your report by choosing insights you need
and save 40%!
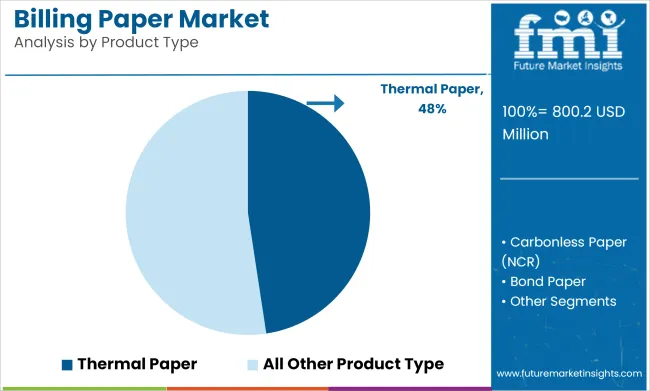
As per FMI, the 2 parts NCR paper segment is experiencing an upward growth rate, accounting for ~35% market share by 2033. The 2 parts paper is preferred for forms that need only a single copy of invoices and sales receipts. The 2 parts NCR paper segment dominated the market with a share of 39.5 % in 2022.
According to the study, 2 parts NCR papers are expected to have the leading market share due to the easy transfer of handwritten information from the top sheet to underneath. The 2 parts NCR paper ensures accuracy of getting the same information on the second copy.
Also, carbonless (billing paper) two parts invoice forms are cost-effective and an eco-friendly alternative to carbon paper. Availability of ready-made customized double part invoice books is likely to propel the segment growth.
Sales of 2 parts NCR paper are expected to spur, as it saves time and reduces human errors by preparing the documentation fast and hassle-free. Hence, growing demand for convenient, safe, and reliable receipt and billing transactions enhances the billing papers market.
Nowadays, most organizations, institutions, and business sectors switch towards billing paper forms, such as invoices, sales receipts, purchase orders, etc. It is mainly used as a receipt given to the customers during the purchase of any products from stores.
As per FMI, increasing adoption of billing paper in institutions and businesses spurs the sales over the coming years. Additionally, institutions prefer these billing receipts or invoice books, as this is coated to transfer the handwritten or typed data beneath multiple pages.
Businesses save the maintenance cost by using laser printers for bill printing, reducing the waste papers, and accommodating higher demand for convenient and more accessible printing.
The pre-printed and customized carbonless invoice, receipts register, shipping documents, bill of lading, etc., provide convenience and security. Hence, companies and the industrial sector are resorting to billing papers due to their cheap, cost-effective, and simple attributes.
Future Market Insights projects, 40 to 100 GSM segments are anticipated to dominate the segment, contributing ~60% sales during the forecast period. With a market share of 62.1% in 2022, the 40 to 100 GSM dominated the market and has since expanded in a similar way.
The high GSM ensures the stiffness and sturdiness of the paper. For typical office stationery, such as invoice and receipt book printing, usually the 70 to 90 GSM weight paper is preferred. As 70 to 75 GSM paper is made with superior wood fiber materials, end-users prefer billing papers of this basis weight.
Lighter weights and recyclable good quality papers are excellent for the environment. Also, 75 GSM billing papers are extremely eco-friendly. Hence, increasing adoption of 40 to 100 GSM weight billing papers boosts the market.
Billing Paper Market: High Earning Partnerships & Strategies
Companies operating in the billing paper market are aiming at acquisition and strategic partnerships with other manufacturers.
The market is valued at US$ 897.1 billion in 2023.
The global market size is to reach US$ 1,536.5 billion by 2033.
The billing paper market is to grow at 5.9% through 2033.
Europe is expected to witness higher growth in the forecast period.
During 2018 to 2022, the market recorded a CAGR of 3.3%.
1. Executive Summary | Billing Paper Market 1.1. Global Market Outlook 1.2. Demand-side Trends 1.3. Supply-side Trends 1.4. Technology Roadmap Analysis 1.5. Analysis and Recommendations 2. Market Overview 2.1. Market Coverage / Taxonomy 2.2. Market Definition / Scope / Limitations 3. Market Background 3.1. Market Dynamics 3.1.1. Drivers 3.1.2. Restraints 3.1.3. Opportunity 3.1.4. Trends 3.2. Scenario Forecast 3.2.1. Demand in Optimistic Scenario 3.2.2. Demand in Likely Scenario 3.2.3. Demand in Conservative Scenario 3.3. Opportunity Map Analysis 3.4. Product Life Cycle Analysis 3.5. Supply Chain Analysis 3.5.1. Supply Side Participants and their Roles 3.5.1.1. Producers 3.5.1.2. Mid-Level Participants (Traders/ Agents/ Brokers) 3.5.1.3. Wholesalers and Distributors 3.5.2. Value Added and Value Created at Node in the Supply Chain 3.5.3. List of Raw Material Suppliers 3.5.4. List of Existing and Potential Buyer’s 3.6. Investment Feasibility Matrix 3.7. Value Chain Analysis 3.7.1. Profit Margin Analysis 3.7.2. Wholesalers and Distributors 3.7.3. Retailers 3.8. PESTLE and Porter’s Analysis 3.9. Regulatory Landscape 3.9.1. By Key Regions 3.9.2. By Key Countries 3.10. Regional Parent Market Outlook 3.11. Production and Consumption Statistics 3.12. Import and Export Statistics 4. Global Market Analysis 2018 to 2022 and Forecast, 2023 to 2033 4.1. Historical Market Size Value (US$ Million) & Volume (Tons) Analysis, 2018 to 2022 4.2. Current and Future Market Size Value (US$ Million) & Volume (Tons) Projections, 2023 to 2033 4.2.1. Y-o-Y Growth Trend Analysis 4.2.2. Absolute $ Opportunity Analysis 5. Global Market Analysis 2018 to 2022 and Forecast 2023 to 2033, By Paper Type 5.1. Introduction / Key Findings 5.2. Historical Market Size Value (US$ Million) & Volume (Tons) Analysis By Paper Type, 2018 to 2022 5.3. Current and Future Market Size Value (US$ Million) & Volume (Tons) Analysis and Forecast By Paper Type, 2023 to 2033 5.3.1. 2 Parts NCR Paper 5.3.2. 3 Parts NCR Paper 5.3.3. 4 Parts NCR Paper 5.3.4. 5 Parts NCR Paper 5.4. Y-o-Y Growth Trend Analysis By Paper Type, 2018 to 2022 5.5. Absolute $ Opportunity Analysis By Paper Type, 2023 to 2033 6. Global Market Analysis 2018 to 2022 and Forecast 2023 to 2033, By Basis Weight 6.1. Introduction / Key Findings 6.2. Historical Market Size Value (US$ Million) & Volume (Tons) Analysis By Basis Weight, 2018 to 2022 6.3. Current and Future Market Size Value (US$ Million) & Volume (Tons) Analysis and Forecast By Basis Weight, 2023 to 2033 6.3.1. Up to 40 GSM 6.3.2. 40-100 GSM 6.3.3. Above 100 GSM 6.4. Y-o-Y Growth Trend Analysis By Basis Weight, 2018 to 2022 6.5. Absolute $ Opportunity Analysis By Basis Weight, 2023 to 2033 7. Global Market Analysis 2018 to 2022 and Forecast 2023 to 2033, By Application 7.1. Introduction / Key Findings 7.2. Historical Market Size Value (US$ Million) & Volume (Tons) Analysis By Application, 2018 to 2022 7.3. Current and Future Market Size Value (US$ Million) & Volume (Tons) Analysis and Forecast By Application, 2023 to 2033 7.3.1. Institutional 7.3.2. Educational 7.3.3. Business 7.3.4. Households 7.4. Y-o-Y Growth Trend Analysis By Application, 2018 to 2022 7.5. Absolute $ Opportunity Analysis By Application, 2023 to 2033 8. Global Market Analysis 2018 to 2022 and Forecast 2023 to 2033, By Region 8.1. Introduction 8.2. Historical Market Size Value (US$ Million) & Volume (Tons) Analysis By Region, 2018 to 2022 8.3. Current Market Size Value (US$ Million) & Volume (Tons) Analysis and Forecast By Region, 2023 to 2033 8.3.1. North America 8.3.2. Latin America 8.3.3. Europe 8.3.4. Asia Pacific 8.3.5. MEA 8.4. Market Attractiveness Analysis By Region 9. North America Market Analysis 2018 to 2022 and Forecast 2023 to 2033, By Country 9.1. Historical Market Size Value (US$ Million) & Volume (Tons) Trend Analysis By Market Taxonomy, 2018 to 2022 9.2. Market Size Value (US$ Million) & Volume (Tons) Forecast By Market Taxonomy, 2023 to 2033 9.2.1. By Country 9.2.1.1. USA 9.2.1.2. Canada 9.2.2. By Paper Type 9.2.3. By Basis Weight 9.2.4. By Application 9.3. Market Attractiveness Analysis 9.3.1. By Country 9.3.2. By Paper Type 9.3.3. By Basis Weight 9.3.4. By Application 9.4. Key Takeaways 10. Latin America Market Analysis 2018 to 2022 and Forecast 2023 to 2033, By Country 10.1. Historical Market Size Value (US$ Million) & Volume (Tons) Trend Analysis By Market Taxonomy, 2018 to 2022 10.2. Market Size Value (US$ Million) & Volume (Tons) Forecast By Market Taxonomy, 2023 to 2033 10.2.1. By Country 10.2.1.1. Brazil 10.2.1.2. Mexico 10.2.1.3. Rest of Latin America 10.2.2. By Paper Type 10.2.3. By Basis Weight 10.2.4. By Application 10.3. Market Attractiveness Analysis 10.3.1. By Country 10.3.2. By Paper Type 10.3.3. By Basis Weight 10.3.4. By Application 10.4. Key Takeaways 11. Europe Market Analysis 2018 to 2022 and Forecast 2023 to 2033, By Country 11.1. Historical Market Size Value (US$ Million) & Volume (Tons) Trend Analysis By Market Taxonomy, 2018 to 2022 11.2. Market Size Value (US$ Million) & Volume (Tons) Forecast By Market Taxonomy, 2023 to 2033 11.2.1. By Country 11.2.1.1. Germany 11.2.1.2. United Kingdom 11.2.1.3. France 11.2.1.4. Spain 11.2.1.5. Italy 11.2.1.6. Rest of Europe 11.2.2. By Paper Type 11.2.3. By Basis Weight 11.2.4. By Application 11.3. Market Attractiveness Analysis 11.3.1. By Country 11.3.2. By Paper Type 11.3.3. By Basis Weight 11.3.4. By Application 11.4. Key Takeaways 12. Asia Pacific Market Analysis 2018 to 2022 and Forecast 2023 to 2033, By Country 12.1. Historical Market Size Value (US$ Million) & Volume (Tons) Trend Analysis By Market Taxonomy, 2018 to 2022 12.2. Market Size Value (US$ Million) & Volume (Tons) Forecast By Market Taxonomy, 2023 to 2033 12.2.1. By Country 12.2.1.1. China 12.2.1.2. Japan 12.2.1.3. South Korea 12.2.1.4. Singapore 12.2.1.5. Thailand 12.2.1.6. Indonesia 12.2.1.7. Australia 12.2.1.8. New Zealand 12.2.1.9. Rest of Asia Pacific 12.2.2. By Paper Type 12.2.3. By Basis Weight 12.2.4. By Application 12.3. Market Attractiveness Analysis 12.3.1. By Country 12.3.2. By Paper Type 12.3.3. By Basis Weight 12.3.4. By Application 12.4. Key Takeaways 13. MEA Market Analysis 2018 to 2022 and Forecast 2023 to 2033, By Country 13.1. Historical Market Size Value (US$ Million) & Volume (Tons) Trend Analysis By Market Taxonomy, 2018 to 2022 13.2. Market Size Value (US$ Million) & Volume (Tons) Forecast By Market Taxonomy, 2023 to 2033 13.2.1. By Country 13.2.1.1. GCC Countries 13.2.1.2. South Africa 13.2.1.3. Israel 13.2.1.4. Rest of MEA 13.2.2. By Paper Type 13.2.3. By Basis Weight 13.2.4. By Application 13.3. Market Attractiveness Analysis 13.3.1. By Country 13.3.2. By Paper Type 13.3.3. By Basis Weight 13.3.4. By Application 13.4. Key Takeaways 14. Key Countries Market Analysis 14.1. USA 14.1.1. Pricing Analysis 14.1.2. Market Share Analysis, 2022 14.1.2.1. By Paper Type 14.1.2.2. By Basis Weight 14.1.2.3. By Application 14.2. Canada 14.2.1. Pricing Analysis 14.2.2. Market Share Analysis, 2022 14.2.2.1. By Paper Type 14.2.2.2. By Basis Weight 14.2.2.3. By Application 14.3. Brazil 14.3.1. Pricing Analysis 14.3.2. Market Share Analysis, 2022 14.3.2.1. By Paper Type 14.3.2.2. By Basis Weight 14.3.2.3. By Application 14.4. Mexico 14.4.1. Pricing Analysis 14.4.2. Market Share Analysis, 2022 14.4.2.1. By Paper Type 14.4.2.2. By Basis Weight 14.4.2.3. By Application 14.5. Germany 14.5.1. Pricing Analysis 14.5.2. Market Share Analysis, 2022 14.5.2.1. By Paper Type 14.5.2.2. By Basis Weight 14.5.2.3. By Application 14.6. United Kingdom 14.6.1. Pricing Analysis 14.6.2. Market Share Analysis, 2022 14.6.2.1. By Paper Type 14.6.2.2. By Basis Weight 14.6.2.3. By Application 14.7. France 14.7.1. Pricing Analysis 14.7.2. Market Share Analysis, 2022 14.7.2.1. By Paper Type 14.7.2.2. By Basis Weight 14.7.2.3. By Application 14.8. Spain 14.8.1. Pricing Analysis 14.8.2. Market Share Analysis, 2022 14.8.2.1. By Paper Type 14.8.2.2. By Basis Weight 14.8.2.3. By Application 14.9. Italy 14.9.1. Pricing Analysis 14.9.2. Market Share Analysis, 2022 14.9.2.1. By Paper Type 14.9.2.2. By Basis Weight 14.9.2.3. By Application 14.10. China 14.10.1. Pricing Analysis 14.10.2. Market Share Analysis, 2022 14.10.2.1. By Paper Type 14.10.2.2. By Basis Weight 14.10.2.3. By Application 14.11. Japan 14.11.1. Pricing Analysis 14.11.2. Market Share Analysis, 2022 14.11.2.1. By Paper Type 14.11.2.2. By Basis Weight 14.11.2.3. By Application 14.12. South Korea 14.12.1. Pricing Analysis 14.12.2. Market Share Analysis, 2022 14.12.2.1. By Paper Type 14.12.2.2. By Basis Weight 14.12.2.3. By Application 14.13. Singapore 14.13.1. Pricing Analysis 14.13.2. Market Share Analysis, 2022 14.13.2.1. By Paper Type 14.13.2.2. By Basis Weight 14.13.2.3. By Application 14.14. Thailand 14.14.1. Pricing Analysis 14.14.2. Market Share Analysis, 2022 14.14.2.1. By Paper Type 14.14.2.2. By Basis Weight 14.14.2.3. By Application 14.15. Indonesia 14.15.1. Pricing Analysis 14.15.2. Market Share Analysis, 2022 14.15.2.1. By Paper Type 14.15.2.2. By Basis Weight 14.15.2.3. By Application 14.16. Australia 14.16.1. Pricing Analysis 14.16.2. Market Share Analysis, 2022 14.16.2.1. By Paper Type 14.16.2.2. By Basis Weight 14.16.2.3. By Application 14.17. New Zealand 14.17.1. Pricing Analysis 14.17.2. Market Share Analysis, 2022 14.17.2.1. By Paper Type 14.17.2.2. By Basis Weight 14.17.2.3. By Application 14.18. GCC Countries 14.18.1. Pricing Analysis 14.18.2. Market Share Analysis, 2022 14.18.2.1. By Paper Type 14.18.2.2. By Basis Weight 14.18.2.3. By Application 14.19. South Africa 14.19.1. Pricing Analysis 14.19.2. Market Share Analysis, 2022 14.19.2.1. By Paper Type 14.19.2.2. By Basis Weight 14.19.2.3. By Application 14.20. Israel 14.20.1. Pricing Analysis 14.20.2. Market Share Analysis, 2022 14.20.2.1. By Paper Type 14.20.2.2. By Basis Weight 14.20.2.3. By Application 15. Market Structure Analysis 15.1. Competition Dashboard 15.2. Competition Benchmarking 15.3. Market Share Analysis of Top Players 15.3.1. By Regional 15.3.2. By Paper Type 15.3.3. By Basis Weight 15.3.4. By Application 16. Competition Analysis 16.1. Competition Deep Dive 16.1.1. Koehler Paper Group 16.1.1.1. Overview 16.1.1.2. Product Portfolio 16.1.1.3. Profitability by Market Segments 16.1.1.4. Sales Footprint 16.1.1.5. Strategy Overview 16.1.1.5.1. Marketing Strategy 16.1.1.5.2. Product Strategy 16.1.1.5.3. Channel Strategy 16.1.2. Pixelle Specialty Solutions 16.1.2.1. Overview 16.1.2.2. Product Portfolio 16.1.2.3. Profitability by Market Segments 16.1.2.4. Sales Footprint 16.1.2.5. Strategy Overview 16.1.2.5.1. Marketing Strategy 16.1.2.5.2. Product Strategy 16.1.2.5.3. Channel Strategy 16.1.3. Mitsubishi HiTec Paper Europe GmbH 16.1.3.1. Overview 16.1.3.2. Product Portfolio 16.1.3.3. Profitability by Market Segments 16.1.3.4. Sales Footprint 16.1.3.5. Strategy Overview 16.1.3.5.1. Marketing Strategy 16.1.3.5.2. Product Strategy 16.1.3.5.3. Channel Strategy 16.1.4. Krpa Holding CZ, A.S. 16.1.4.1. Overview 16.1.4.2. Product Portfolio 16.1.4.3. Profitability by Market Segments 16.1.4.4. Sales Footprint 16.1.4.5. Strategy Overview 16.1.4.5.1. Marketing Strategy 16.1.4.5.2. Product Strategy 16.1.4.5.3. Channel Strategy 16.1.5. Nekoosa Coated Products, LLC 16.1.5.1. Overview 16.1.5.2. Product Portfolio 16.1.5.3. Profitability by Market Segments 16.1.5.4. Sales Footprint 16.1.5.5. Strategy Overview 16.1.5.5.1. Marketing Strategy 16.1.5.5.2. Product Strategy 16.1.5.5.3. Channel Strategy 16.1.6. K.D.M Enterprises 16.1.6.1. Overview 16.1.6.2. Product Portfolio 16.1.6.3. Profitability by Market Segments 16.1.6.4. Sales Footprint 16.1.6.5. Strategy Overview 16.1.6.5.1. Marketing Strategy 16.1.6.5.2. Product Strategy 16.1.6.5.3. Channel Strategy 16.1.7. Asia Pulp and Paper 16.1.7.1. Overview 16.1.7.2. Product Portfolio 16.1.7.3. Profitability by Market Segments 16.1.7.4. Sales Footprint 16.1.7.5. Strategy Overview 16.1.7.5.1. Marketing Strategy 16.1.7.5.2. Product Strategy 16.1.7.5.3. Channel Strategy 16.1.8. VistaCoat 16.1.8.1. Overview 16.1.8.2. Product Portfolio 16.1.8.3. Profitability by Market Segments 16.1.8.4. Sales Footprint 16.1.8.5. Strategy Overview 16.1.8.5.1. Marketing Strategy 16.1.8.5.2. Product Strategy 16.1.8.5.3. Channel Strategy 16.1.9. Double Tree Paper Industry Group Co., Ltd 16.1.9.1. Overview 16.1.9.2. Product Portfolio 16.1.9.3. Profitability by Market Segments 16.1.9.4. Sales Footprint 16.1.9.5. Strategy Overview 16.1.9.5.1. Marketing Strategy 16.1.9.5.2. Product Strategy 16.1.9.5.3. Channel Strategy 16.1.10. Surya Coats Private Limited 16.1.10.1. Overview 16.1.10.2. Product Portfolio 16.1.10.3. Profitability by Market Segments 16.1.10.4. Sales Footprint 16.1.10.5. Strategy Overview 16.1.10.5.1. Marketing Strategy 16.1.10.5.2. Product Strategy 16.1.10.5.3. Channel Strategy 17. Assumptions & Acronyms Used 18. Research Methodology
Explore Packaging Insights
View Reports