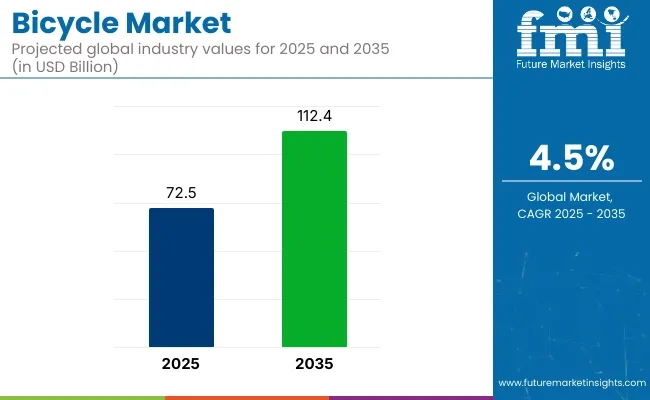
The bicycle market size in 2022 was US$ 1,300 million and is estimated to be US$ 2,650.23 million in 2023 where the scenario shows potential advancements in probabilities in the bicycle market.
The inclination toward bicycles is considered to have a favorable form of exercise for ensuring a healthy life, free from obesity and other disorders, and is anticipated to further boost the market expansion. According to the FMI analysis report, the bicycle market is predicted to develop a CAGR of 8.92% between 2023 and 2033, totaling around US$ 6,229.4 million by 2033.
Demand for bicycles is rising as a result of the dockless bicycle-sharing system's popularity and the urge to embrace a healthy lifestyle. Further, it is projected that the rise in the number of people choosing to bike as a leisure activity might drive bicycle market expansion.
The bicycle market share growth is anticipated to be further aided by consumer preference for bicycles as a convenient method of exercise to ensure a healthy life free from obesity and other illnesses.
Dockless bicycle-sharing programs have become well-liked recently. Increased disposable income and increased consumer expenditure on the bicycle sector are the key factors driving the demand for bicycles.
The adoption of electric bicycles is high, as electric bikes are safe, simple to use, and require little maintenance. Demand for bicycles is rising considerably in industrialized nations for both cargo bikes and electric bikes. This is going to inspire the affiliated businesses to create a variety of cutting-edge paddle cycle products.
The need for daily commute vehicles has increased with the rise of shared mobility businesses. Furthermore, these bikes do not require a driver's license. Clients of all ages can use them, which increases the demand for bicycles.
Attributes | Details |
---|---|
Projected Forecast Value (2022) | US$ 1,300 million |
Projected Forecast Value (2023) | US$ 2,650.23 million |
Projected Forecast Value (2033) | US$ 6,229.4 million |
Growth rate | 8.92% CAGR |
Forecast period | 2023 to 2033 |
Don't pay for what you don't need
Customize your report by selecting specific countries or regions and save 30%!
The global bicycle market expanded at a CAGR of 7.42% between 2018 and 2022. Growth forecasts remain optimistic, with the market predicted to exhibit a CAGR of 8.92% between 2023 and 2033.
Contemporary advancements in the development of mobile apps and global positioning systems (GPS) have thus resulted in app-based dockless bicycle-sharing systems. Further, growth in the adoption of such dockless bicycle-sharing systems is estimated to fuel the demand for cycles significantly.
Developments in GPS technology and Mobile App Development
Recent developments in GPS technology and mobile app development have led to dockless bicycle-sharing programs that are app-based. Furthermore, it is projected that the widespread use of such dockless bicycle-sharing systems greatly increases demand for bicycles.
Chinese bike-sharing companies are significantly investing in and growing their operations in countries in Europe to take advantage of the bicycle market prospects. This should accelerate bicycle market expansion during the forecast period.
Increase in the Sales of Road and Mountain Bicycles
The bicycle market is set to expand as many individuals turn to cycling as regular a method of exercise. The popularity of these vehicles is further increased by events like the Tour de France and the Ronde van Vlaanderen. These events provide many opportunities for the bicycle market.
Sales of road and mountain bicycles are being boosted by an increase in cycling competitions that are being held in numerous nations around Asia, Africa, and the Middle East. Further, people are considering using bicycles to commute for short distances to save time, due to the increasing traffic congestion and lack of parking, especially in metropolitan areas.
The infrastructure required to facilitate bicycle commuting is aggressively being built by many governments at the same time, which encourages the demand for bicycles. It is projected that the lack of the infrastructure required to support and promote bicycle commuting, particularly in developing nations like India, impedes the bicycle market's expansion. This is detrimental to the bicycle market growth, much as how expensive lightweight bicycles made of composite materials are.
Demand for both general and sports bicycles is anticipated to increase due to the growing benefits of bicycles in recreational and trekking activities, as well as an increase in cycling competitions. It is anticipated that rising media attention to such events and the increasing power of celebrity endorsement might further propel bicycle market expansion.
It is anticipated that unforeseen supply chain interruptions in the automotive sector during the pandemic phase are posing serious obstacles to the bicycle market expansion. Tighter financial flows among the small-scale equipment distributor companies involved in this industry are the main source of these difficulties, impeding the bicycle market statistics.
Usage of vehicles is projected to increase as a result of the advent of numerous online bicycle booking platforms through web portals and mobile applications, such as Uber Bike, Yulu, and others, providing several opportunities in the bicycle market. Also, the bicycle market size is anticipated to increase as a result of additional reasons, like the rising rate of urbanization around the world and changing bicycle market trends.
According to FMI, the global bicycle market research report offers a thorough analysis of the industry and focuses on important factors like the top manufacturers, markets, suppliers, segments, and products.
Get the data you need at a Fraction of the cost
Personalize your report by choosing insights you need
and save 40%!
The road bicycle market, which had a revenue share of 70% is anticipated to continue to dominate during the projected period. These are the most fundamental vehicles and don't require any high-tech extras, such as those needed by racing, mountain, or other specialty bicycles, which can be credited to the increase.
The growing bicycle market trend of people personalizing road bicycles for certain uses is also anticipated to add to the segment's growth during the forecast period. The mountain bicycle category is anticipated to expand significantly as consumers, particularly millennials, continue to choose mountain biking as a form of adventure and leisure.
The men sector held a significant bicycle market share at 75%. As more males continue to ride bicycles than women or children, it is also anticipated that this segment might experience strong growth during the projected period.
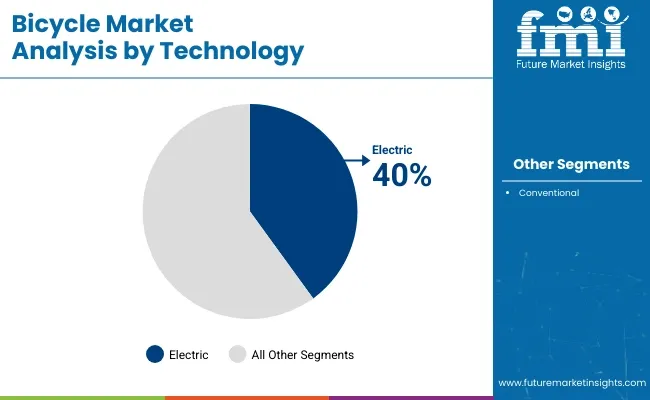
According to FMI, over 80.0% of the total revenue came from the conventional category, which is anticipated to hold its lead position in the bicycle market throughout the forecast period.
Numerous variables, including the low cost of maintenance and repair for traditional bicycles compared to electric bicycles, are responsible for the significant bicycle market share.
Growth of the bicycle market in North America is anticipated to be supported by significant consumer expenditure on outdoor recreational activities like paddle boarding, biking, and surfing in nations like the United States and Mexico. North America is expected to hold a market share of 42.8%.
Europe is anticipated to increase at a pace of 38.4% in the bicycle market. Some of the cities that are deemed perfect for bicycle commuting are found in Europe. Europe also hosts some well-known cycling competitions, including the Tour de France and Ronde van Vlaanderen.
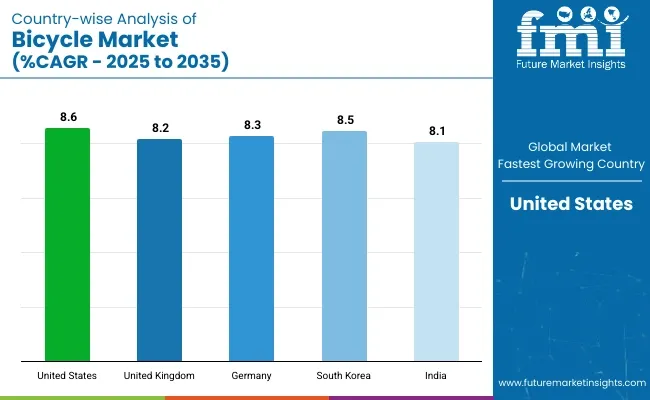
The United Kingdom has a dominant share in the market forecasted at 18.2%, and is vigorously building the infrastructure to support and promote bicycle commuting. Further, it is making a big contribution to the expansion of the bicycle market share.
Asia Pacific emerged as the dominant regional bicycle market with a revenue share exceeding 30.0%. China, Japan, and Singapore place a strong emphasis on building the infrastructure required to promote and support bicycle commuting. Asian town like Tokyo, which is renowned for having low accident rates is said to be the best for urban bicycling.
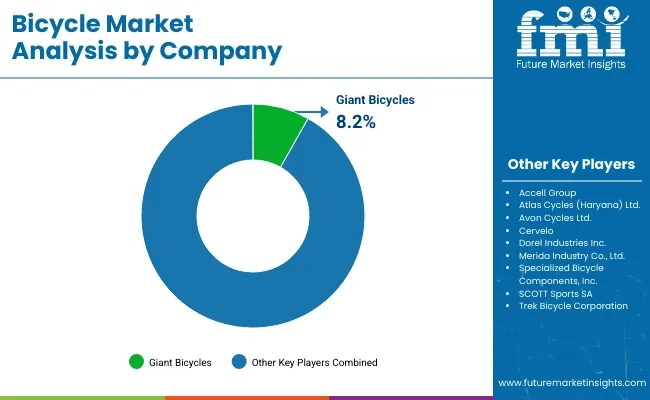
The global bicycle market growth is fragmented and diversified in its structure, as a result of the simple fact that there are numerous key participants in the industry. Leading bicycle market participants concentrate on providing clients with customized solutions, which results in a high switching cost for consumer businesses.
Key Players Profiled in the Market
Report Attributes | Details |
---|---|
Growth Rate | CAGR of 8.92% from 2023 to 2033 |
Base Year for Estimation | 2022 |
Historical Data | 2018 to 2022 |
Forecast Period | 2023 to 2033 |
Quantitative Units | Revenue in US$ million and CAGR from 2023 to 2033 |
Report Coverage | Revenue Forecast, Volume Forecast, Company Ranking, Competitive Landscape, Growth Factors, Trends, and Pricing Analysis |
Segments Covered |
|
Regions Covered |
|
Key Countries Profiled |
|
Key Companies Profiled |
|
Customization | Available Upon Request |
Asia Pacific generated 62% of the global demand for bicycles in 2022.
Asia Pacific market to grow at 8.92% CAGR through 2033.
The steel material type segment contributes 60% of total production.
The mountain bikes segment holds 25% of the global market share.
From 2018 to 2022, the global market exhibited a 7.42% CAGR.
1. Executive Summary
1.1. Global Market Outlook
1.2. Demand-side Trends
1.3. Supply-side Trends
1.4. Technology Roadmap Analysis
1.5. Analysis and Recommendations
2. Market Overview
2.1. Market Coverage / Taxonomy
2.2. Market Definition / Scope / Limitations
3. Market Background
3.1. Market Dynamics
3.1.1. Drivers
3.1.2. Restraints
3.1.3. Opportunity
3.1.4. Trends
3.2. Scenario Forecast
3.2.1. Demand in Optimistic Scenario
3.2.2. Demand in Likely Scenario
3.2.3. Demand in Conservative Scenario
3.3. Opportunity Map Analysis
3.4. Product Life Cycle Analysis
3.5. Supply Chain Analysis
3.5.1. Supply Side Participants and their Roles
3.5.1.1. Producers
3.5.1.2. Mid-Level Participants (Traders/ Agents/ Brokers)
3.5.1.3. Wholesalers and Distributors
3.5.2. Value Added and Value Created at Node in the Supply Chain
3.5.3. List of Raw Material Suppliers
3.5.4. List of Existing and Potential Buyer’s
3.6. Investment Feasibility Matrix
3.7. Value Chain Analysis
3.7.1. Profit Margin Analysis
3.7.2. Wholesalers and Distributors
3.7.3. Retailers
3.8. PESTLE and Porter’s Analysis
3.9. Regulatory Landscape
3.9.1. By Key Regions
3.9.2. By Key Countries
3.10. Regional Parent Market Outlook
3.11. Production and Consumption Statistics
3.12. Import and Export Statistics
4. Global Market Analysis 2018 to 2022 and Forecast, 2023 to 2033
4.1. Historical Market Size Value (US$ Million) & Volume (Units) Analysis, 2018 to 2022
4.2. Current and Future Market Size Value (US$ Million) & Volume (Units) Projections, 2023 to 2033
4.2.1. Y-o-Y Growth Trend Analysis
4.2.2. Absolute $ Opportunity Analysis
5. Global Market Analysis 2018 to 2022 and Forecast 2023 to 2033, By Product Type
5.1. Introduction / Key Findings
5.2. Historical Market Size Value (US$ Million) & Volume (Units) Analysis By Product Type, 2018 to 2022
5.3. Current and Future Market Size Value (US$ Million) & Volume (Units) Analysis and Forecast By Product Type, 2023 to 2033
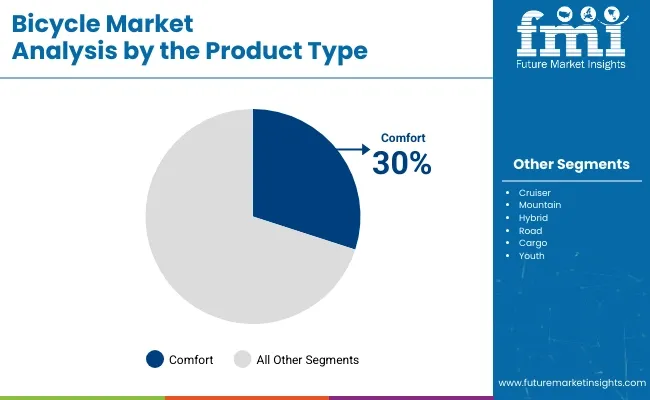
5.3.1. Comfort
5.3.2. Cruiser
5.3.3. Mountain
5.3.4. Hybrid
5.3.5. Road
5.3.6. Cargo
5.3.7. Youth
5.4. Y-o-Y Growth Trend Analysis By Product Type, 2018 to 2022
5.5. Absolute $ Opportunity Analysis By Product Type, 2023 to 2033
6. Global Market Analysis 2018 to 2022 and Forecast 2023 to 2033, By Technology
6.1. Introduction / Key Findings
6.2. Historical Market Size Value (US$ Million) & Volume (Units) Analysis By Technology, 2018 to 2022
6.3. Current and Future Market Size Value (US$ Million) & Volume (Units) Analysis and Forecast By Technology, 2023 to 2033
6.3.1. Electric
6.3.2. Conventional
6.4. Y-o-Y Growth Trend Analysis By Technology, 2018 to 2022
6.5. Absolute $ Opportunity Analysis By Technology, 2023 to 2033
7. Global Market Analysis 2018 to 2022 and Forecast 2023 to 2033, By Price
7.1. Introduction / Key Findings
7.2. Historical Market Size Value (US$ Million) & Volume (Units) Analysis By Price, 2018 to 2022
7.3. Current and Future Market Size Value (US$ Million) & Volume (Units) Analysis and Forecast By Price, 2023 to 2033
7.3.1. Low Range
7.3.2. Medium range
7.3.3. Premium
7.4. Y-o-Y Growth Trend Analysis By Price, 2018 to 2022
7.5. Absolute $ Opportunity Analysis By Price, 2023 to 2033
8. Global Market Analysis 2018 to 2022 and Forecast 2023 to 2033, By End User
8.1. Introduction / Key Findings
8.2. Historical Market Size Value (US$ Million) & Volume (Units) Analysis By End User, 2018 to 2022
8.3. Current and Future Market Size Value (US$ Million) & Volume (Units) Analysis and Forecast By End User, 2023 to 2033
8.3.1. Kids
8.3.2. Men
8.3.3. Women
8.4. Y-o-Y Growth Trend Analysis By End User, 2018 to 2022
8.5. Absolute $ Opportunity Analysis By End User, 2023 to 2033
9. Global Market Analysis 2018 to 2022 and Forecast 2023 to 2033, By Region
9.1. Introduction
9.2. Historical Market Size Value (US$ Million) & Volume (Units) Analysis By Region, 2018 to 2022
9.3. Current Market Size Value (US$ Million) & Volume (Units) Analysis and Forecast By Region, 2023 to 2033
9.3.1. North America
9.3.2. Latin America
9.3.3. Western Europe
9.3.4. Eastern Europe
9.3.5. South Asia and Pacific
9.3.6. East Asia
9.3.7. Middle East and Africa
9.4. Market Attractiveness Analysis By Region
10. North America Market Analysis 2018 to 2022 and Forecast 2023 to 2033, By Country
10.1. Historical Market Size Value (US$ Million) & Volume (Units) Trend Analysis By Market Taxonomy, 2018 to 2022
10.2. Market Size Value (US$ Million) & Volume (Units) Forecast By Market Taxonomy, 2023 to 2033
10.2.1. By Country
10.2.1.1. U.S.
10.2.1.2. Canada
10.2.2. By Product Type
10.2.3. By Technology
10.2.4. By Price
10.2.5. By End User
10.3. Market Attractiveness Analysis
10.3.1. By Country
10.3.2. By Product Type
10.3.3. By Technology
10.3.4. By Price
10.3.5. By End User
10.4. Key Takeaways
11. Latin America Market Analysis 2018 to 2022 and Forecast 2023 to 2033, By Country
11.1. Historical Market Size Value (US$ Million) & Volume (Units) Trend Analysis By Market Taxonomy, 2018 to 2022
11.2. Market Size Value (US$ Million) & Volume (Units) Forecast By Market Taxonomy, 2023 to 2033
11.2.1. By Country
11.2.1.1. Brazil
11.2.1.2. Mexico
11.2.1.3. Rest of Latin America
11.2.2. By Product Type
11.2.3. By Technology
11.2.4. By Price
11.2.5. By End User
11.3. Market Attractiveness Analysis
11.3.1. By Country
11.3.2. By Product Type
11.3.3. By Technology
11.3.4. By Price
11.3.5. By End User
11.4. Key Takeaways
12. Western Europe Market Analysis 2018 to 2022 and Forecast 2023 to 2033, By Country
12.1. Historical Market Size Value (US$ Million) & Volume (Units) Trend Analysis By Market Taxonomy, 2018 to 2022
12.2. Market Size Value (US$ Million) & Volume (Units) Forecast By Market Taxonomy, 2023 to 2033
12.2.1. By Country
12.2.1.1. Germany
12.2.1.2. U.K.
12.2.1.3. France
12.2.1.4. Spain
12.2.1.5. Italy
12.2.1.6. Rest of Western Europe
12.2.2. By Product Type
12.2.3. By Technology
12.2.4. By Price
12.2.5. By End User
12.3. Market Attractiveness Analysis
12.3.1. By Country
12.3.2. By Product Type
12.3.3. By Technology
12.3.4. By Price
12.3.5. By End User
12.4. Key Takeaways
13. Eastern Europe Market Analysis 2018 to 2022 and Forecast 2023 to 2033, By Country
13.1. Historical Market Size Value (US$ Million) & Volume (Units) Trend Analysis By Market Taxonomy, 2018 to 2022
13.2. Market Size Value (US$ Million) & Volume (Units) Forecast By Market Taxonomy, 2023 to 2033
13.2.1. By Country
13.2.1.1. Poland
13.2.1.2. Russia
13.2.1.3. Czech Republic
13.2.1.4. Romania
13.2.1.5. Rest of Eastern Europe
13.2.2. By Product Type
13.2.3. By Technology
13.2.4. By Price
13.2.5. By End User
13.3. Market Attractiveness Analysis
13.3.1. By Country
13.3.2. By Product Type
13.3.3. By Technology
13.3.4. By Price
13.3.5. By End User
13.4. Key Takeaways
14. South Asia and Pacific Market Analysis 2018 to 2022 and Forecast 2023 to 2033, By Country
14.1. Historical Market Size Value (US$ Million) & Volume (Units) Trend Analysis By Market Taxonomy, 2018 to 2022
14.2. Market Size Value (US$ Million) & Volume (Units) Forecast By Market Taxonomy, 2023 to 2033
14.2.1. By Country
14.2.1.1. India
14.2.1.2. Bangladesh
14.2.1.3. Australia
14.2.1.4. New Zealand
14.2.1.5. Rest of South Asia and Pacific
14.2.2. By Product Type
14.2.3. By Technology
14.2.4. By Price
14.2.5. By End User
14.3. Market Attractiveness Analysis
14.3.1. By Country
14.3.2. By Product Type
14.3.3. By Technology
14.3.4. By Price
14.3.5. By End User
14.4. Key Takeaways
15. East Asia Market Analysis 2018 to 2022 and Forecast 2023 to 2033, By Country
15.1. Historical Market Size Value (US$ Million) & Volume (Units) Trend Analysis By Market Taxonomy, 2018 to 2022
15.2. Market Size Value (US$ Million) & Volume (Units) Forecast By Market Taxonomy, 2023 to 2033
15.2.1. By Country
15.2.1.1. China
15.2.1.2. Japan
15.2.1.3. South Korea
15.2.2. By Product Type
15.2.3. By Technology
15.2.4. By Price
15.2.5. By End User
15.3. Market Attractiveness Analysis
15.3.1. By Country
15.3.2. By Product Type
15.3.3. By Technology
15.3.4. By Price
15.3.5. By End User
15.4. Key Takeaways
16. Middle East and Africa Market Analysis 2018 to 2022 and Forecast 2023 to 2033, By Country
16.1. Historical Market Size Value (US$ Million) & Volume (Units) Trend Analysis By Market Taxonomy, 2018 to 2022
16.2. Market Size Value (US$ Million) & Volume (Units) Forecast By Market Taxonomy, 2023 to 2033
16.2.1. By Country
16.2.1.1. GCC Countries
16.2.1.2. South Africa
16.2.1.3. Israel
16.2.1.4. Rest of MEA
16.2.2. By Product Type
16.2.3. By Technology
16.2.4. By Price
16.2.5. By End User
16.3. Market Attractiveness Analysis
16.3.1. By Country
16.3.2. By Product Type
16.3.3. By Technology
16.3.4. By Price
16.3.5. By End User
16.4. Key Takeaways
17. Key Countries Market Analysis
17.1. U.S.
17.1.1. Pricing Analysis
17.1.2. Market Share Analysis, 2022
17.1.2.1. By Product Type
17.1.2.2. By Technology
17.1.2.3. By Price
17.1.2.4. By End User
17.2. Canada
17.2.1. Pricing Analysis
17.2.2. Market Share Analysis, 2022
17.2.2.1. By Product Type
17.2.2.2. By Technology
17.2.2.3. By Price
17.2.2.4. By End User
17.3. Brazil
17.3.1. Pricing Analysis
17.3.2. Market Share Analysis, 2022
17.3.2.1. By Product Type
17.3.2.2. By Technology
17.3.2.3. By Price
17.3.2.4. By End User
17.4. Mexico
17.4.1. Pricing Analysis
17.4.2. Market Share Analysis, 2022
17.4.2.1. By Product Type
17.4.2.2. By Technology
17.4.2.3. By Price
17.4.2.4. By End User
17.5. Germany
17.5.1. Pricing Analysis
17.5.2. Market Share Analysis, 2022
17.5.2.1. By Product Type
17.5.2.2. By Technology
17.5.2.3. By Price
17.5.2.4. By End User
17.6. U.K.
17.6.1. Pricing Analysis
17.6.2. Market Share Analysis, 2022
17.6.2.1. By Product Type
17.6.2.2. By Technology
17.6.2.3. By Price
17.6.2.4. By End User
17.7. France
17.7.1. Pricing Analysis
17.7.2. Market Share Analysis, 2022
17.7.2.1. By Product Type
17.7.2.2. By Technology
17.7.2.3. By Price
17.7.2.4. By End User
17.8. Spain
17.8.1. Pricing Analysis
17.8.2. Market Share Analysis, 2022
17.8.2.1. By Product Type
17.8.2.2. By Technology
17.8.2.3. By Price
17.8.2.4. By End User
17.9. Italy
17.9.1. Pricing Analysis
17.9.2. Market Share Analysis, 2022
17.9.2.1. By Product Type
17.9.2.2. By Technology
17.9.2.3. By Price
17.9.2.4. By End User
17.10. Poland
17.10.1. Pricing Analysis
17.10.2. Market Share Analysis, 2022
17.10.2.1. By Product Type
17.10.2.2. By Technology
17.10.2.3. By Price
17.10.2.4. By End User
17.11. Russia
17.11.1. Pricing Analysis
17.11.2. Market Share Analysis, 2022
17.11.2.1. By Product Type
17.11.2.2. By Technology
17.11.2.3. By Price
17.11.2.4. By End User
17.12. Czech Republic
17.12.1. Pricing Analysis
17.12.2. Market Share Analysis, 2022
17.12.2.1. By Product Type
17.12.2.2. By Technology
17.12.2.3. By Price
17.12.2.4. By End User
17.13. Romania
17.13.1. Pricing Analysis
17.13.2. Market Share Analysis, 2022
17.13.2.1. By Product Type
17.13.2.2. By Technology
17.13.2.3. By Price
17.13.2.4. By End User
17.14. India
17.14.1. Pricing Analysis
17.14.2. Market Share Analysis, 2022
17.14.2.1. By Product Type
17.14.2.2. By Technology
17.14.2.3. By Price
17.14.2.4. By End User
17.15. Bangladesh
17.15.1. Pricing Analysis
17.15.2. Market Share Analysis, 2022
17.15.2.1. By Product Type
17.15.2.2. By Technology
17.15.2.3. By Price
17.15.2.4. By End User
17.16. Australia
17.16.1. Pricing Analysis
17.16.2. Market Share Analysis, 2022
17.16.2.1. By Product Type
17.16.2.2. By Technology
17.16.2.3. By Price
17.16.2.4. By End User
17.17. New Zealand
17.17.1. Pricing Analysis
17.17.2. Market Share Analysis, 2022
17.17.2.1. By Product Type
17.17.2.2. By Technology
17.17.2.3. By Price
17.17.2.4. By End User
17.18. China
17.18.1. Pricing Analysis
17.18.2. Market Share Analysis, 2022
17.18.2.1. By Product Type
17.18.2.2. By Technology
17.18.2.3. By Price
17.18.2.4. By End User
17.19. Japan
17.19.1. Pricing Analysis
17.19.2. Market Share Analysis, 2022
17.19.2.1. By Product Type
17.19.2.2. By Technology
17.19.2.3. By Price
17.19.2.4. By End User
17.20. South Korea
17.20.1. Pricing Analysis
17.20.2. Market Share Analysis, 2022
17.20.2.1. By Product Type
17.20.2.2. By Technology
17.20.2.3. By Price
17.20.2.4. By End User
17.21. GCC Countries
17.21.1. Pricing Analysis
17.21.2. Market Share Analysis, 2022
17.21.2.1. By Product Type
17.21.2.2. By Technology
17.21.2.3. By Price
17.21.2.4. By End User
17.22. South Africa
17.22.1. Pricing Analysis
17.22.2. Market Share Analysis, 2022
17.22.2.1. By Product Type
17.22.2.2. By Technology
17.22.2.3. By Price
17.22.2.4. By End User
17.23. Israel
17.23.1. Pricing Analysis
17.23.2. Market Share Analysis, 2022
17.23.2.1. By Product Type
17.23.2.2. By Technology
17.23.2.3. By Price
17.23.2.4. By End User
18. Market Structure Analysis
18.1. Competition Dashboard
18.2. Competition Benchmarking
18.3. Market Share Analysis of Top Players
18.3.1. By Regional
18.3.2. By Product Type
18.3.3. By Technology
18.3.4. By Price
18.3.5. By End User
19. Competition Analysis
19.1. Competition Deep Dive
19.1.1. Accell Group
19.1.1.1. Overview
19.1.1.2. Product Portfolio
19.1.1.3. Profitability by Market Segments
19.1.1.4. Sales Footprint
19.1.1.5. Strategy Overview
19.1.1.5.1. Marketing Strategy
19.1.1.5.2. Product Strategy
19.1.1.5.3. Channel Strategy
19.1.2. Atlas Cycles (Haryana) Ltd.
19.1.2.1. Overview
19.1.2.2. Product Portfolio
19.1.2.3. Profitability by Market Segments
19.1.2.4. Sales Footprint
19.1.2.5. Strategy Overview
19.1.2.5.1. Marketing Strategy
19.1.2.5.2. Product Strategy
19.1.2.5.3. Channel Strategy
19.1.3. Avon Cycles Ltd.
19.1.3.1. Overview
19.1.3.2. Product Portfolio
19.1.3.3. Profitability by Market Segments
19.1.3.4. Sales Footprint
19.1.3.5. Strategy Overview
19.1.3.5.1. Marketing Strategy
19.1.3.5.2. Product Strategy
19.1.3.5.3. Channel Strategy
19.1.4. Cervelo
19.1.4.1. Overview
19.1.4.2. Product Portfolio
19.1.4.3. Profitability by Market Segments
19.1.4.4. Sales Footprint
19.1.4.5. Strategy Overview
19.1.4.5.1. Marketing Strategy
19.1.4.5.2. Product Strategy
19.1.4.5.3. Channel Strategy
19.1.5. Dorel Industries Inc.
19.1.5.1. Overview
19.1.5.2. Product Portfolio
19.1.5.3. Profitability by Market Segments
19.1.5.4. Sales Footprint
19.1.5.5. Strategy Overview
19.1.5.5.1. Marketing Strategy
19.1.5.5.2. Product Strategy
19.1.5.5.3. Channel Strategy
19.1.6. Giant Bicycles
19.1.6.1. Overview
19.1.6.2. Product Portfolio
19.1.6.3. Profitability by Market Segments
19.1.6.4. Sales Footprint
19.1.6.5. Strategy Overview
19.1.6.5.1. Marketing Strategy
19.1.6.5.2. Product Strategy
19.1.6.5.3. Channel Strategy
19.1.7. Merida Industry Co., Ltd.
19.1.7.1. Overview
19.1.7.2. Product Portfolio
19.1.7.3. Profitability by Market Segments
19.1.7.4. Sales Footprint
19.1.7.5. Strategy Overview
19.1.7.5.1. Marketing Strategy
19.1.7.5.2. Product Strategy
19.1.7.5.3. Channel Strategy
19.1.8. Specialized Components, Inc.
19.1.8.1. Overview
19.1.8.2. Product Portfolio
19.1.8.3. Profitability by Market Segments
19.1.8.4. Sales Footprint
19.1.8.5. Strategy Overview
19.1.8.5.1. Marketing Strategy
19.1.8.5.2. Product Strategy
19.1.8.5.3. Channel Strategy
19.1.9. SCOTT Sports SA
19.1.9.1. Overview
19.1.9.2. Product Portfolio
19.1.9.3. Profitability by Market Segments
19.1.9.4. Sales Footprint
19.1.9.5. Strategy Overview
19.1.9.5.1. Marketing Strategy
19.1.9.5.2. Product Strategy
19.1.9.5.3. Channel Strategy
19.1.10. Trek Corporation
19.1.10.1. Overview
19.1.10.2. Product Portfolio
19.1.10.3. Profitability by Market Segments
19.1.10.4. Sales Footprint
19.1.10.5. Strategy Overview
19.1.10.5.1. Marketing Strategy
19.1.10.5.2. Product Strategy
19.1.10.5.3. Channel Strategy
20. Assumptions & Acronyms Used
21. Research Methodology
Explore Automotive Insights
View Reports