The Bedless Hospitals Market is estimated to be valued at USD 1.1 billion in 2025 and is projected to reach USD 2.0 billion by 2035, registering a compound annual growth rate (CAGR) of 6.5% over the forecast period.
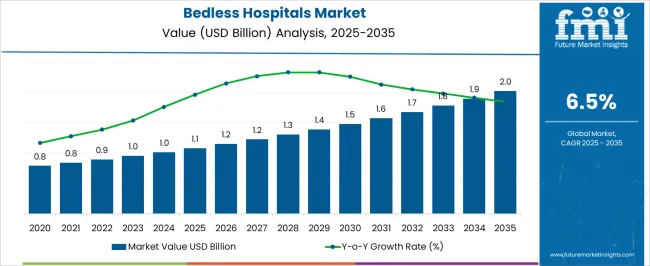
| Metric | Value |
|---|---|
| Bedless Hospitals Market Estimated Value in (2025 E) | USD 1.1 billion |
| Bedless Hospitals Market Forecast Value in (2035 F) | USD 2.0 billion |
| Forecast CAGR (2025 to 2035) | 6.5% |
The Bedless Hospitals market is being driven by a shift toward outpatient care models that reduce the need for inpatient stays while providing high-quality healthcare services. The current market scenario reflects a growing preference for healthcare facilities that prioritize efficiency, patient convenience, and cost optimization. Increasing healthcare expenditure, a rising geriatric population, and technological advancements in diagnostic tools are contributing to this trend.
Bedless hospitals are being preferred for their ability to deliver specialized services without requiring overnight stays, thereby lowering operational costs and improving patient throughput. The future outlook for the market is strengthened by the focus on preventive care, early diagnosis, and the integration of digital health records that allow faster care coordination.
Moreover, healthcare providers are increasingly leveraging advanced imaging and laboratory technologies, which support same-day diagnostics and treatment The expanding network of outpatient centers and diagnostic hubs is expected to create further growth opportunities, especially in urban and semi-urban areas where patients are seeking accessible and affordable care options.
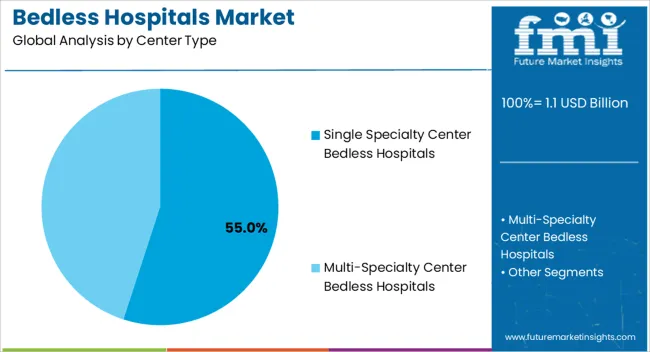
The Single Specialty Center segment is projected to hold 55.00% of the Center Type share in the Bedless Hospitals market in 2025, making it the leading category. This prominence has been driven by the growing demand for focused care solutions that address specific health concerns with improved efficiency and lower cost.
Healthcare providers have been encouraged to adopt single specialty centers as they allow better utilization of medical resources, specialized staff, and targeted treatment protocols. The segment’s growth has been further supported by the increasing number of outpatient procedures, which do not require overnight hospitalization but still need expert intervention.
Additionally, the preference for streamlined patient pathways and faster diagnosis has accelerated the adoption of this model, particularly in urban regions where patient volumes are high The ability to integrate advanced diagnostic tools with specialized treatment plans has contributed to enhancing patient outcomes while reducing hospital stays, making this segment increasingly attractive to healthcare administrators and investors.
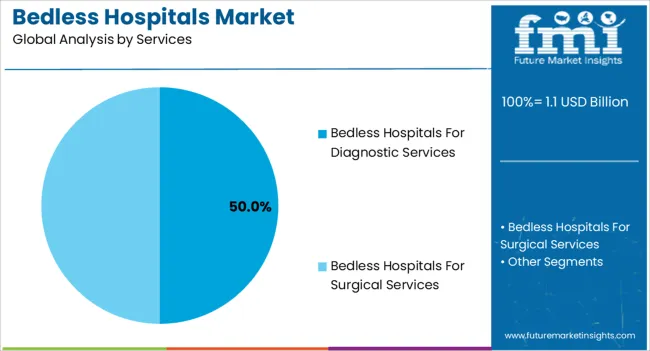
The Bedless Hospitals for Diagnostic Services segment is expected to account for 50.00% of the Services share in the Bedless Hospitals market in 2025, making it the largest category. The dominance of this segment is being attributed to the increasing reliance on advanced imaging, pathology, and laboratory tests that enable early detection and accurate diagnosis without the need for prolonged hospitalization.
The segment’s expansion has been driven by patient demand for quicker access to diagnostic solutions, coupled with healthcare systems’ focus on cost reduction and resource optimization. Integration with telehealth platforms, portable imaging devices, and AI-supported diagnostic algorithms has further enhanced the feasibility of providing high-quality diagnostic services in outpatient settings.
Moreover, the growing incidence of lifestyle-related diseases and chronic conditions has increased the need for frequent screenings, driving patient volumes to diagnostic-focused bedless facilities These hospitals have been favored for their ability to streamline workflows, reduce patient wait times, and ensure faster clinical decision-making while improving patient experience.
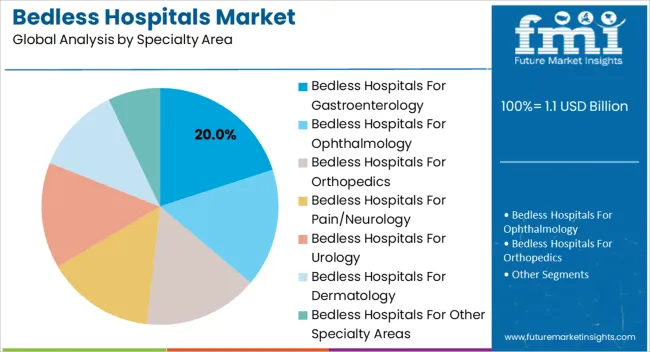
The Bedless Hospitals for Gastroenterology segment is expected to hold 20.00% of the Specialty Area share in the Bedless Hospitals market in 2025, positioning it as a key contributor. This segment’s growth has been supported by the rising prevalence of gastrointestinal disorders such as irritable bowel syndrome, fatty liver disease, and acid reflux, which require specialized interventions without necessitating extended hospitalization. The ability to offer endoscopic procedures, liver function tests, and gastrointestinal therapies in outpatient settings has made this model highly efficient and patient-friendly.
Advances in minimally invasive techniques and improved sedation protocols have further enabled procedures to be completed on the same day, reducing patient discomfort and enhancing recovery time. Additionally, the increasing awareness of lifestyle factors affecting gastrointestinal health has led to higher screening rates and preventive care visits.
Hospitals specializing in gastroenterology have been able to leverage technology-driven diagnostics and patient monitoring tools, ensuring personalized care while optimizing operational costs As patient expectations continue to evolve toward quicker, more comfortable treatments, this segment is anticipated to witness steady growth across both developed and emerging markets.
The bedless hospitals market is expected to increase significantly over the forecast period, as population expansion, cost-effective treatment, and other factors contribute to providing better treatment in a shorter time frame.
Players such as Montefiore Medical Center in New York City are treating patients as bedless hospitals. Technology innovation is also a big contributor to the global increase in the number of bedless hospitals. With enhanced technology, the process of treatment has become much easier and less time-consuming. Hence, the patients are simply required to stay for a short span of time.
This notion can assist patients to obtain care in adjacent community hospitals, avoiding unnecessary travel and the costs of inpatient stays at tertiary centers. Another advantage is that the danger of COVID-19 infection is reduced if patients stay for a short amount of time, allowing patients to be evaluated, begin treatment, and be discharged or sent to a nearby facility. Such advances are expected to boost the market for bedless hospitals during the forecast period.
On one hand, bedless hospitals do not require patients to be admitted for more than one day. Yet as the entire treatment is being done on a single day, these kinds of hospitals charge a huge amount of money for the entire procedure.
Also, the lump sum amount charged can also be accredited to the advanced technology being used during the procedure or the surgery. This becomes a hindrance for a lot of people and thus can impede the growth of the global market during the forecast period.
During the projected period of 2025 to 2035, the Ophthalmology segment is expected to dominate the market. With the rapid rise in various kinds of eye-related issues such as surgeries, the demand for bedless hospitals in the segment of ophthalmology is rising too.
| Segment | Ophthalmology Specialty Area |
|---|---|
| 2025 Value Share in Global Market | 51.2% |
The market growth can be attributed to the rising prevalence of optical disorders such as glaucoma, diabetic retinopathy, cataract, and vitreoretinal disorders, coupled with technological advancements in ophthalmic surgical as well as diagnostic instruments required for these target applications. Improved government initiatives to increase awareness related to visual impairment are further anticipated to widen the base for the bedless hospitals market growth.
From 2025 to 2035, the single specialty center segment is projected to lead the market. Single specialty centers focus on providing specialized medical services in a specific area, such as cardiology, orthopedics, or oncology. Their specialization allows them to develop deep expertise and provide high-quality, focused care to patients in need of specialized treatments. These centers operate efficiently by optimizing their resources, including equipment, staff, and facilities, resulting in shorter wait times and potentially lower costs compared to larger, multi-specialty hospitals.
| Segment | Single Specialty Center Type |
|---|---|
| 2025 Value Share in Global Market | 55.2% |
The convenience and accessibility of single specialty centers also play a role in their dominance. They are often located in easily accessible areas, reducing travel time and making it more convenient for patients to seek specialized care. Additionally, these centers often collaborate with other healthcare providers through referral networks, including general hospitals and primary care physicians. This collaboration ensures seamless coordination of patient care and facilitates the appropriate referral of patients to the specialized center.
In terms of market share and revenue, the North American market is expected to be the dominant market for bedless hospitals during the projection period of 2025 to 2035. The market of bedless hospitals in North America acquired a global market size of 53.5% in 2025.
This development can be attributed mostly to higher healthcare spending than in other regions, as well as a population that is more health-conscious. People in the USA have numerous medical insurance under which they must regularly monitor their health. This has resulted in an increase in the number of outpatient department services, as well as childcare procedures and surgeries. During the forecast period, such factors are expected to drive the need for bedless hospitals in this region.
In addition, numerous organizations have conducted campaigns and initiatives to raise awareness among the general public, doctors, and healthcare professionals about the need for comprehensive health and eye care in the diagnosis and treatment of various health conditions. Such activities serve to raise disease awareness and the availability of treatment in various bedless hospitals, which in turn supports the North American bedless hospital industry.
In 2025, Europe held about 27.7 % of the global market share. This region is expected to be one of the fastest-growing markets for bedless hospitals during the forecast period, 2025 to 2035.
Following the pandemic, the European government has prioritized childcare measures. The growing number of working parents, as well as the resulting demand for child care, are also predicted to boost the bedless hospital industry in Europe in the coming years.
There is a growing awareness of the link between parental employment, economic growth, and access to child care, which is predicted to boost the supply of low-cost childcare centers. As a result of these trends, the European market for bedless will grow in importance throughout the forecast period.
The Asia Pacific market for bedless hospitals is expected to grow steadily during the forecast period. The growth in the Asia Pacific region can be attributed to the growing geriatric population and also the rising number of diseases in various developing countries like India.
The various hospitals in India account for a large number of patients in their OPDs on a daily basis. The medical industry here is developing rapidly and thus there is a booming demand for bedless hospitals with the rising demand for OPD services. Such demand can bolster the market and make it the fastest-growing bedless hospital market during the forecast period.
| Countries | 2025 Value Share in Global Market |
|---|---|
| United States | 50.4% |
| Germany | 5.8% |
| Japan | 2.9% |
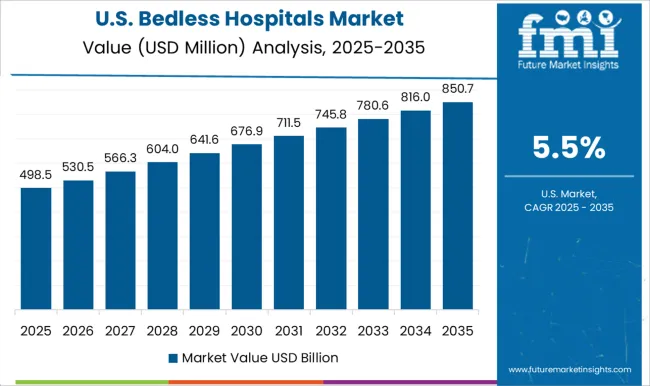
The United States bedless hospitals market has been experiencing significant growth and transformation in recent years. The country is witnessing a shift from the traditional fee-for-service model to value-based care. Bedless hospitals align with this shift by emphasizing preventative care, remote patient monitoring, and personalized treatment plans. Chronic diseases, such as diabetes, hypertension, and cardiovascular conditions, are prevalent in the United States.
Bedless hospitals focus on chronic disease management through remote monitoring, medication adherence support, and lifestyle interventions, leading to better health outcomes and reduced healthcare costs. The rising healthcare costs in the country are also significant drivers for the adoption of bedless hospitals. By minimizing inpatient stays and utilizing virtual care models, bedless hospitals offer a cost-effective solution for healthcare delivery.
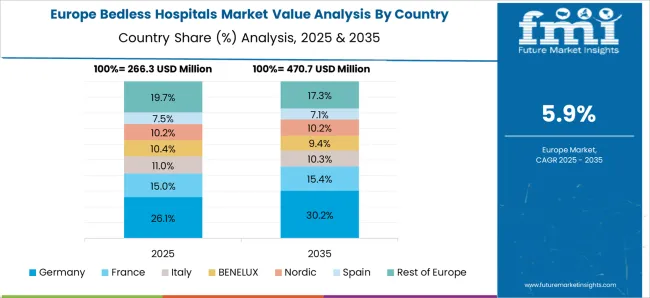
Like many developed nations, Germany is facing a rising burden of chronic diseases such as diabetes, cardiovascular diseases, and respiratory disorders. The focus on chronic disease management is driving the demand for bedless hospital services. Germany is known for its strong emphasis on technological innovation in healthcare. The country has witnessed advancements in electronic health records.
These technologies enable healthcare providers to offer virtual consultations, remote patient monitoring, and personalized care without the need for physical beds. The government has been actively promoting digital health solutions and telemedicine services. In 2020, the Digital Healthcare Act was introduced, which facilitated reimbursement for telemedicine services, including those provided by bedless hospitals.
The Japan bedless hospitals market is experiencing rapid growth. Japan is renowned for its technological innovation, and the bedless hospitals market is no exception. The country has embraced telemedicine, remote patient monitoring, artificial intelligence, and wearable devices to enable healthcare providers to deliver high-quality care outside of traditional hospital settings.
Japan faces the challenges of an aging population, resulting in a higher demand for healthcare services. Bedless hospitals offer a cost-effective solution for managing the healthcare needs of elderly patients. Japan has a strong tradition of home care, and bedless hospitals align well with this cultural aspect. The concept of receiving healthcare services at home is widely accepted and appreciated by patients and their families.
| Countries | Value CAGR (2025 to 2035) |
|---|---|
| United Kingdom | 4.7% |
| China | 8.2% |
| India | 6.7% |
The United Kingdom bedless hospitals market is witnessing a significant growth driven by technological advancements, a shift towards outpatient care, and the need for cost-effective healthcare solutions. The country is witnessing rapid technological advancements in healthcare, including the widespread adoption of electronic health records, telemedicine platforms, and wearable devices.
These technologies enable seamless communication between healthcare providers and patients, facilitating the growth of bedless hospitals. Remote patient monitoring technologies, such as wearable devices and connected health devices, are gaining popularity in the United Kingdom. These devices enable healthcare providers to monitor patients' vital signs, collect real-time data, and intervene proactively, reducing the need for hospitalizations. Bedless hospitals can leverage these technologies to effectively provide continuous care and manage chronic conditions.
The China bedless hospitals market is gaining traction as a result of the country's rapidly evolving healthcare sector. Consumers are increasingly seeking convenience and accessibility in healthcare services in China. China's massive population provides a significant market opportunity for bedless hospitals. Moreover, the country has witnessed a rapid increase in digital adoption, with a high percentage of the population using smartphones and accessing the internet.
This digital-savvy population is receptive to digital healthcare solutions, creating a conducive environment for the growth of bedless hospitals. The expansion of telemedicine in China has been fueled by the need for improved healthcare access, especially in remote and underserved areas. Bedless hospitals leverage telemedicine platforms to provide remote consultations, diagnosis, and prescription services.
India's urban population is rapidly increasing, leading to an upsurge in lifestyle-related diseases and healthcare demands. Bedless hospitals, with their focus on preventive care, chronic disease management, and outpatient services, cater to the evolving healthcare needs of urban residents. While the bedless hospitals market in India offers immense opportunities, it also faces challenges.
Connectivity issues in rural areas, the lack of skilled professionals for remote consultations, and the need for robust cybersecurity measures are some of the challenges that need to be addressed. However, technological advancements, increasing digital literacy, and favorable government policies present significant opportunities for growth.
The government has been actively promoting digital healthcare and telemedicine through initiatives such as the National Digital Health Mission. India has also become a popular destination for medical tourism due to its cost-effective and high-quality healthcare services, leading to market growth.
Glamyo Health, based in Delhi, is a multi-specialty healthcare startup that aims to provide a hassle-free experience for all elective surgeries and cosmetic procedures through personalized care. Glamyo Health claims to provide high-quality medical care, drugs, and food at a fraction of the market price. From consultations to post-surgery follow-ups, the startup provides a single point of contact and provides end-to-end services.
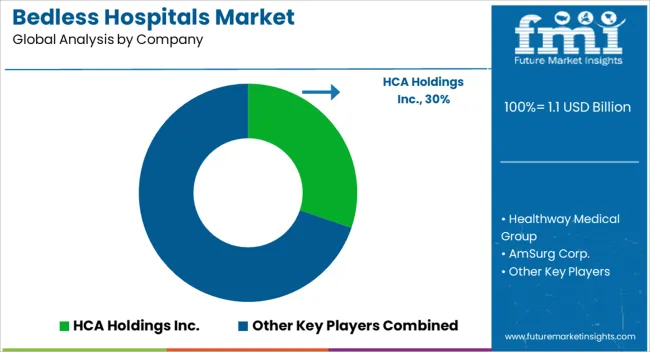
The key players in this market include Healthway Medical Group, AmSurg Corp., Medical Facilities Corporation, HCA Holdings Inc., Tenet Healthcare, Surgical Care Affiliates Inc., Surgery Partners, Community Health Systems, Inc., and Vision Group Holdings.
Key Companies Profiled
The global bedless hospitals market is estimated to be valued at USD 1.1 billion in 2025.
The market size for the bedless hospitals market is projected to reach USD 2.0 billion by 2035.
The bedless hospitals market is expected to grow at a 6.5% CAGR between 2025 and 2035.
The key product types in bedless hospitals market are single specialty center bedless hospitals and multi-specialty center bedless hospitals.
In terms of services, bedless hospitals for diagnostic services segment to command 50.0% share in the bedless hospitals market in 2025.


Full Research Suite comprises of:
Market outlook & trends analysis
Interviews & case studies
Strategic recommendations
Vendor profiles & capabilities analysis
5-year forecasts
8 regions and 60+ country-level data splits
Market segment data splits
12 months of continuous data updates
DELIVERED AS:
PDF EXCEL ONLINE
Micro-Hospitals Market
Veterinary Hospitals Revenue Analysis Growth – Trends & Forecast 2024-2034

Thank you!
You will receive an email from our Business Development Manager. Please be sure to check your SPAM/JUNK folder too.
Chat With
MaRIA