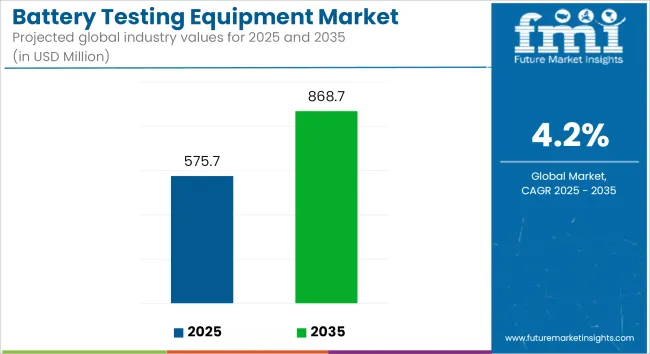
The global battery testing equipment market is projected to expand from USD 575.7 million in 2025 to USD 868.7 million by 2035, registering a compound annual growth rate (CAGR) of 4.2% over the forecast period. This growth is expected to be fueled by advancements in battery technologies used across electric vehicles (EVs), grid-scale energy storage systems (ESS), and portable electronic devices.
Substantial investments in battery manufacturing and energy storage infrastructure have been observed, leading to heightened demand for precision testing equipment. In January 2024, a 10 GWh battery storage facility was announced by LG Energy Solutions in the United States, along with a planned manufacturing complex targeting EV and ESS applications. These developments are anticipated to necessitate expanded validation protocols for safety, durability, and regulatory compliance.

| Attributes | Key Insights |
|---|---|
| Market Value, 2025 | USD 575.7 million |
| Market Value, 2035 | USD 868.7 million |
| Value CAGR (2025 to 2035) | 4.2% |
As battery deployment increases globally, the need for rigorous evaluation of thermal behavior, charge-discharge efficiency, and life-cycle durability has become paramount. Modern chemistries, including solid-state and next-generation lithium-ion batteries, are being tested under increasingly complex operational profiles. Greater emphasis is being placed on ensuring conformity to application-specific standards in automotive, aerospace, and renewable energy domains.
Real-time analytics, automated test benches, and AI-based validation platforms are being deployed to enhance test accuracy and reduce time-to-certification. A consistent rise in electric vehicle sales has reinforced this demand.
According to the International Energy Agency (IEA), electric vehicles accounted for 18% of total global car sales in 2023, compared to 14% in 2022. Of these, approximately 70% were battery-electric vehicles (BEVs), highlighting the central role of battery technologies in future mobility.
Battery testing systems are also being integrated into large-scale grid storage operations, where performance metrics such as long-duration cycling, energy efficiency, and degradation forecasting are critical. As battery production capacities continue to grow and chemistries diversify, robust testing infrastructure is expected to remain indispensable for quality assurance, certification, and long-term performance monitoring. Standardized protocols and safety benchmarks are likely to be reinforced across regulatory bodies to accommodate rapid technological evolution in battery systems.
The table below assesses how the growth trajectories have changed over the last year (2024) every year. Following a similar trend, it also briefs how these half-yearly trends will take shape in the current year (2025). H1 and H2 periods represent months from January to June and July to December, respectively, for particular years.
| Particulars | Value CAGR |
|---|---|
| H1 2024 | 3.6% (2024 to 2034) |
| H2 2024 | 3.8% (2024 to 2034) |
| H1 2025 | 4.1% (2025 to 2035) |
| H2 2025 | 4.2% (2025 to 2035) |
The market growth during the first half of 2024 was slow compared to the latter half. The slowdown in the sales of electronics products and automobiles has impacted the sales of these equipment, while developments in these sectors over the next half positively impacted the market with an increase in growth magnitude. Reflecting this trend in the current year. Comparatively, 50 and 40 BPS increment will be noticed in the first and second half of 2025, respectively.
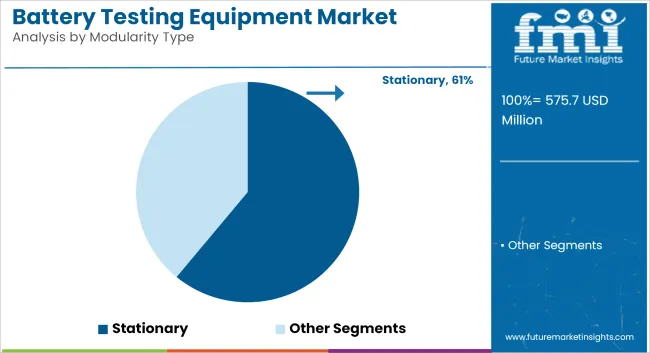
Stationary modular systems are projected to account for approximately 61% of the global modular system market by 2025, with the segment expected to grow at a CAGR of 4.4% from 2025 to 2035, outpacing the industry average of 4.2%. These systems are preferred for environments where consistent operation, durability, and integration with permanent infrastructure are required.
In clean manufacturing zones, laboratory environments, and controlled assembly areas, stationary systems offer superior airflow control, vibration isolation, and compatibility with fixed HVAC and filtration systems. Their application is being prioritized in semiconductor foundries, biotechnology labs, and automotive R&D centers where strict environmental standards must be maintained over long durations.
Despite higher initial installation costs, the reduced need for frequent relocation or reconfiguration makes stationary systems cost-effective over time. Moreover, industry standards such as ISO 14644, GMP, and FDA guidelines often favor fixed environmental control setups for audit and validation consistency.

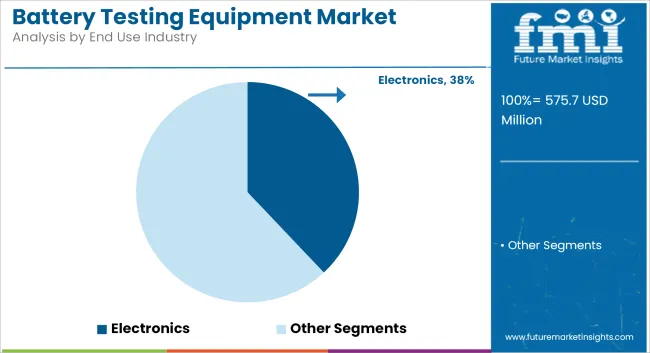
The electronics industry is expected to remain the leading end-use segment, capturing around 38% of total market share in 2025, with a projected CAGR of 4.6% through 2035. Modular systems are widely deployed in this sector for static-sensitive and contamination-prone processes including semiconductor lithography, PCB assembly, and display panel fabrication.
As chip sizes shrink and wafer purity standards tighten, electronics manufacturers are increasingly relying on modular environmental control systems-such as clean hoods, laminar airflow benches, and ESD-protected enclosures-to ensure defect-free production.
The rapid expansion of fabrication plants in Asia-Pacific and North America, fueled by government-backed semiconductor incentive programs, has accelerated system deployment. Portable variants are also gaining traction in temporary clean zones within multi-product lines, but large-scale, high-precision operations continue to favor stationary configurations. Integration with IoT-enabled monitoring and automated control systems is further enhancing traceability and environmental stability across the electronics manufacturing chain.

Battery recycling initiatives will drive demand for battery testing equipment
Reduce, reuse, and recycle are becoming a key sustainability trend across industries. Growing concerns towards environmental protection and safe disposal of hazardous chemicals in the environment have become paramount in order to meet carbon emission mitigation and sustainability targets.
The extent of battery usage across various industrial, consumer and automotive products have increased exponentially. It is believed that by the end-of-life of these products, enormous amounts of batteries will be available for recycling. Various governments and companies are keen on encouraging and implementing projects and schemes that meet recycling standards in accordance with environmental compliance.
For instance, on July 22, sustainability technology services provider SK tes received a grant from New South Wales (NSW) Environment Protection Authority (EPA) in Australia to recycle lithium-ion batteries decommissioned from solar energy storage systems and further utilize them in EV and portable devices. The company also received funding of USD 1.9 million under the NSW EPA Circular Solar Grants Program to initiate the operations.
Such initiatives and upcoming projects will drive the need for battery testing equipment to test battery recyclability features and ensure the quality of operations.
Increasing demand for wearable and IoT devices
Demand for consumer electronics especially wearable devices has increased considerably over the past years. The use and adoption of smart devices have gained considerable attention in the recent past. These devices operate in a sophisticated manner and are in direct contact with the users.
Any malfunctioning issue in such a scenario can severely harm the users. Typically, these compact or miniaturized devices run on high-performance batteries to ensure that they run for extended service life. These tests often require miniaturized battery testing equipment to carry out necessary tests. For instance, ZTS Inc. has launched a mini Multi-Battery Tester, which facilitates many tests for testing small batteries.
Similarly there are other miniature battery testing equipment available in the market that help in reliable testing of the batteries associated with wearable and IoT devices. Increasing sales of these products will positively impact demand for battery testing equipment across the globe, particularly in the consumer electronics and medical device manufacturing industry.
Investments in Grid-scale energy storage facilities to proliferate demand for battery testing equipment
Global energy consumption is on a consistent rise owing to urbanization rate and expanding industrial output across regions. The global energy consumption rate has reported an increase of 2.2% in 2023, and a similar trend is likely to continue over the upcoming decade. With the amounts of peak energy demand increasing across regions, governments and companies are investing in building up grid-scale energy storage facilities in order to cater to rising levels of demand.
For instance, in January 2024, LG Energy Solutions announced plans to build a storage facility of 10GW-hr in the USA. In addition, the company also plans to build a battery manufacturing complex to manufacture batteries for electric vehicles and energy storage systems.
Incidences of such investments are likely to increase in the near future, becoming a necessity to support industrial growth. These facilities require timely monitoring and maintenance to ensure uninterrupted functioning over the years, thus considerably prompting the requirement for advanced battery testing equipment.
Increasing demand for electric vehicles and substantial investments in charging infrastructure to boost battery testing equipment market
Demand for electric vehicles, particularly electric cars, is on a consistent rise. As per IEA, electric cars represented about 18% of the overall car sales worldwide in 2023, up from 14% of the figures for 2022. Of these, about 70% of cars are pure electric, and this number is likely to grow in the near future.
Increasing preference of consumers towards electrical technology supported by government incentives for green mobility is further expected to drive demand for these cars. In addition, investments in public and private charging infrastructure will further aid to market growth.
Electric vehicles utilize high-capacity lithium ion batteries designed to support rapid charging features. These product enhancements require batteries to be tested at high performance standards, such as cycle life, charging efficiency, thermal stability, and others.
The quality of batteries directly impacts the range and power delivery of the vehicle. Hence, it becomes very important that the batteries meet all the necessary and compliant features for enhanced and safe operations. Increasing sales of electric vehicles and replacement batteries will provide an additional boost to the demand for advanced battery testing equipment worldwide.
Historically between 2020 and 2024 the sales of battery testing equipment recorded CAGR of 3.6% representing a modest growth prospect for the manufacturers. During this period the industry was on recovery mode from COVID with slowed investment in construction sector and marginal growth in the automotive industry. In the past four years the battery sales remained substantial and the industry grew on the back of expansion in electric vehicles demand, energy storage solutions and consumer electronics.
Over the assessment period, the market is expected to witness a CAGR of 4.2% owing to commercialization of next generation and advanced battery technologies, regulatory push for sustainability and launch of AI integrated battery testing systems.
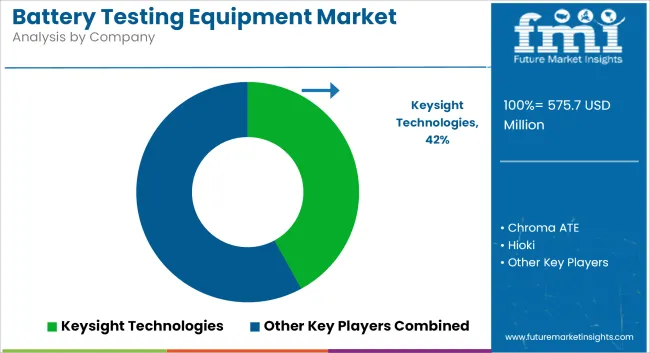
The market for battery testing equipment is fairly consolidated with established players commanding significant share in the market in terms of value. These players collectively hold about 50-55% share in the overall market. The product portfolio of these companies is mainly targeted towards high end applications of electric vehicles, aerospace and grid scale battery testing instruments or apparatus. Thus making them leading in terms of value share. Examples of such companies include Keysight Technologies, Chroma ATE, and Hioki.
The next level of market players collectively hold nearly 25 to 30% of the overall market. The product portfolio of these companies is niche and targeted in nature suiting some of the applications in electronics and renewable energy sector. Examples of such companies include Arbin Instruments, Digatron, and National Instruments.
The relatively fragmented part of the market comprise 15 to 20% of the overall market. The product portfolio of these companies is predominantly targeted towards cost effective solutions, start-ups, research laboratories or smaller manufacturers. Examples of such companies include Midtronics, Kikusui Electronics, and Landt Instruments.
As per the onset of industrial developments and growth prospects of energy storage industry, the demand outlook for battery testing equipment is quite prominent in leading countries as shown in the table below. Collectively these countries capture substantial share in the overall market and effectively contribute to overall market growth.
| Countries | Value CAGR (2025 to 2035) |
|---|---|
| USA | 3.7% |
| China | 5.5% |
| Germany | 3.2% |
| Japan | 2.8% |
| South Korea | 4.3% |
China leads the global market in both producing and consuming battery testing equipment because it dominates the production of batteries, especially for electric vehicles (EVs), consumer electronics, and renewable energy storage. The country has a huge manufacturing base and is home to major battery makers like CATL and BYD. This makes it a key consumer of testing equipment to ensure the quality and safety of batteries.
China also invests heavily in research and development (R&D) to improve battery technologies and create more efficient solutions. Government policies support the growth of industries such as electric vehicles and renewable energy, which further increases the need for reliable battery testing equipment.
The country’s ability to produce large quantities of high-quality batteries and the constant drive for innovation create a strong market for battery testing technologies. As a result, China plays a crucial role in shaping the global battery testing equipment industry, influencing both production and global demand.
The United States plays a crucial role in the production of battery testing equipment, driven by its strong presence in advanced technology and innovation. The USA is home to numerous companies that specialize in battery testing, particularly for electric vehicle (EV) batteries, renewable energy storage systems, and high-performance electronics. As the demand for EVs and renewable energy solutions grows, the need for reliable battery testing equipment has surged.
The USA boasts strong research and development (R&D) capabilities, which foster continuous advancements in battery testing technologies. These innovations are essential for meeting the performance, safety, and longevity standards required for modern batteries. Many USA-based companies lead in creating cutting-edge battery testing equipment that integrates the latest technologies such as automation, real-time monitoring, and artificial intelligence.
Key players in the market include Keysight Technologies, National Instruments, and Neware, which provide a range of solutions for testing batteries in electric vehicles, energy storage, and consumer electronics. These companies’ expertise in testing systems for precise measurements, battery management systems (BMS), and cycle testing positions the USA as a leader in the global battery testing equipment industry.
Germany is rapidly growing in the battery testing equipment market due to its strong automotive industry and focus on renewable energy. The country is a global leader in the automotive sector, with major companies like Volkswagen, BMW, and Mercedes-Benz driving demand for high-performance batteries, especially for electric vehicles (EVs). As Germany shifts toward electric mobility, there is an increasing need for reliable battery testing to ensure the safety, efficiency, and longevity of EV batteries.
Germany is also investing heavily in renewable energy technologies, particularly solar and wind power, which require energy storage systems. These systems rely on advanced batteries that need thorough testing to ensure they meet performance standards. This growing focus on sustainable energy drives the demand for testing equipment in the renewable energy sector.
Also, Germany's high-quality precision engineering and strong research and development capabilities have made it a leader in producing advanced battery testing technologies. Companies like AVL List GmbH and Test birds are at the forefront, creating specialized testing solutions for the automotive and industrial battery sectors. This combination of automotive strength, renewable energy focus, and technological innovation fuels Germany's growth in the battery testing equipment market.

In terms of Equipment Type, the industry is divided Hydrometers, Battery Monitoring Systems, Battery Voltage Monitor, Battery Capacity Tester, Ground Fault Simulator and Others
In terms of Modularity Type, the industry is divided into Stationary and Portable
In terms of End Use Industry, the industry is divided into Electronics, Automotive, Aerospace, Medical and Others.
Key countries of North America, Latin America, Western Europe, Eastern Europe, East Asia, South Asia, Middle East and Africa (MEA), have been covered in the report.
The global market was valued at USD 552.4 million in 2024.
The global market is set to reach USD 575.7 million in 2025.
Global demand is anticipated to rise at 4.2% CAGR.
The industry is projected to reach USD 868.7 million by 2035.
Keysight Technologies, Chroma ATE, Hioki, Arbin Instruments, Digatron National Instruments, Fluke, AMETEK INC., Midtronics, Kikusui Electronics Corporation. are prominent companies.


Full Research Suite comprises of:
Market outlook & trends analysis
Interviews & case studies
Strategic recommendations
Vendor profiles & capabilities analysis
5-year forecasts
8 regions and 60+ country-level data splits
Market segment data splits
12 months of continuous data updates
DELIVERED AS:
PDF EXCEL ONLINE
Battery Voltage Recorder Market Size and Share Forecast Outlook 2025 to 2035
Battery Resistance Tester Market Size and Share Forecast Outlook 2025 to 2035
Battery Technology Market Size and Share Forecast Outlook 2025 to 2035
Battery Electric Vehicle (BEV) Market Size and Share Forecast Outlook 2025 to 2035
Battery Separator Paper Market Size and Share Forecast Outlook 2025 to 2035
Battery Cyclers Market Size and Share Forecast Outlook 2025 to 2035
Battery Voltage Supervisor Market Size and Share Forecast Outlook 2025 to 2035
Battery Platforms Market Analysis Size and Share Forecast Outlook 2025 to 2035
Battery Management System Market Report – Growth & Forecast 2025-2035
Battery Binders Market Size and Share Forecast Outlook 2025 to 2035
Battery Materials Recycling Market Size and Share Forecast Outlook 2025 to 2035
Battery Packaging Material Market Size and Share Forecast Outlook 2025 to 2035
Battery Energy Storage System Industry Analysis by Battery Type, Connection Type, Ownership, Energy Capacity, Storage System, Application, and Region through 2025 to 2035
Battery Materials Market: Growth, Trends, and Future Opportunities
Battery Electrolytes Market Analysis & Forecast by Type, End-Use, and Region through 2035
Battery Swapping Charging Infrastructure Market Trends and Forecast 2025 to 2035
Battery Leasing Service Market Analysis & Forecast by Business Model, Battery Type, Vehicle Type, and Region Through 2025 to 2035
Battery-Free Sensors Market Insights - Trends & Forecast 2025 to 2035
Competitive Breakdown of Battery Management System Providers
Battery Operated Light Market Insights – Growth & Forecast 2024-2034

Thank you!
You will receive an email from our Business Development Manager. Please be sure to check your SPAM/JUNK folder too.
Chat With
MaRIA