Banana Puree Market Outlook (2023 to 2033)

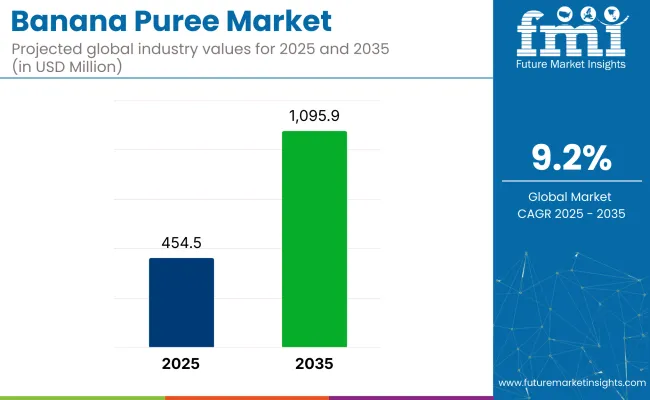
During the projected period, the banana puree market is expected to register a CAGR of 9.2%. The market value is projected to increase from US$ 381.7 million in 2023 to US$ 919 million by 2033.

Attribute Details
Market Size (2023) US$ 381.7 million
Market Size (2033) US$ 919 million
CAGR (2023 to 2033) 9.2%

A functional beverage is often meant to provide certain health benefits to consumers. Most functional beverages contain vitamins, minerals, roots, and fruit purees. Some examples of functional beverages include energy drinks, performance drinks, and enhanced fruit drinks.

Developed countries such as North America will remain the biggest markets for functional beverages due to demographic features like test and consumer awareness docket.

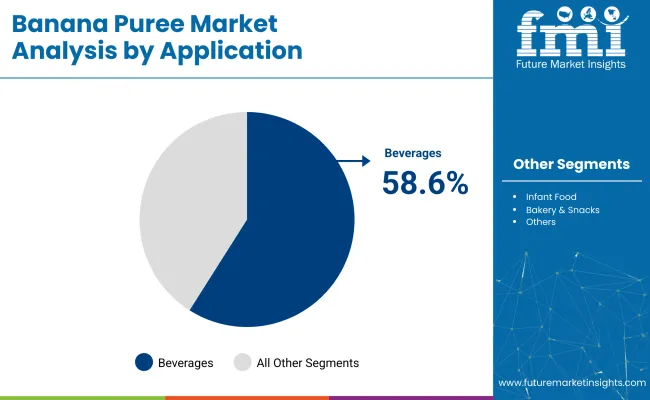
Functional beverages, including banana puree, can benefit from the presence of banana puree, improving the global banana puree market. An incremental potential worth nearly US$ $537 million for the period from 2023 to 2033 is waiting to be tapped in the beverage sector of the banana puree trade.

Don't pay for what you don't need

Customize your report by selecting specific countries or regions and save 30%!

The growing demand for child nutrition has led to the peak demand for baby nutrition food

The increase in the employment of women in the worldwide workforce has been helping to boost the worldwide demand for baby food groceries. Baby yogurt and protein-rich little cereal often contain purées with different flavors as the key ingredients.

The infant food segment has eclipsed every other segment in banana puree production due to the significant popularity of banana puree in the production of an assortment of edible products. The infant food segment is anticipated to be worth approximately US$ 919 million by the year 2033, making it the largest segment in the banana puree market.

False claims for beverage manufacturers are making consumers skeptical and suspicious

Consumers quickly find beverages that provide them with maximum health benefits based on sound reasoning and facts. Regrettably, they are often wary of the big claims about ingredients and health benefits of big-name beverage manufacturers. This can spur some degree of certainty and clarity in regard to specific ingredients of functional beverages that are marketed aggressively.

The greater the emphasis on the security and labeling of products, the more prominent the manufacturing of false health claims for legitimate products appears. This poses a threat to the banana puree market expansion.

Nandini Roy Choudhury

Principal Consultant

Talk to Analyst

Find your sweet spots for generating winning opportunities in this market.

Include bananas as a major ingredient in banana cakes

The rising income levels, interest in convenience foods, and rising consumption of health foods have helped turn the bakery business upside down. The baked goods category offers items like pizzas, breads, rolls, biscuits, and desserts.

Banana cakes are generally famous among European consumers, and French banana cakes are a particularly popular item. Globally, the bakery and dessert sector had a market share of around 4.9% of the banana puree market in 2023. It’s estimated that it will lose 66 BPS by 2026.

Fueling the global banana puree marketplace is the popularity of banana shampoos

Cosmetics Europe estimates that the personal care and cosmetics market in Europe had a worth of about $90 billion at retail expense in 2016. Major cosmetic manufacturers such as Procter & Gamble, Unilever, and L’Oreal have invested greatly within the industry, with several corporations eager to introduce products that include fruit ingredients.

For example, Body Shop International, a subsidiary of L'Oréal Group, has created a banana shampoo with banana puree as a key ingredient. Cosmetics is part of Other in the Western Europe banana puree market and is expected to have a volume of more than 2900 metric tons by 2033.

Get the data you need at a Fraction of the cost

Personalize your report by choosing insights you need
and save 40%!

Country-wise Insights

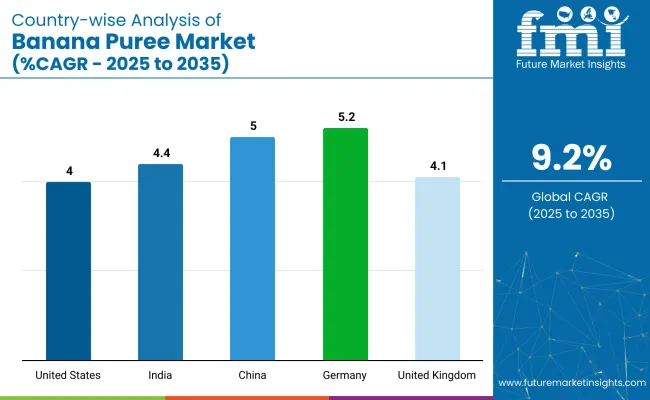
How is the United States Banana Puree Market Shaping?

The United States banana puree market is growing rapidly. This is due to the increasing popularity of health drinks and smoothies. More and more people are looking for healthy options when it comes to their beverages. Banana puree is a great alternative to sugary drinks because it is low in calories and fat. In addition, banana puree is a good source of vitamins and minerals.

What is the Performance of the Indian Banana Puree Market?

The performance of the banana puree market in India has been strong in recent years, with sales growing steadily.

There are several reasons for India's strong performance of the banana puree market. First, the population of India is growing rapidly, and as incomes rise, more people are able to afford to purchase processed foods like banana puree. Second, the climate in India is conducive to growing bananas, and there is a large supply of fresh bananas available for processing into puree.

Third, Indian consumers are becoming increasingly health-conscious and are looking for healthy food options that are easy to prepare. Banana puree fits this need perfectly, as it is a healthy food that can be easily added to smoothies or used as an ingredient in recipes.

How Will Market Players Target the Emerging Market of China for the Banana Puree Market?

In the past few years, China's economy has been growing at a rapid pace and is now the world's second-largest economy. This economic growth has led to an increase in the purchasing power of the Chinese consumer. As a result, many international companies have started to target the Chinese market for growth. The banana puree market is no exception.

Many market players see China as a potential growth market for banana puree due to the increasing demand from Chinese consumers. The Chinese government's policies also support the growth of the domestic food processing industry, which is expected to boost the demand for banana puree in China. In addition, China's large population and growing middle class provide a significant opportunity for companies operating in this market.

How Japan and Indonesia are growing as the fastest Banana Puree market?

Banana puree is a popular product in both Japan and Indonesia. The countries have seen a surge in demand for the product, and they are working to meet this demand. Japan and Indonesia are both tropical countries, so it is no surprise that they are among the top producers of banana puree. The two countries have seen a surge in demand for the product in recent years and are working to meet this demand.

Banana puree is used in a variety of products, including baby food, ice cream, and baked goods. It is also a popular addition to smoothies and other beverages. Japan and Indonesia are working to increase their production of banana puree to meet the growing consumer demand.

Competitive Landscape

The global market for Banana Puree is incredibly fragmented and competitive due to the existence of several local and regional rivals. Key players employ a range of marketing strategies, such as partnerships, expansions, mergers and acquisitions, and collaborations.

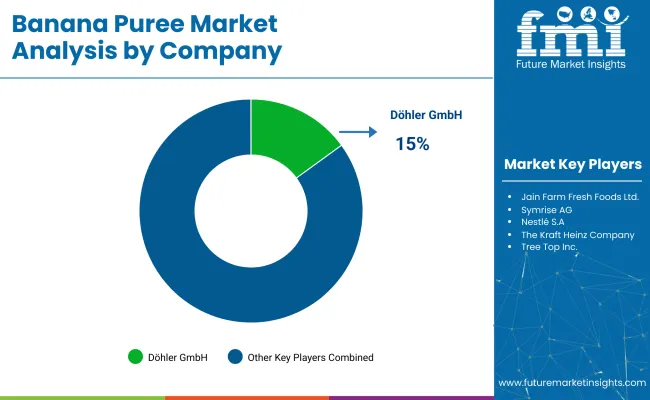
Some of the leading companies operating in the Banana Puree market are Symrise AG, Döhler GmbH, Kiril Mischeff, Riviana Foods Pty Ltd, Nestlé S.A., The Hain Celestial Group, Inc, The Kraft Heinz Co., Ariza B.V., Newberry International Produce Limited, Grünewald Fruchtsaft GmbH, Tree Top Inc., Hiltfields Ltd., Shimla Hills Offerings Pvt. Ltd., Antigua Processors S.A., SunOpta Grains and Foods Inc.

Key Companies Profiled

  • Symrise AG
  • Döhler GmbH
  • Kiril Mischeff
  • Riviana Foods Pty Ltd
  • Nestlé S.A.
  • The Hain Celestial Group Inc
  • The Kraft Heinz Co.,
  • Ariza B.V.
  • Newberry International Produce Limited
  • Grünewald Fruchtsaft GmbH
  • Tree Top Inc.
  • Hiltfields Ltd.
  • Shimla Hills Offerings Pvt. Ltd.
  • Antigua Processors S.A.
  • SunOpta Grains and Foods Inc.

Banana Puree Market by Category

By Application, Banana Puree Market is Segmented as:

  • Beverages
  • Infant Food
  • Bakery & Snacks
  • Others
  • Dressings & Sauces
  • Ice Cream & Yoghurt

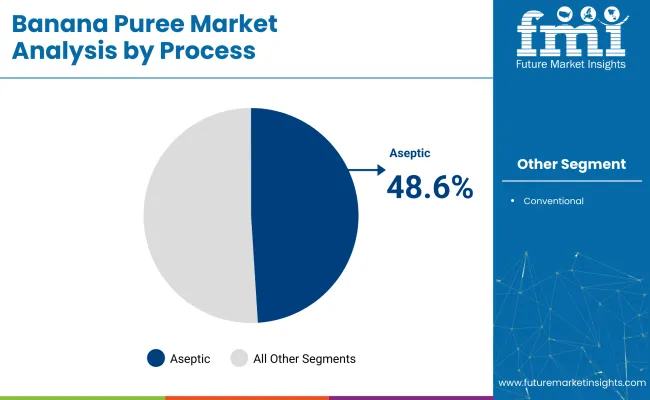
By Process, Banana Puree Market is Segmented as:

  • Conventional
  • Aseptic

By Source, Banana Puree Market is Segmented as:

  • Organic
  • Conventional

By Region, Banana Puree Market is Segmented as:

  • North America
  • Latin America
  • APEJ
  • Japan
  • Western Europe
  • Eastern Europe

Frequently Asked Questions

What is the Current Size of the Banana Puree Market?

The banana puree market has witnessed significant growth, with its size reaching US$ 381.7 million in 2023.

What is the Forecast Market Size of the Banana Puree Market?

The banana puree market is predicted to register a valuation of US$ 919 million by 2033.

What is the Estimated CAGR of the Banana Puree Market through 2033?

The banana puree market is anticipated to evolve at a CAGR of 9.2% through 2033.

Which Countries are Prominent in the Banana Puree Market?

Prominent countries in the banana puree market include the United States, China, India, and Japan.

Who are the Key Banana Puree Market Players?

Symrise AG, Döhler GmbH, Kiril Mischeff, Riviana Foods Pty Ltd, and Nestlé S.A. are key banana puree market players.

Table of Content

1. Executive Summary

    1.1. Global Market Outlook

    1.2. Demand-side Trends

    1.3. Supply-side Trends

    1.4. Technology Roadmap Analysis

    1.5. Analysis and Recommendations

2. Market Overview

    2.1. Market Coverage / Taxonomy

    2.2. Market Definition / Scope / Limitations

3. Market Background

    3.1. Market Dynamics

        3.1.1. Drivers

        3.1.2. Restraints

        3.1.3. Opportunity

        3.1.4. Trends

    3.2. Scenario Forecast

        3.2.1. Demand in Optimistic Scenario

        3.2.2. Demand in Likely Scenario

        3.2.3. Demand in Conservative Scenario

    3.3. Opportunity Map Analysis

    3.4. Product Life Cycle Analysis

    3.5. Supply Chain Analysis

        3.5.1. Supply Side Participants and their Roles

            3.5.1.1. Producers

            3.5.1.2. Mid-Level Participants (Traders/ Agents/ Brokers)

            3.5.1.3. Wholesalers and Distributors

        3.5.2. Value Added and Value Created at Node in the Supply Chain

        3.5.3. List of Raw Material Suppliers

        3.5.4. List of Existing and Potential Buyer’s

    3.6. Investment Feasibility Matrix

    3.7. Value Chain Analysis

        3.7.1. Profit Margin Analysis

        3.7.2. Wholesalers and Distributors

        3.7.3. Retailers

    3.8. PESTLE and Porter’s Analysis

    3.9. Regulatory Landscape

        3.9.1. By Key Regions

        3.9.2. By Key Countries

    3.10. Regional Parent Market Outlook

    3.11. Production and Consumption Statistics

    3.12. Import and Export Statistics

4. Global Market Analysis 2018 to 2022 and Forecast, 2023 to 2033

    4.1. Historical Market Size Value (US$ Million) & Volume (Tons) Analysis, 2018 to 2022

    4.2. Current and Future Market Size Value (US$ Million) & Volume (Tons) Projections, 2023 to 2033

        4.2.1. Y-o-Y Growth Trend Analysis

        4.2.2. Absolute $ Opportunity Analysis

5. Global Market Analysis 2018 to 2022 and Forecast 2023 to 2033, By Application

    5.1. Introduction / Key Findings

    5.2. Historical Market Size Value (US$ Million) & Volume (Tons) Analysis By Application, 2018 to 2022

    5.3. Current and Future Market Size Value (US$ Million) & Volume (Tons) Analysis and Forecast By Application, 2023 to 2033

        5.3.1. Beverages

        5.3.2. Infant Food

        5.3.3. Bakery & Snacks

        5.3.4. Dressings & Sauces

        5.3.5. Ice Cream & Yoghurt

        5.3.6. Others

    5.4. Y-o-Y Growth Trend Analysis By Application, 2018 to 2022

    5.5. Absolute $ Opportunity Analysis By Application, 2023 to 2033

6. Global Market Analysis 2018 to 2022 and Forecast 2023 to 2033, By Process

    6.1. Introduction / Key Findings

    6.2. Historical Market Size Value (US$ Million) & Volume (Tons) Analysis By Process, 2018 to 2022

    6.3. Current and Future Market Size Value (US$ Million) & Volume (Tons) Analysis and Forecast By Process, 2023 to 2033

        6.3.1. Conventional

        6.3.2. Aseptic

    6.4. Y-o-Y Growth Trend Analysis By Process, 2018 to 2022

    6.5. Absolute $ Opportunity Analysis By Process, 2023 to 2033

7. Global Market Analysis 2018 to 2022 and Forecast 2023 to 2033, By Source

    7.1. Introduction / Key Findings

    7.2. Historical Market Size Value (US$ Million) & Volume (Tons) Analysis By Source, 2018 to 2022

    7.3. Current and Future Market Size Value (US$ Million) & Volume (Tons) Analysis and Forecast By Source, 2023 to 2033

        7.3.1. Organic

        7.3.2. Conventional

    7.4. Y-o-Y Growth Trend Analysis By Source, 2018 to 2022

    7.5. Absolute $ Opportunity Analysis By Source, 2023 to 2033

8. Global Market Analysis 2018 to 2022 and Forecast 2023 to 2033, By Region

    8.1. Introduction

    8.2. Historical Market Size Value (US$ Million) & Volume (Tons) Analysis By Region, 2018 to 2022

    8.3. Current Market Size Value (US$ Million) & Volume (Tons) Analysis and Forecast By Region, 2023 to 2033

        8.3.1. North America

        8.3.2. Latin America

        8.3.3. Western Europe

        8.3.4. Eastern Europe

        8.3.5. South Asia and Pacific

        8.3.6. East Asia

        8.3.7. Middle East and Africa

    8.4. Market Attractiveness Analysis By Region

9. North America Market Analysis 2018 to 2022 and Forecast 2023 to 2033, By Country

    9.1. Historical Market Size Value (US$ Million) & Volume (Tons) Trend Analysis By Market Taxonomy, 2018 to 2022

    9.2. Market Size Value (US$ Million) & Volume (Tons) Forecast By Market Taxonomy, 2023 to 2033

        9.2.1. By Country

            9.2.1.1. The USA

            9.2.1.2. Canada

        9.2.2. By Application

        9.2.3. By Process

        9.2.4. By Source

    9.3. Market Attractiveness Analysis

        9.3.1. By Country

        9.3.2. By Application

        9.3.3. By Process

        9.3.4. By Source

    9.4. Key Takeaways

10. Latin America Market Analysis 2018 to 2022 and Forecast 2023 to 2033, By Country

    10.1. Historical Market Size Value (US$ Million) & Volume (Tons) Trend Analysis By Market Taxonomy, 2018 to 2022

    10.2. Market Size Value (US$ Million) & Volume (Tons) Forecast By Market Taxonomy, 2023 to 2033

        10.2.1. By Country

            10.2.1.1. Brazil

            10.2.1.2. Mexico

            10.2.1.3. Rest of Latin America

        10.2.2. By Application

        10.2.3. By Process

        10.2.4. By Source

    10.3. Market Attractiveness Analysis

        10.3.1. By Country

        10.3.2. By Application

        10.3.3. By Process

        10.3.4. By Source

    10.4. Key Takeaways

11. Western Europe Market Analysis 2018 to 2022 and Forecast 2023 to 2033, By Country

    11.1. Historical Market Size Value (US$ Million) & Volume (Tons) Trend Analysis By Market Taxonomy, 2018 to 2022

    11.2. Market Size Value (US$ Million) & Volume (Tons) Forecast By Market Taxonomy, 2023 to 2033

        11.2.1. By Country

            11.2.1.1. Germany

            11.2.1.2. United Kingdom

            11.2.1.3. France

            11.2.1.4. Spain

            11.2.1.5. Italy

            11.2.1.6. Rest of Western Europe

        11.2.2. By Application

        11.2.3. By Process

        11.2.4. By Source

    11.3. Market Attractiveness Analysis

        11.3.1. By Country

        11.3.2. By Application

        11.3.3. By Process

        11.3.4. By Source

    11.4. Key Takeaways

12. Eastern Europe Market Analysis 2018 to 2022 and Forecast 2023 to 2033, By Country

    12.1. Historical Market Size Value (US$ Million) & Volume (Tons) Trend Analysis By Market Taxonomy, 2018 to 2022

    12.2. Market Size Value (US$ Million) & Volume (Tons) Forecast By Market Taxonomy, 2023 to 2033

        12.2.1. By Country

            12.2.1.1. Poland

            12.2.1.2. Russia

            12.2.1.3. Czech Republic

            12.2.1.4. Romania

            12.2.1.5. Rest of Eastern Europe

        12.2.2. By Application

        12.2.3. By Process

        12.2.4. By Source

    12.3. Market Attractiveness Analysis

        12.3.1. By Country

        12.3.2. By Application

        12.3.3. By Process

        12.3.4. By Source

    12.4. Key Takeaways

13. South Asia and Pacific Market Analysis 2018 to 2022 and Forecast 2023 to 2033, By Country

    13.1. Historical Market Size Value (US$ Million) & Volume (Tons) Trend Analysis By Market Taxonomy, 2018 to 2022

    13.2. Market Size Value (US$ Million) & Volume (Tons) Forecast By Market Taxonomy, 2023 to 2033

        13.2.1. By Country

            13.2.1.1. India

            13.2.1.2. Bangladesh

            13.2.1.3. Australia

            13.2.1.4. New Zealand

            13.2.1.5. Rest of South Asia and Pacific

        13.2.2. By Application

        13.2.3. By Process

        13.2.4. By Source

    13.3. Market Attractiveness Analysis

        13.3.1. By Country

        13.3.2. By Application

        13.3.3. By Process

        13.3.4. By Source

    13.4. Key Takeaways

14. East Asia Market Analysis 2018 to 2022 and Forecast 2023 to 2033, By Country

    14.1. Historical Market Size Value (US$ Million) & Volume (Tons) Trend Analysis By Market Taxonomy, 2018 to 2022

    14.2. Market Size Value (US$ Million) & Volume (Tons) Forecast By Market Taxonomy, 2023 to 2033

        14.2.1. By Country

            14.2.1.1. China

            14.2.1.2. Japan

            14.2.1.3. South Korea

        14.2.2. By Application

        14.2.3. By Process

        14.2.4. By Source

    14.3. Market Attractiveness Analysis

        14.3.1. By Country

        14.3.2. By Application

        14.3.3. By Process

        14.3.4. By Source

    14.4. Key Takeaways

15. Middle East and Africa Market Analysis 2018 to 2022 and Forecast 2023 to 2033, By Country

    15.1. Historical Market Size Value (US$ Million) & Volume (Tons) Trend Analysis By Market Taxonomy, 2018 to 2022

    15.2. Market Size Value (US$ Million) & Volume (Tons) Forecast By Market Taxonomy, 2023 to 2033

        15.2.1. By Country

            15.2.1.1. GCC Countries

            15.2.1.2. South Africa

            15.2.1.3. Israel

            15.2.1.4. Rest of MEA

        15.2.2. By Application

        15.2.3. By Process

        15.2.4. By Source

    15.3. Market Attractiveness Analysis

        15.3.1. By Country

        15.3.2. By Application

        15.3.3. By Process

        15.3.4. By Source

    15.4. Key Takeaways

16. Key Countries Market Analysis

    16.1. USA

        16.1.1. Pricing Analysis

        16.1.2. Market Share Analysis, 2022

            16.1.2.1. By Application

            16.1.2.2. By Process

            16.1.2.3. By Source

    16.2. Canada

        16.2.1. Pricing Analysis

        16.2.2. Market Share Analysis, 2022

            16.2.2.1. By Application

            16.2.2.2. By Process

            16.2.2.3. By Source

    16.3. Brazil

        16.3.1. Pricing Analysis

        16.3.2. Market Share Analysis, 2022

            16.3.2.1. By Application

            16.3.2.2. By Process

            16.3.2.3. By Source

    16.4. Mexico

        16.4.1. Pricing Analysis

        16.4.2. Market Share Analysis, 2022

            16.4.2.1. By Application

            16.4.2.2. By Process

            16.4.2.3. By Source

    16.5. Germany

        16.5.1. Pricing Analysis

        16.5.2. Market Share Analysis, 2022

            16.5.2.1. By Application

            16.5.2.2. By Process

            16.5.2.3. By Source

    16.6. United Kingdom

        16.6.1. Pricing Analysis

        16.6.2. Market Share Analysis, 2022

            16.6.2.1. By Application

            16.6.2.2. By Process

            16.6.2.3. By Source

    16.7. France

        16.7.1. Pricing Analysis

        16.7.2. Market Share Analysis, 2022

            16.7.2.1. By Application

            16.7.2.2. By Process

            16.7.2.3. By Source

    16.8. Spain

        16.8.1. Pricing Analysis

        16.8.2. Market Share Analysis, 2022

            16.8.2.1. By Application

            16.8.2.2. By Process

            16.8.2.3. By Source

    16.9. Italy

        16.9.1. Pricing Analysis

        16.9.2. Market Share Analysis, 2022

            16.9.2.1. By Application

            16.9.2.2. By Process

            16.9.2.3. By Source

    16.10. Poland

        16.10.1. Pricing Analysis

        16.10.2. Market Share Analysis, 2022

            16.10.2.1. By Application

            16.10.2.2. By Process

            16.10.2.3. By Source

    16.11. Russia

        16.11.1. Pricing Analysis

        16.11.2. Market Share Analysis, 2022

            16.11.2.1. By Application

            16.11.2.2. By Process

            16.11.2.3. By Source

    16.12. Czech Republic

        16.12.1. Pricing Analysis

        16.12.2. Market Share Analysis, 2022

            16.12.2.1. By Application

            16.12.2.2. By Process

            16.12.2.3. By Source

    16.13. Romania

        16.13.1. Pricing Analysis

        16.13.2. Market Share Analysis, 2022

            16.13.2.1. By Application

            16.13.2.2. By Process

            16.13.2.3. By Source

    16.14. India

        16.14.1. Pricing Analysis

        16.14.2. Market Share Analysis, 2022

            16.14.2.1. By Application

            16.14.2.2. By Process

            16.14.2.3. By Source

    16.15. Bangladesh

        16.15.1. Pricing Analysis

        16.15.2. Market Share Analysis, 2022

            16.15.2.1. By Application

            16.15.2.2. By Process

            16.15.2.3. By Source

    16.16. Australia

        16.16.1. Pricing Analysis

        16.16.2. Market Share Analysis, 2022

            16.16.2.1. By Application

            16.16.2.2. By Process

            16.16.2.3. By Source

    16.17. New Zealand

        16.17.1. Pricing Analysis

        16.17.2. Market Share Analysis, 2022

            16.17.2.1. By Application

            16.17.2.2. By Process

            16.17.2.3. By Source

    16.18. China

        16.18.1. Pricing Analysis

        16.18.2. Market Share Analysis, 2022

            16.18.2.1. By Application

            16.18.2.2. By Process

            16.18.2.3. By Source

    16.19. Japan

        16.19.1. Pricing Analysis

        16.19.2. Market Share Analysis, 2022

            16.19.2.1. By Application

            16.19.2.2. By Process

            16.19.2.3. By Source

    16.20. South Korea

        16.20.1. Pricing Analysis

        16.20.2. Market Share Analysis, 2022

            16.20.2.1. By Application

            16.20.2.2. By Process

            16.20.2.3. By Source

    16.21. GCC Countries

        16.21.1. Pricing Analysis

        16.21.2. Market Share Analysis, 2022

            16.21.2.1. By Application

            16.21.2.2. By Process

            16.21.2.3. By Source

    16.22. South Africa

        16.22.1. Pricing Analysis

        16.22.2. Market Share Analysis, 2022

            16.22.2.1. By Application

            16.22.2.2. By Process

            16.22.2.3. By Source

    16.23. Israel

        16.23.1. Pricing Analysis

        16.23.2. Market Share Analysis, 2022

            16.23.2.1. By Application

            16.23.2.2. By Process

            16.23.2.3. By Source

17. Market Structure Analysis

    17.1. Competition Dashboard

    17.2. Competition Benchmarking

    17.3. Market Share Analysis of Top Players

        17.3.1. By Regional

        17.3.2. By Application

        17.3.3. By Process

        17.3.4. By Source

18. Competition Analysis

    18.1. Competition Deep Dive

        18.1.1. Symrise AG

            18.1.1.1. Overview

            18.1.1.2. Product Portfolio

            18.1.1.3. Profitability by Market Segments

            18.1.1.4. Sales Footprint

            18.1.1.5. Strategy Overview

                18.1.1.5.1. Marketing Strategy

                18.1.1.5.2. Product Strategy

                18.1.1.5.3. Channel Strategy

        18.1.2. Döhler GmbH

            18.1.2.1. Overview

            18.1.2.2. Product Portfolio

            18.1.2.3. Profitability by Market Segments

            18.1.2.4. Sales Footprint

            18.1.2.5. Strategy Overview

                18.1.2.5.1. Marketing Strategy

                18.1.2.5.2. Product Strategy

                18.1.2.5.3. Channel Strategy

        18.1.3. Kiril Mischeff

            18.1.3.1. Overview

            18.1.3.2. Product Portfolio

            18.1.3.3. Profitability by Market Segments

            18.1.3.4. Sales Footprint

            18.1.3.5. Strategy Overview

                18.1.3.5.1. Marketing Strategy

                18.1.3.5.2. Product Strategy

                18.1.3.5.3. Channel Strategy

        18.1.4. Riviana Foods Pty Ltd

            18.1.4.1. Overview

            18.1.4.2. Product Portfolio

            18.1.4.3. Profitability by Market Segments

            18.1.4.4. Sales Footprint

            18.1.4.5. Strategy Overview

                18.1.4.5.1. Marketing Strategy

                18.1.4.5.2. Product Strategy

                18.1.4.5.3. Channel Strategy

        18.1.5. Nestlé S.A.

            18.1.5.1. Overview

            18.1.5.2. Product Portfolio

            18.1.5.3. Profitability by Market Segments

            18.1.5.4. Sales Footprint

            18.1.5.5. Strategy Overview

                18.1.5.5.1. Marketing Strategy

                18.1.5.5.2. Product Strategy

                18.1.5.5.3. Channel Strategy

        18.1.6. The Hain Celestial Group Inc

            18.1.6.1. Overview

            18.1.6.2. Product Portfolio

            18.1.6.3. Profitability by Market Segments

            18.1.6.4. Sales Footprint

            18.1.6.5. Strategy Overview

                18.1.6.5.1. Marketing Strategy

                18.1.6.5.2. Product Strategy

                18.1.6.5.3. Channel Strategy

        18.1.7. The Kraft Heinz Co.,

            18.1.7.1. Overview

            18.1.7.2. Product Portfolio

            18.1.7.3. Profitability by Market Segments

            18.1.7.4. Sales Footprint

            18.1.7.5. Strategy Overview

                18.1.7.5.1. Marketing Strategy

                18.1.7.5.2. Product Strategy

                18.1.7.5.3. Channel Strategy

        18.1.8. Ariza B.V.

            18.1.8.1. Overview

            18.1.8.2. Product Portfolio

            18.1.8.3. Profitability by Market Segments

            18.1.8.4. Sales Footprint

            18.1.8.5. Strategy Overview

                18.1.8.5.1. Marketing Strategy

                18.1.8.5.2. Product Strategy

                18.1.8.5.3. Channel Strategy

        18.1.9. Newberry International Produce Limited

            18.1.9.1. Overview

            18.1.9.2. Product Portfolio

            18.1.9.3. Profitability by Market Segments

            18.1.9.4. Sales Footprint

            18.1.9.5. Strategy Overview

                18.1.9.5.1. Marketing Strategy

                18.1.9.5.2. Product Strategy

                18.1.9.5.3. Channel Strategy

        18.1.10. Grünewald Fruchtsaft GmbH

            18.1.10.1. Overview

            18.1.10.2. Product Portfolio

            18.1.10.3. Profitability by Market Segments

            18.1.10.4. Sales Footprint

            18.1.10.5. Strategy Overview

                18.1.10.5.1. Marketing Strategy

                18.1.10.5.2. Product Strategy

                18.1.10.5.3. Channel Strategy

        18.1.11. Tree Top Inc.

            18.1.11.1. Overview

            18.1.11.2. Product Portfolio

            18.1.11.3. Profitability by Market Segments

            18.1.11.4. Sales Footprint

            18.1.11.5. Strategy Overview

                18.1.11.5.1. Marketing Strategy

                18.1.11.5.2. Product Strategy

                18.1.11.5.3. Channel Strategy

        18.1.12. Hiltfields Ltd.

            18.1.12.1. Overview

            18.1.12.2. Product Portfolio

            18.1.12.3. Profitability by Market Segments

            18.1.12.4. Sales Footprint

            18.1.12.5. Strategy Overview

                18.1.12.5.1. Marketing Strategy

                18.1.12.5.2. Product Strategy

                18.1.12.5.3. Channel Strategy

        18.1.13. Shimla Hills Offerings Pvt. Ltd.

            18.1.13.1. Overview

            18.1.13.2. Product Portfolio

            18.1.13.3. Profitability by Market Segments

            18.1.13.4. Sales Footprint

            18.1.13.5. Strategy Overview

                18.1.13.5.1. Marketing Strategy

                18.1.13.5.2. Product Strategy

                18.1.13.5.3. Channel Strategy

        18.1.14. Antigua Processors S.A.

            18.1.14.1. Overview

            18.1.14.2. Product Portfolio

            18.1.14.3. Profitability by Market Segments

            18.1.14.4. Sales Footprint

            18.1.14.5. Strategy Overview

                18.1.14.5.1. Marketing Strategy

                18.1.14.5.2. Product Strategy

                18.1.14.5.3. Channel Strategy

        18.1.15. SunOpta Grains and Foods Inc.

            18.1.15.1. Overview

            18.1.15.2. Product Portfolio

            18.1.15.3. Profitability by Market Segments

            18.1.15.4. Sales Footprint

            18.1.15.5. Strategy Overview

                18.1.15.5.1. Marketing Strategy

                18.1.15.5.2. Product Strategy

                18.1.15.5.3. Channel Strategy

19. Assumptions & Acronyms Used

20. Research Methodology

Recommendations

Food and Beverage

Banana Flour Market

January 2024

REP-GB-6155

350 pages

Food and Beverage

Banana Bread Market

June 2023

REP-GB-5475

324 pages

Explore Food and Beverage Insights

View Reports
Future Market Insights

Banana Puree Market

Schedule a Call