Banana Bread Market Size and Share Forecast Outlook 2025 to 2035

The global market for banana bread is on a strong upward trajectory, estimated at USD 1.26 billion in 2025 and forecasted to reach around USD 4.87 billion by 2035, reflecting a compound annual growth rate (CAGR) of 14.5% over the decade.
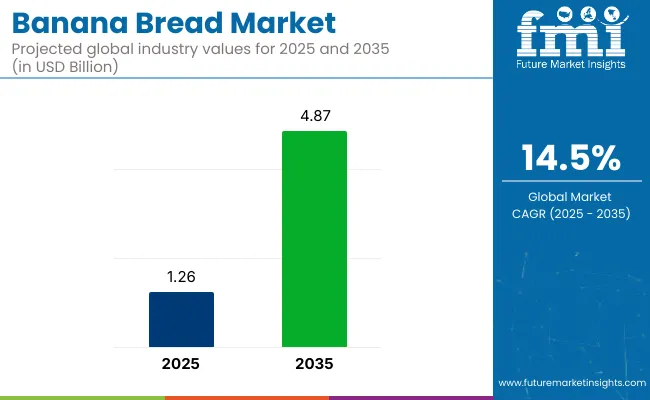
Quick Stats of Banana Bread Market

  • Market Value (2025): USD 1.26 Billion
  • Forecast Value (2035): USD 4.87 Billion
  • Forecast CAGR: 14.5%
  • Product Leader in 2025: Unflavoured Banana Bread (55% Market Share)
  • Top Distribution Channel: E-commerce (40% Share)
  • Key Growth Region: United States (CAGR 5.5%)
  • Leading Player: General Mills (17% Market Share)

Banana Bread Market

Market Metrics

Attributes Details
Market Size (2025) USD 1.26 Billion
Market Value (2035) USD 4.87 Billion
Market CAGR (2025 to 2035) 14.5%

The surge in demand for bakery products crafted from natural ingredients like ripe bananas, whole grains, and natural sweeteners is driving this market expansion. Consumers’ growing preference for healthier choices is accelerating the trend of clean-label products, including organic, gluten-free, and preservative-free bread. This shift highlights the rising demand for homemade, minimally processed alternatives, in line with health-conscious food trends.

The banana loaf market occupies a modest but expanding share across its parent markets. In the global baked goods market (valued at approximately USD 450 billion), banana bread represents less than 1%, as it remains a niche product. Within the quick breads market (around USD 5 billion), its share rises to 5-10%, competing with similar products like zucchini and pumpkin bread. In the breakfast foods market (nearly USD 600 billion), banana bread holds under 1%, facing strong competition from cereals and toast.

The snack foods market (roughly USD 1.2 trillion) sees banana bread at below 0.5%, overshadowed by chips and protein bars. In the organic and natural foods market (about USD 200 billion), banana bread captures 1-2%, supported by rising demand for healthier, artisanal, and gluten-free options. Growth is driven by convenience, home baking trends, and premium product variations, though the market penetration remains limited compared to mass-produced alternatives.

Manufacturers are consolidating and optimizing supply chains by expanding production scales. Companies like Bimbo Bakeries automate production lines to reduce time and costs. Private-label brands and artisanal bakeries are leveraging e-commerce and direct-to-consumer (DTC) channels to reach more customers.

The growth of online shopping and delivery services has boosted the demand for fresh, high-quality bakery products. The trend of plant-based and dairy-free diets has led to vegan banana infused bread development, including protein-enriched, fiber-rich, and keto-friendly options, appealing to health-conscious consumers.

Analyzing Banana Bread Market by Top Investment Segments

Growing preference for convenient breakfast and snack options is strengthening demand for banana based bread across key product, distribution, and user categories. Commercial establishments and digital retail are playing a pivotal role in scaling the market's revenue footprint

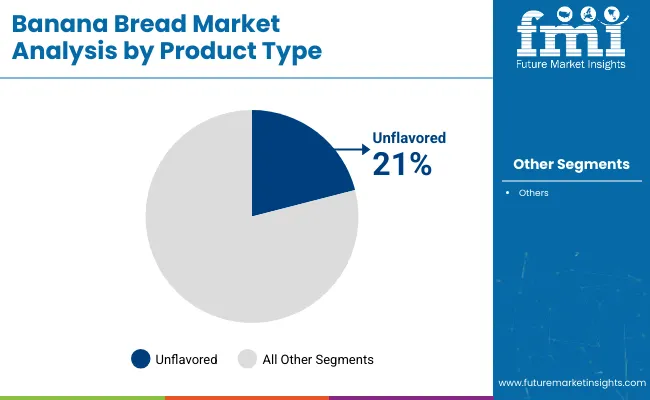
Unflavoured Banana Bread Drives 21% Share in Product Type Segment

Consumer loyalty toward traditional tastes continues to elevate demand for unflavoured banana loaf, which captured a 21% market share in 2025. Major producers like Bimbo Bakeries, General Mills, and regional artisanal bakeries are focusing on classic recipes that appeal to health-conscious and routine-driven consumers. This segment benefits from lower ingredient cost, longer shelf life, and broader age-group acceptability, especially in institutional catering and bulk sales.
  • Unflavoured variants cater to buyers seeking clean-label ingredients and traditional recipes.
  • Strong uptake from schools, hospitals, and QSR chains bolsters volume sales.
  • Brands are standardizing production lines to keep unit economics competitive.

Banana Bread Market Analysis By Product Type

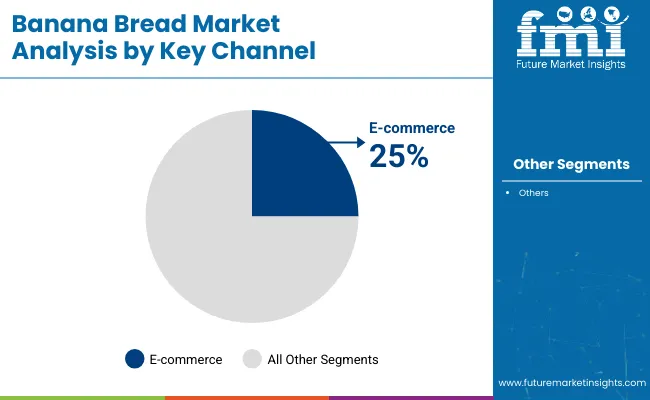
E-commerce Emerges as a Key Channel with 25% Market Share

Online platforms are reshaping banana based bread sales, contributing to 25% of total revenue in 2025. Rapid adoption of direct-to-consumer (DTC) models by players like Amazon Fresh, Swiggy Instamart, and bakery-specific portals such as Theobroma and Wildgrain has facilitated doorstep delivery of freshly baked goods. Customized packaging, extended delivery radius, and flash discounts are attracting both repeat buyers and new entrants to the category.
  • Artisanal and private-label brands thrive on subscription-based models and pre-orders.
  • Same-day or scheduled delivery options fuel repeat purchases among urban consumers.
  • Product visibility and promotions on online grocery platforms drive volume growth.

Banana Bread Market Analysis By Key Channel

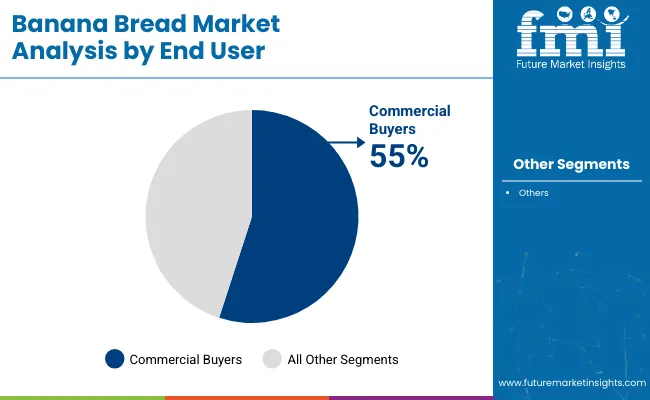
Commercial End Users Control 55% of Market Demand in 2025

Commercial buyers hold a commanding 55% share of banana bread consumption in 2025, making them the largest end-user group. Businesses in hospitality, institutional catering, airline meals, and corporate cafeterias increasingly rely on bulk-purchased bread due to its consistent quality, cost-efficiency, and appeal across demographics. Chains like Marriott, IHCL, and corporate food contractors such as Compass Group have embedded banana loaf in buffet breakfasts, snack counters, and lunchbox add-ons.
  • Bulk orders from hotels and airline services ensure consistent demand.
  • Commercial buyers prioritize shelf-stable SKUs to reduce food waste and logistic issues.
  • Cost-effective manufacturing partnerships allow for steady contract-based supply.

Banana Bread Market Analysis By End User

Top Banana Bread Market Dynamics

Automation and smart packaging slashed banana loaf production waste by 23%. Clean-label and functional varieties dominated development, with protein-fortified options capturing premium industries. Rising banana costs pressured margins, driving adoption of cost-efficient ingredients. Private-label expansion intensified competition, while consumer demand for healthier options fueled segment growth despite supply chain challenge.

Operational Streamlining & Waste Reduction

Between Q2 2024 and Q1 2025, industrial bakeries achieved 19% faster production cycles through high-shear mixing technology and AI-driven batch optimization. Inventory turnover improved from 16 to 11 days among top manufacturers, with Kroger's in-store bakeries reducing shrink by 23% via smart moisture-retentive packaging. The adoption of flash-freezing for par-baked goods allowed regional distributors to cut buffer stock by 31% while maintaining freshness. By early 2025, 42% of commercial operations had integrated real-time shelf-life monitoring sensors, decreasing returns by 17% industry-wide.

Nutritional Reformulation & Premiumization

The 2024 discovery of banana flour's prebiotic properties accelerated R&D investments, resulting in 28 new functional SKUs by Q3 2025. Low-glycemic prototypes using tiger nut flour captured 12% of the diabetic-friendly segment, while sprouted grain versions grew 33% in natural food channels. Private labels responded with clean-label offerings - Costco's organic line achieved 37% sales growth through 2025 by eliminating all synthetic emulsifiers. European developers gained traction with protein-fortified (9g/serving) and adaptogen-infused varieties, commanding 19-25% price premiums over conventional recipes.

Commodity Volatility & Cost Mitigation

Banana pulp prices fluctuated 27% from 2024 to 2025 due to Latin American supply disruptions, compressing margins by 8-11 points. Major brands implemented 5-7% price hikes but still saw EBITDA decline 4.6% on average. The shift to hybrid wheat-oat flour blends saved USD 0.18/unit in production costs, while co-packing frozen dough for in-store baking reduced logistics expenses by 24%. However, private-label competition intensified - Albertsons' value line expanded distribution by 41% in 2025, leveraging private banana plantations to offset input cost inflation.
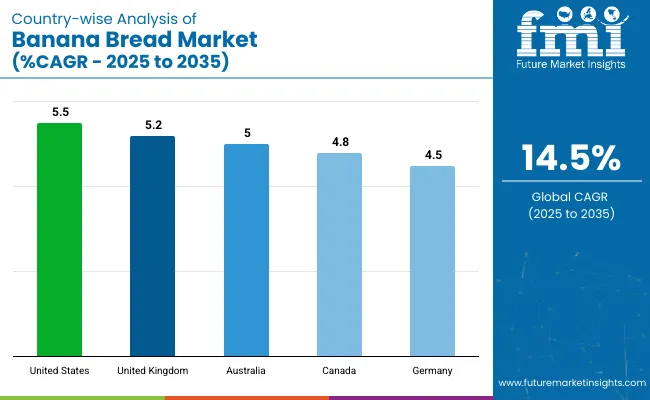
Top Countries Manufacturing, Distributing, and Driving Demand in the Banana Bread Market (2025 to 2035)

Country Wise Analysis Of Banana Bread Market

Countries CAGR (%)
United States 5.5%
United Kingdom 5.2%
Australia 5.0%
Canada 4.8%
Germany 4.5%

Global demand for banana based prompt is projected to grow at a 5.0% CAGR from 2025 to 2035. Among the five profiled markets out of 40 covered, the United States leads at 5.5%, followed by the United Kingdom at 5.2%, Australia at 5.0%, Canada at 4.8%, and Germany at 4.5%. These rates translate to a +10% premium for the United States, +4% for the United Kingdom, 0% for Australia (baseline), -4% for Canada, and -10% for Germany.

Industry divergence is influenced by growing demand for indulgent and better-for-you baked goods in North America and the UK, while Germany’s slower pace reflects greater consumer preference for traditional bakery formats and lower per capita consumption.

The report covers detailed analysis of 40+ countries, with the top five countries shared as a reference.

Consumption Analysis for Banana Bread in the United States

The banana loaf market in the United States is projected to expand at a 5.5% CAGR through 2035, driven by the convergence of home-baking culture, convenience snacking, and functional ingredient rotation. Retail volume in the packaged baked goods aisle surpassed 120,000 tons in 2024, with shelf-ready contributing nearly 18% of category revenue.

Peanut-free variants, high-fiber formulations, and individually wrapped snack portions continue to displace traditional loaf formats. Consumer interest has shifted toward clean-label, gluten-optional, and egg-free recipes, influencing co-packers and private-label brands operating across California, Illinois, and Pennsylvania.

  • Snack-pack banana loaf SKUs now represent 27% of USA retail volume
  • Over 9,000 bakeries added banana loaf to grab-and-go menus in 2024
  • Fiber-enriched variants saw 32% YoY growth among specialty food retailers

Germany’s Packaged Banana Bread Consumption Profile

Germany’s banana loaf industry is advancing at a 4.5% CAGR, supported by expanded demand in bio-certified and vegan formulations. Supermarkets and in-store bakeries have scaled up pre-sliced loaf formats with ambient shelf stability and resealable packaging. In 2024, banana loaf sales grew by over 14% in discount retail chains-especially in Berlin, Hamburg, and Stuttgart-where affordability and portion balance are core to product rotation. German consumers continue to adopt fruit-and-nut combinations and gluten-optional varieties, targeting midweek snacking and afternoon pairings with non-dairy beverages.

  • Pre-sliced banana loaf now accounts for 46% of supermarket shelf share
  • Bio and vegan-certified banana loaves up 29% YoY among urban households
  • Discount stores selling banana bread under EUR 2.50 grew their unit sales by 19%

Consumer Preferences for Banana Bread in the United Kingdom

The market in the UK is on track to grow at a 5.2% CAGR through 2035, reinforced by expanded availability in online grocery platforms and high street bakeries. Growth has been tied to meal deal bundling and after-school snacking, with banana bread featured in nearly 14% of pre-packed lunch promotions in 2024. Foodservice and café chains such as Pret and Greggs have rolled out rotating banana loaf options, including oat-based and dairy-light variants. Preference is rising for SKUs that balance sweetness with slow-release energy, especially in the 18-35 age bracket.

  • Meal-deal inclusion helped banana bread volume rise 22% YoY in retail foodservice
  • 41% of banana based bread offerings now feature nut-free or low-sugar labels
  • Oat-based banana loafs recorded the fastest uptake in Gen Z-led purchases

Baking Trends and Banana Bread Growth in Australia

Australia is seeing the demand grow at a 5.0% CAGR, with distribution expanding across cafes, institutional canteens, and fresh food markets. banana loaf is now a default item in over 75% of independent cafés, with toasted slices and vegan-compatible spreads gaining momentum. Pre-mix banana loaf kits for home baking saw a 17% increase in units shipped in 2024, with brands introducing variations like almond meal, buckwheat, and chia integration. Interest in freezer-friendly formats is also reshaping portion packaging, particularly among dual-income households.

  • Over 2,300 new banana bread SKUs launched in supermarkets and café chains since 2023
  • Pre-mix kits now represent 19% of total home-baking banana bread sales
  • Chia and almond flour blends showed 25% YoY growth in urban centres

Retail and Institutional Banana Bread Demand in Canada

The demand of banana breads in Canada is projected to grow at a 4.8% CAGR through 2035, supported by rising consumption in healthcare foodservice, school nutrition programs, and cold-chain bakery aisles. Quebec and Ontario account for nearly 64% of packaged bread retail distribution, with bilingual labeling formats enabling national brand expansion. Growth has been tied to reformulated snack loaves targeting sodium reduction and higher fiber content. Government-backed procurement in hospitals and aged care homes continues to push institutional volume, where these bread remains a preferred soft-texture food item.

  • Institutional banana bread demand up 16% in aged care and clinical settings
  • Fiber-boosted snack loaves now available in 71% of school catering contracts
  • Frozen banana based bread shipments increased by 21% YoY in 2024

Leading Banana Bread Supplier

The bread production is shaped by brands like General Mills, Bimbo Bakeries USA, Sara Lee, and emerging companies such as Mama Ka'z and Banana Bread Co. Larger players dominate retail aisles through product lines backed by scale and national reach. King Arthur Baking Company has introduced whole grain mixes for health-oriented buyers, while The Essential Baking Company focuses on extending shelf-life to improve inventory cycles in e-commerce. Companies are acquiring small bakeries to increase output and gain regional advantage, signalling gradual consolidation.

Smaller entrants face cost hurdles linked to commercial baking equipment, supply contracts, and distribution demands. While local bakeries hold space in artisan segments, broader retail penetration remains challenging without operational infrastructure or private-label partnerships to ease market access.

Recent Banana Bread Industry News

  • In January 2025 Dunkin, expanded its in-store banana bread menu across 1,000+ outlets through internal bakery upgrades.
  • February 2025, Papa Joe’s Bakehouse completed a bakery acquisition on the USA West Coast, targeting increased production.
  • March 2025, Bimbo Bakeries USA signed a logistics deal to reduce last-mile delivery time for DTC orders.

Leading Players

  • General Mills, Inc.
  • Banana Bread Co.
  • Mama Ka'z
  • King Arthur Baking Company, Inc.
  • Papa Joe's Bakehouse
  • The Essential Baking Company
  • Dunkin'
  • Bimbo Bakeries USA
  • Entenmann's
  • Sara Lee

Report Attributes

Attribute Details
Market Size (2025) USD 1.26 billion
Projected Market Size (2035) USD 4.87 billion
CAGR (2025 to 2035) 14.5%
Base Year for Estimation 2024
Historical Period 2020 to 2024
Forecast Period 2025 to 2035
Quantitative Units USD billion for value
Product Types Analyzed Unflavored Banana Bread, Flavored Banana Bread
Distribution Channels Analyzed Hypermarkets & Supermarkets, Convenience Stores, Online Platforms, Other Retail Formats
End Users Analyzed Commercial Consumers, Residential Consumers
Regions Covered North America, Latin America, Western Europe, Eastern Europe, South Asia & Pacific, East Asia, Central Asia, Balkan and Baltic Countries, Russia and Belarus, Middle East & Africa
Countries Covered United States, United Kingdom, Germany, Brazil, India, China, Australia, Russia, UAE
Key Players General Mills, Inc.; Banana Bread Co.; Mama Ka'z; King Arthur Baking Company, Inc.; Papa Joe's Bakehouse; The Essential Baking Company; Dunkin'; Bimbo Bakeries USA; Entenmann's; Sara Lee
Additional Attributes Dollar sales, share by flavored vs unflavored varieties, shifting preference toward home-baked and clean-label offerings, rising demand among Gen Z and millennial consumers, impact of online grocery and D2C bakery trends, regional taste variations and seasonal flavor innovation strategies, commercial demand from cafés and quick-service outlets.

Banana Bread Market Analyzed by Key Investment Segments

By Product Type:

The segment includes Unflavoured Banana Bread and Flavored Banana Bread varieties.

By Distribution Channel:

This category comprises Hypermarkets & Supermarkets, Convenience Stores, Online Platforms, and Other Retail Formats.

By End User:

Segmented into Commercial Consumers and Residential Consumers.

By Region:

Industry performance assessed across North America, Latin America, Western Europe, Eastern Europe, South Asia & Pacific, East Asia, Central Asia, Balkan and Baltic Countries, Russia and Belarus, and the Middle East & Africa.

Table of Content

  1. Executive Summary
    • Global Market Outlook
    • Demand-side Trends
    • Supply-side Trends
    • Technology Roadmap Analysis
    • Analysis and Recommendations
  2. Market Overview
    • Market Coverage / Taxonomy
    • Market Definition / Scope / Limitations
  3. Market Background
    • Market Dynamics
      • Drivers
      • Restraints
      • Opportunity
      • Trends
    • Scenario Forecast
      • Demand in Optimistic Scenario
      • Demand in Likely Scenario
      • Demand in Conservative Scenario
    • Opportunity Map Analysis
    • Product Life Cycle Analysis
    • Supply Chain Analysis
      • Supply Side Participants and their Roles
        • Producers
        • Mid-Level Participants (Traders/ Agents/ Brokers)
        • Wholesalers and Distributors
      • Value Added and Value Created at Node in the Supply Chain
      • List of Raw Material Suppliers
      • List of Existing and Potential Buyer’s
    • Investment Feasibility Matrix
    • Value Chain Analysis
      • Profit Margin Analysis
      • Wholesalers and Distributors
      • Retailers
    • PESTLE and Porter’s Analysis
    • Regulatory Landscape
      • By Key Regions
      • By Key Countries
    • Regional Parent Market Outlook
    • Production and Consumption Statistics
    • Import and Export Statistics
  4. Global Market Analysis 2020 to 2024 and Forecast, 2025 to 2035
    • Historical Market Size Value (USD Billion) & Volume (MT) Analysis, 2020 to 2024
    • Current and Future Market Size Value (USD Billion) & Volume (MT) Projections, 2025 to 2035
      • Y-o-Y Growth Trend Analysis
      • Absolute $ Opportunity Analysis
  5. Global Market Pricing Analysis 2020 to 2024 and Forecast 2025 to 2035
  6. Global Market Analysis 2020 to 2024 and Forecast 2025 to 2035, By Product Type
    • Introduction / Key Findings
    • Historical Market Size Value (USD Billion) & Volume (MT) Analysis By Product Type, 2020 to 2024
    • Current and Future Market Size Value (USD Billion) & Volume (MT) Analysis and Forecast By Product Type, 2025 to 2035
      • Unflavoured
      • Flavored
    • Y-o-Y Growth Trend Analysis By Product Type, 2020 to 2024
    • Absolute $ Opportunity Analysis By Product Type, 2025 to 2035
  7. Global Market Analysis 2020 to 2024 and Forecast 2025 to 2035, By Distribution Channel
    • Introduction / Key Findings
    • Historical Market Size Value (USD Billion) & Volume (MT) Analysis By Distribution Channel, 2020 to 2024
    • Current and Future Market Size Value (USD Billion) & Volume (MT) Analysis and Forecast By Distribution Channel, 2025 to 2035
      • Hypermarkets & Supermarkets
      • Convenience Stores
      • Online Platforms
      • Other Retail Platforms
    • Y-o-Y Growth Trend Analysis By Distribution Channel, 2020 to 2024
    • Absolute $ Opportunity Analysis By Distribution Channel, 2025 to 2035
  8. Global Market Analysis 2020 to 2024 and Forecast 2025 to 2035, By End User
    • Introduction / Key Findings
    • Historical Market Size Value (USD Billion) & Volume (MT) Analysis By End User, 2020 to 2024
    • Current and Future Market Size Value (USD Billion) & Volume (MT) Analysis and Forecast By End User, 2025 to 2035
      • Commercial Consumers
      • Residential Consumers
    • Y-o-Y Growth Trend Analysis By End User, 2020 to 2024
    • Absolute $ Opportunity Analysis By End User, 2025 to 2035
  9. Global Market Analysis 2020 to 2024 and Forecast 2025 to 2035, By Region
    • Introduction
    • Historical Market Size Value (USD Billion) & Volume (MT) Analysis By Region, 2020 to 2024
    • Current Market Size Value (USD Billion) & Volume (MT) Analysis and Forecast By Region, 2025 to 2035
      • North America
      • Latin America
      • Western Europe
      • Eastern Europe
      • East Asia
      • South Asia & Pacific
      • Middle East and Africa
    • Market Attractiveness Analysis By Region
  10. North America Market Analysis 2020 to 2024 and Forecast 2025 to 2035, By Country
    • Historical Market Size Value (USD Billion) & Volume (MT) Trend Analysis By Market Taxonomy, 2020 to 2024
    • Market Size Value (USD Billion) & Volume (MT) Forecast By Market Taxonomy, 2025 to 2035
      • By Country
        • USA
        • Canada
        • Mexico
      • By Product Type
      • By Distribution Channel
      • By End User
    • Market Attractiveness Analysis
      • By Country
      • By Product Type
      • By Distribution Channel
      • By End User
    • Key Takeaways
  11. Latin America Market Analysis 2020 to 2024 and Forecast 2025 to 2035, By Country
    • Historical Market Size Value (USD Billion) & Volume (MT) Trend Analysis By Market Taxonomy, 2020 to 2024
    • Market Size Value (USD Billion) & Volume (MT) Forecast By Market Taxonomy, 2025 to 2035
      • By Country
        • Brazil
        • Argentina
        • Rest of LATAM
      • By Product Type
      • By Distribution Channel
      • By End User
    • Market Attractiveness Analysis
      • By Country
      • By Product Type
      • By Distribution Channel
      • By End User
    • Key Takeaways
  12. Western Europe Market Analysis 2020 to 2024 and Forecast 2025 to 2035, By Country
    • Historical Market Size Value (USD Billion) & Volume (MT) Trend Analysis By Market Taxonomy, 2020 to 2024
    • Market Size Value (USD Billion) & Volume (MT) Forecast By Market Taxonomy, 2025 to 2035
      • By Country
        • Germany
        • Italy
        • France
        • UK
        • Spain
        • BENELUX
        • Nordic
        • Rest of W.Europe
      • By Product Type
      • By Distribution Channel
      • By End User
    • Market Attractiveness Analysis
      • By Country
      • By Product Type
      • By Distribution Channel
      • By End User
    • Key Takeaways
  13. Eastern Europe Market Analysis 2020 to 2024 and Forecast 2025 to 2035, By Country
    • Historical Market Size Value (USD Billion) & Volume (MT) Trend Analysis By Market Taxonomy, 2020 to 2024
    • Market Size Value (USD Billion) & Volume (MT) Forecast By Market Taxonomy, 2025 to 2035
      • By Country
        • Russia
        • Hungary
        • Poland
        • Balkan & Baltics
        • Rest of E. Europe
      • By Product Type
      • By Distribution Channel
      • By End User
    • Market Attractiveness Analysis
      • By Country
      • By Product Type
      • By Distribution Channel
      • By End User
    • Key Takeaways
  14. East Asia Market Analysis 2020 to 2024 and Forecast 2025 to 2035, By Country
    • Historical Market Size Value (USD Billion) & Volume (MT) Trend Analysis By Market Taxonomy, 2020 to 2024
    • Market Size Value (USD Billion) & Volume (MT) Forecast By Market Taxonomy, 2025 to 2035
      • By Country
        • China
        • Japan
        • South Korea
      • By Product Type
      • By Distribution Channel
      • By End User
    • Market Attractiveness Analysis
      • By Country
      • By Product Type
      • By Distribution Channel
      • By End User
    • Key Takeaways
  15. South Asia & Pacific Market Analysis 2020 to 2024 and Forecast 2025 to 2035, By Country
    • Historical Market Size Value (USD Billion) & Volume (MT) Trend Analysis By Market Taxonomy, 2020 to 2024
    • Market Size Value (USD Billion) & Volume (MT) Forecast By Market Taxonomy, 2025 to 2035
      • By Country
        • India
        • Australia & New Zealand
        • ASEAN
        • Rest of SAP
      • By Product Type
      • By Distribution Channel
      • By End User
    • Market Attractiveness Analysis
      • By Country
      • By Product Type
      • By Distribution Channel
      • By End User
    • Key Takeaways
  16. Middle East and Africa Market Analysis 2020 to 2024 and Forecast 2025 to 2035, By Country
    • Historical Market Size Value (USD Billion) & Volume (MT) Trend Analysis By Market Taxonomy, 2020 to 2024
    • Market Size Value (USD Billion) & Volume (MT) Forecast By Market Taxonomy, 2025 to 2035
      • By Country
        • GCC Countries
        • Northern Africa
        • South Africa
        • Turkiye
        • Rest of MEA
      • By Product Type
      • By Distribution Channel
      • By End User
    • Market Attractiveness Analysis
      • By Country
      • By Product Type
      • By Distribution Channel
      • By End User
    • Key Takeaways
  17. Key Countries Market Analysis
    • USA
      • Pricing Analysis
      • Market Share Analysis, 2024
        • By Product Type
        • By Distribution Channel
        • By End User
    • Canada
      • Pricing Analysis
      • Market Share Analysis, 2024
        • By Product Type
        • By Distribution Channel
        • By End User
    • Brazil
      • Pricing Analysis
      • Market Share Analysis, 2024
        • By Product Type
        • By Distribution Channel
        • By End User
    • Mexico
      • Pricing Analysis
      • Market Share Analysis, 2024
        • By Product Type
        • By Distribution Channel
        • By End User
    • Argentina
      • Pricing Analysis
      • Market Share Analysis, 2024
        • By Product Type
        • By Distribution Channel
        • By End User
  18. Market Structure Analysis
    • Competition Dashboard
    • Competition Benchmarking
    • Market Share Analysis of Top Players
      • By Regional
      • By Product Type
      • By Distribution Channel
      • By End User
  19. Competition Analysis
    • Competition Deep Dive
      • General Mills, Inc. Co.
        • Overview
        • Product Portfolio
        • Profitability by Market Segments (Product/Age /Sales Channel/Region)
        • Sales Footprint
        • Strategy Overview
          • Marketing Strategy
          • Product Strategy
          • Channel Strategy
      • Mama Ka'z
        • Overview
        • Product Portfolio
        • Profitability by Market Segments (Product/Age /Sales Channel/Region)
        • Sales Footprint
        • Strategy Overview
          • Marketing Strategy
          • Product Strategy
          • Channel Strategy
      • King Arthur Baking Company, Inc.
        • Overview
        • Product Portfolio
        • Profitability by Market Segments (Product/Age /Sales Channel/Region)
        • Sales Footprint
        • Strategy Overview
          • Marketing Strategy
          • Product Strategy
          • Channel Strategy
      • Papa Joe's Bakehouse
        • Overview
        • Product Portfolio
        • Profitability by Market Segments (Product/Age /Sales Channel/Region)
        • Sales Footprint
        • Strategy Overview
          • Marketing Strategy
          • Product Strategy
          • Channel Strategy
      • The Essential Baking Company
        • Overview
        • Product Portfolio
        • Profitability by Market Segments (Product/Age /Sales Channel/Region)
        • Sales Footprint
        • Strategy Overview
          • Marketing Strategy
          • Product Strategy
          • Channel Strategy
      • Dunkin'
        • Overview
        • Product Portfolio
        • Profitability by Market Segments (Product/Age /Sales Channel/Region)
        • Sales Footprint
        • Strategy Overview
          • Marketing Strategy
          • Product Strategy
          • Channel Strategy
      • Bimbo Bakeries USA
        • Overview
        • Product Portfolio
        • Profitability by Market Segments (Product/Age /Sales Channel/Region)
        • Sales Footprint
        • Strategy Overview
          • Marketing Strategy
          • Product Strategy
          • Channel Strategy
      • Entenmann's
        • Overview
        • Product Portfolio
        • Profitability by Market Segments (Product/Age /Sales Channel/Region)
        • Sales Footprint
        • Strategy Overview
          • Marketing Strategy
          • Product Strategy
          • Channel Strategy
      • Sara Lee
        • Overview
        • Product Portfolio
        • Profitability by Market Segments (Product/Age /Sales Channel/Region)
        • Sales Footprint
        • Strategy Overview
          • Marketing Strategy
          • Product Strategy
          • Channel Strategy
  20. Assumptions & Acronyms Used
  21. Research Methodology

List of Tables

  • Table 1: Global Market Value (USD Billion) Forecast by Region, 2020 to 2035
  • Table 2: Global Market Volume (MT) Forecast by Region, 2020 to 2035
  • Table 3: Global Market Value (USD Billion) Forecast by Product Type, 2020 to 2035
  • Table 4: Global Market Volume (MT) Forecast by Product Type, 2020 to 2035
  • Table 5: Global Market Value (USD Billion) Forecast by Distribution Channel, 2020 to 2035
  • Table 6: Global Market Volume (MT) Forecast by Distribution Channel, 2020 to 2035
  • Table 7: Global Market Value (USD Billion) Forecast by End User, 2020 to 2035
  • Table 8: Global Market Volume (MT) Forecast by End User, 2020 to 2035
  • Table 9: North America Market Value (USD Billion) Forecast by Country, 2020 to 2035
  • Table 10: North America Market Volume (MT) Forecast by Country, 2020 to 2035
  • Table 11: North America Market Value (USD Billion) Forecast by Product Type, 2020 to 2035
  • Table 12: North America Market Volume (MT) Forecast by Product Type, 2020 to 2035
  • Table 13: North America Market Value (USD Billion) Forecast by Distribution Channel, 2020 to 2035
  • Table 14: North America Market Volume (MT) Forecast by Distribution Channel, 2020 to 2035
  • Table 15: North America Market Value (USD Billion) Forecast by End User, 2020 to 2035
  • Table 16: North America Market Volume (MT) Forecast by End User, 2020 to 2035
  • Table 17: Latin America Market Value (USD Billion) Forecast by Country, 2020 to 2035
  • Table 18: Latin America Market Volume (MT) Forecast by Country, 2020 to 2035
  • Table 19: Latin America Market Value (USD Billion) Forecast by Product Type, 2020 to 2035
  • Table 20: Latin America Market Volume (MT) Forecast by Product Type, 2020 to 2035
  • Table 21: Latin America Market Value (USD Billion) Forecast by Distribution Channel, 2020 to 2035
  • Table 22: Latin America Market Volume (MT) Forecast by Distribution Channel, 2020 to 2035
  • Table 23: Latin America Market Value (USD Billion) Forecast by End User, 2020 to 2035
  • Table 24: Latin America Market Volume (MT) Forecast by End User, 2020 to 2035
  • Table 25: Western Europe Market Value (USD Billion) Forecast by Country, 2020 to 2035
  • Table 26: Western Europe Market Volume (MT) Forecast by Country, 2020 to 2035
  • Table 27: Western Europe Market Value (USD Billion) Forecast by Product Type, 2020 to 2035
  • Table 28: Western Europe Market Volume (MT) Forecast by Product Type, 2020 to 2035
  • Table 29: Western Europe Market Value (USD Billion) Forecast by Distribution Channel, 2020 to 2035
  • Table 30: Western Europe Market Volume (MT) Forecast by Distribution Channel, 2020 to 2035
  • Table 31: Western Europe Market Value (USD Billion) Forecast by End User, 2020 to 2035
  • Table 32: Western Europe Market Volume (MT) Forecast by End User, 2020 to 2035
  • Table 33: Eastern Europe Market Value (USD Billion) Forecast by Country, 2020 to 2035
  • Table 34: Eastern Europe Market Volume (MT) Forecast by Country, 2020 to 2035
  • Table 35: Eastern Europe Market Value (USD Billion) Forecast by Product Type, 2020 to 2035
  • Table 36: Eastern Europe Market Volume (MT) Forecast by Product Type, 2020 to 2035
  • Table 37: Eastern Europe Market Value (USD Billion) Forecast by Distribution Channel, 2020 to 2035
  • Table 38: Eastern Europe Market Volume (MT) Forecast by Distribution Channel, 2020 to 2035
  • Table 39: Eastern Europe Market Value (USD Billion) Forecast by End User, 2020 to 2035
  • Table 40: Eastern Europe Market Volume (MT) Forecast by End User, 2020 to 2035
  • Table 41: East Asia Market Value (USD Billion) Forecast by Country, 2020 to 2035
  • Table 42: East Asia Market Volume (MT) Forecast by Country, 2020 to 2035
  • Table 43: East Asia Market Value (USD Billion) Forecast by Product Type, 2020 to 2035
  • Table 44: East Asia Market Volume (MT) Forecast by Product Type, 2020 to 2035
  • Table 45: East Asia Market Value (USD Billion) Forecast by Distribution Channel, 2020 to 2035
  • Table 46: East Asia Market Volume (MT) Forecast by Distribution Channel, 2020 to 2035
  • Table 47: East Asia Market Value (USD Billion) Forecast by End User, 2020 to 2035
  • Table 48: East Asia Market Volume (MT) Forecast by End User, 2020 to 2035
  • Table 49: South Asia & Pacific Market Value (USD Billion) Forecast by Country, 2020 to 2035
  • Table 50: South Asia & Pacific Market Volume (MT) Forecast by Country, 2020 to 2035
  • Table 51: South Asia & Pacific Market Value (USD Billion) Forecast by Product Type, 2020 to 2035
  • Table 52: South Asia & Pacific Market Volume (MT) Forecast by Product Type, 2020 to 2035
  • Table 53: South Asia & Pacific Market Value (USD Billion) Forecast by Distribution Channel, 2020 to 2035
  • Table 54: South Asia & Pacific Market Volume (MT) Forecast by Distribution Channel, 2020 to 2035
  • Table 55: South Asia & Pacific Market Value (USD Billion) Forecast by End User, 2020 to 2035
  • Table 56: South Asia & Pacific Market Volume (MT) Forecast by End User, 2020 to 2035
  • Table 57: Middle East and Africa Market Value (USD Billion) Forecast by Country, 2020 to 2035
  • Table 58: Middle East and Africa Market Volume (MT) Forecast by Country, 2020 to 2035
  • Table 59: Middle East and Africa Market Value (USD Billion) Forecast by Product Type, 2020 to 2035
  • Table 60: Middle East and Africa Market Volume (MT) Forecast by Product Type, 2020 to 2035
  • Table 61: Middle East and Africa Market Value (USD Billion) Forecast by Distribution Channel, 2020 to 2035
  • Table 62: Middle East and Africa Market Volume (MT) Forecast by Distribution Channel, 2020 to 2035
  • Table 63: Middle East and Africa Market Value (USD Billion) Forecast by End User, 2020 to 2035
  • Table 64: Middle East and Africa Market Volume (MT) Forecast by End User, 2020 to 2035

List of Figures

  • Figure 1: Global Market Volume (MT) Forecast 2020 to 2035
  • Figure 2: Global Market Pricing Analysis
  • Figure 3: Global Market Value (USD Billion) Forecast 2020 to 2035
  • Figure 4: Global Market Value Share and BPS Analysis by Product Type, 2025 and 2035
  • Figure 5: Global Market Y-o-Y Growth Comparison by Product Type, 2025 to 2035
  • Figure 6: Global Market Attractiveness Analysis by Product Type
  • Figure 7: Global Market Value Share and BPS Analysis by Distribution Channel, 2025 and 2035
  • Figure 8: Global Market Y-o-Y Growth Comparison by Distribution Channel, 2025 to 2035
  • Figure 9: Global Market Attractiveness Analysis by Distribution Channel
  • Figure 10: Global Market Value Share and BPS Analysis by End User, 2025 and 2035
  • Figure 11: Global Market Y-o-Y Growth Comparison by End User, 2025 to 2035
  • Figure 12: Global Market Attractiveness Analysis by End User
  • Figure 13: Global Market Value (USD Billion) Share and BPS Analysis by Region, 2025 and 2035
  • Figure 14: Global Market Y-o-Y Growth Comparison by Region, 2025 to 2035
  • Figure 15: Global Market Attractiveness Analysis by Region
  • Figure 16: North America Market Incremental $ Opportunity, 2025 to 2035
  • Figure 17: Latin America Market Incremental $ Opportunity, 2025 to 2035
  • Figure 18: Western Europe Market Incremental $ Opportunity, 2025 to 2035
  • Figure 19: Eastern Europe Market Incremental $ Opportunity, 2025 to 2035
  • Figure 20: East Asia Market Incremental $ Opportunity, 2025 to 2035
  • Figure 21: South Asia & Pacific Market Incremental $ Opportunity, 2025 to 2035
  • Figure 22: Middle East and Africa Market Incremental $ Opportunity, 2025 to 2035
  • Figure 23: North America Market Value Share and BPS Analysis by Country, 2025 and 2035
  • Figure 24: North America Market Value Share and BPS Analysis by Product Type, 2025 and 2035
  • Figure 25: North America Market Y-o-Y Growth Comparison by Product Type, 2025 to 2035
  • Figure 26: North America Market Attractiveness Analysis by Product Type
  • Figure 27: North America Market Value Share and BPS Analysis by Distribution Channel, 2025 and 2035
  • Figure 28: North America Market Y-o-Y Growth Comparison by Distribution Channel, 2025 to 2035
  • Figure 29: North America Market Attractiveness Analysis by Distribution Channel
  • Figure 30: North America Market Value Share and BPS Analysis by End User, 2025 and 2035
  • Figure 31: North America Market Y-o-Y Growth Comparison by End User, 2025 to 2035
  • Figure 32: North America Market Attractiveness Analysis by End User
  • Figure 33: Latin America Market Value Share and BPS Analysis by Country, 2025 and 2035
  • Figure 34: Latin America Market Value Share and BPS Analysis by Product Type, 2025 and 2035
  • Figure 35: Latin America Market Y-o-Y Growth Comparison by Product Type, 2025 to 2035
  • Figure 36: Latin America Market Attractiveness Analysis by Product Type
  • Figure 37: Latin America Market Value Share and BPS Analysis by Distribution Channel, 2025 and 2035
  • Figure 38: Latin America Market Y-o-Y Growth Comparison by Distribution Channel, 2025 to 2035
  • Figure 39: Latin America Market Attractiveness Analysis by Distribution Channel
  • Figure 40: Latin America Market Value Share and BPS Analysis by End User, 2025 and 2035
  • Figure 41: Latin America Market Y-o-Y Growth Comparison by End User, 2025 to 2035
  • Figure 42: Latin America Market Attractiveness Analysis by End User
  • Figure 43: Western Europe Market Value Share and BPS Analysis by Country, 2025 and 2035
  • Figure 44: Western Europe Market Value Share and BPS Analysis by Product Type, 2025 and 2035
  • Figure 45: Western Europe Market Y-o-Y Growth Comparison by Product Type, 2025 to 2035
  • Figure 46: Western Europe Market Attractiveness Analysis by Product Type
  • Figure 47: Western Europe Market Value Share and BPS Analysis by Distribution Channel, 2025 and 2035
  • Figure 48: Western Europe Market Y-o-Y Growth Comparison by Distribution Channel, 2025 to 2035
  • Figure 49: Western Europe Market Attractiveness Analysis by Distribution Channel
  • Figure 50: Western Europe Market Value Share and BPS Analysis by End User, 2025 and 2035
  • Figure 51: Western Europe Market Y-o-Y Growth Comparison by End User, 2025 to 2035
  • Figure 52: Western Europe Market Attractiveness Analysis by End User
  • Figure 53: Eastern Europe Market Value Share and BPS Analysis by Country, 2025 and 2035
  • Figure 54: Eastern Europe Market Value Share and BPS Analysis by Product Type, 2025 and 2035
  • Figure 55: Eastern Europe Market Y-o-Y Growth Comparison by Product Type, 2025 to 2035
  • Figure 56: Eastern Europe Market Attractiveness Analysis by Product Type
  • Figure 57: Eastern Europe Market Value Share and BPS Analysis by Distribution Channel, 2025 and 2035
  • Figure 58: Eastern Europe Market Y-o-Y Growth Comparison by Distribution Channel, 2025 to 2035
  • Figure 59: Eastern Europe Market Attractiveness Analysis by Distribution Channel
  • Figure 60: Eastern Europe Market Value Share and BPS Analysis by End User, 2025 and 2035
  • Figure 61: Eastern Europe Market Y-o-Y Growth Comparison by End User, 2025 to 2035
  • Figure 62: Eastern Europe Market Attractiveness Analysis by End User
  • Figure 63: East Asia Market Value Share and BPS Analysis by Country, 2025 and 2035
  • Figure 64: East Asia Market Value Share and BPS Analysis by Product Type, 2025 and 2035
  • Figure 65: East Asia Market Y-o-Y Growth Comparison by Product Type, 2025 to 2035
  • Figure 66: East Asia Market Attractiveness Analysis by Product Type
  • Figure 67: East Asia Market Value Share and BPS Analysis by Distribution Channel, 2025 and 2035
  • Figure 68: East Asia Market Y-o-Y Growth Comparison by Distribution Channel, 2025 to 2035
  • Figure 69: East Asia Market Attractiveness Analysis by Distribution Channel
  • Figure 70: East Asia Market Value Share and BPS Analysis by End User, 2025 and 2035
  • Figure 71: East Asia Market Y-o-Y Growth Comparison by End User, 2025 to 2035
  • Figure 72: East Asia Market Attractiveness Analysis by End User
  • Figure 73: South Asia & Pacific Market Value Share and BPS Analysis by Country, 2025 and 2035
  • Figure 74: South Asia & Pacific Market Value Share and BPS Analysis by Product Type, 2025 and 2035
  • Figure 75: South Asia & Pacific Market Y-o-Y Growth Comparison by Product Type, 2025 to 2035
  • Figure 76: South Asia & Pacific Market Attractiveness Analysis by Product Type
  • Figure 77: South Asia & Pacific Market Value Share and BPS Analysis by Distribution Channel, 2025 and 2035
  • Figure 78: South Asia & Pacific Market Y-o-Y Growth Comparison by Distribution Channel, 2025 to 2035
  • Figure 79: South Asia & Pacific Market Attractiveness Analysis by Distribution Channel
  • Figure 80: South Asia & Pacific Market Value Share and BPS Analysis by End User, 2025 and 2035
  • Figure 81: South Asia & Pacific Market Y-o-Y Growth Comparison by End User, 2025 to 2035
  • Figure 82: South Asia & Pacific Market Attractiveness Analysis by End User
  • Figure 83: Middle East and Africa Market Value Share and BPS Analysis by Country, 2025 and 2035
  • Figure 84: Middle East and Africa Market Value Share and BPS Analysis by Product Type, 2025 and 2035
  • Figure 85: Middle East and Africa Market Y-o-Y Growth Comparison by Product Type, 2025 to 2035
  • Figure 86: Middle East and Africa Market Attractiveness Analysis by Product Type
  • Figure 87: Middle East and Africa Market Value Share and BPS Analysis by Distribution Channel, 2025 and 2035
  • Figure 88: Middle East and Africa Market Y-o-Y Growth Comparison by Distribution Channel, 2025 to 2035
  • Figure 89: Middle East and Africa Market Attractiveness Analysis by Distribution Channel
  • Figure 90: Middle East and Africa Market Value Share and BPS Analysis by End User, 2025 and 2035
  • Figure 91: Middle East and Africa Market Y-o-Y Growth Comparison by End User, 2025 to 2035
  • Figure 92: Middle East and Africa Market Attractiveness Analysis by End User
  • Figure 93: Global Market - Tier Structure Analysis
  • Figure 94: Global Market - Company Share Analysis

Frequently Asked Questions

What is the projected CAGR and market value of the banana bread market from 2025 to 2035?

The global banana bread market is expected to expand at a CAGR of 14.5% from 2025 to 2035, reaching USD 4.87 billion by 2035, up from USD 1.26 billion in 2025.

Which product type leads the banana bread market?

Unflavoured banana bread holds the largest share, accounting for 55% of the market.

What is the role of e-commerce in banana bread distribution?

E-commerce contributes 40% to total banana bread sales, driven by growing demand for direct-to-consumer and convenient online options.

Which country is expected to witness the fastest growth in banana bread consumption?

The United States leads in growth, with a projected CAGR of 5.5% between 2025 and 2035.

Who is the leading player in the banana bread market?

General Mills holds a 17% share, positioning itself as a major driver of product evolution and retail consolidation.

Explore Similar Insights

Future Market Insights

Banana Bread Market