Baby Food Market Size, Share, and Forecast Outlook 2025 to 2035

The baby food market is forecast to reach USD 213.21 billion by 2035, rising from USD 85.25 billion in 2025, at a CAGR of 9.6%. Product diversification has moved beyond basic nutrition to clinical-grade formulations, prompted by paediatric guidelines tightening across Asia-Pacific and the EU.
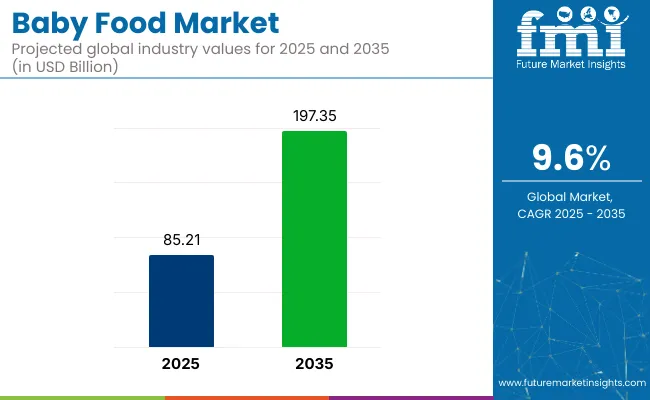
Quick Stats for Baby Food Market

  • Market Value (2025): USD 85.25 billion
  • Forecast Value (2035): USD 213.21 billion
  • Forecast CAGR (2025 to 2035): 9.6%
  • Leading Segment in 2035: 0-24 months, special milk formula (18.2% in 2025)
  • Leading Country: Australia (CAGR 11.3%)
  • Key Players: Nestlé, Abbott, Danone, Anand Milk Union Limited, Mead Johnson Nutrition India / Reckitt Benckiser, Manna Foods

Baby Food Market

Metric Value
Market Value (2025) USD 85.25 billion
Market Value (2035) USD 213.21 billion
CAGR (2025 to 2035) 9.6%

Multinationals are focusing on enzymatic hydrolysis of cow milk proteins to target preterm infants and allergy-prone newborns, pushing specialised formulations such as DHA-enhanced or prebiotic variants. The increasing demand for controlled nutrient-release systems has led to investments in wet-blending and high-shear mixing equipment.

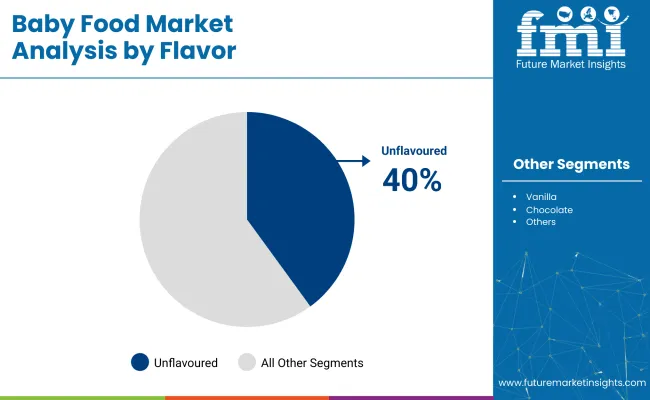
Flavour-neutral blends dominate, with unflavoured holding 40.0% share, aligning with regulatory discouragement of added sugars for infants under two. Special milk formulas have gained traction in clinical nutrition settings, though they account for just 18.2% of 2025 sales. Growth is being driven by neonatal intensive care units favouring protein-hydrolysed mixes to address early malabsorption risks.

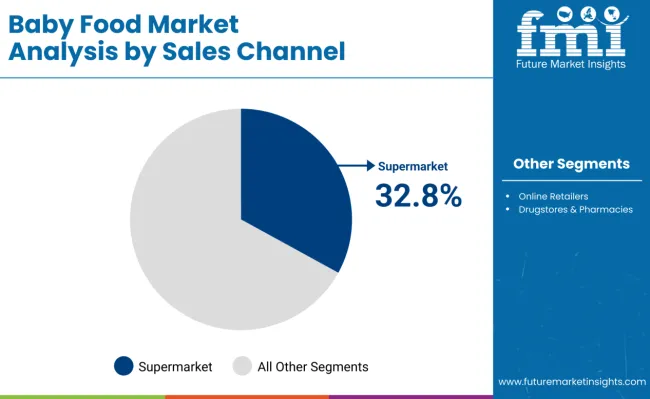
Supermarkets retain 32.8% share through shelf-stable stage-one products, leveraging bundled promotions. Australia’s 11.3% CAGR stems from stringent local standards-such as FSANZ nutrient caps and DHA requirements-which have enabled local processors to meet high-barrier export approvals in East Asia.

Collaborations and partnerships keep the industry active and competitive. Pristine Pearl Pharma and Dutch Medical Food BV formed a strategic collaboration to introduce personalized medical nutrition products in India, addressing disease-related malnutrition.

The industry holds a smaller share in its parent markets. Within the food and beverage market, it accounts for around 3-5%, as baby food is a niche segment within the broader food sector. In the infant nutrition market, the share is higher at approximately 20-25%, driven by the growing demand for specialized nutrition for infants.

The packaged food market sees a contribution of about 4-6%, reflecting the popularity of convenient baby food products. The organic food market holds around 2-4%, due to rising demand for organic baby food options. In the retail market, the baby food market makes up about 3-5%, influenced by the growth of both physical and online retail channels for infant food products.

Analysis of Baby Food Market by Top Investment Segments

In 2025, growth within the industry has concentrated in special milk formulas, supermarket retailing, unflavoured variants, and bag-in-box packaging. Each segment is shaped by formulation regulations, distribution efficiency, ingredient policies, and packaging performance under controlled environments.
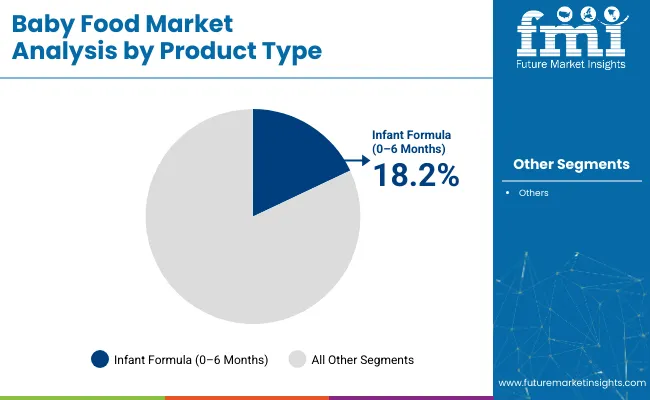
Special Milk Formula Holds Infant Nutrition Investment

A 18.2% share has been accounted by 0-24 month special milk formula in 2025. This segment benefits from prescription-linked usage, regulatory approvals, and strong positioning in clinical feeding protocols where breastfeeding is not feasible.
  • Codex-based nutrient thresholds are maintained to meet compliance across national food control systems.
  • DHA and ARA are integrated for neural development support, as permitted by pediatric guidelines.
  • Distribution is aligned with hospital pharmacies and clinical retail zones to ensure direct caregiver access.
  • Unique lot coding supports traceability audits and recalls, aiding regional batch oversight.
  • Fat matrix stabilization allows compatibility with pharma-grade cold chain networks for logistics.

Supermarkets Dominate Retail Distribution Share

A 32.8% share has been held by supermarkets in 2025, supported by format coverage, inventory rotation systems, and cross-category bundling strategies focused on new parents.
  • Infant nutrition sections are equipped with end caps that group purées, formulas, and accessories.
  • Automated pricing updates via electronic shelf labels track dairy-based cost changes in real time.
  • QR-linked labels support product traceability and allergen verification at the point of purchase.
  • Refrigerated bays store ready-to-feed formulas under stable temperatures without central warehousing delay.
  • Click-and-collect lanes shorten last-mile delivery windows for caregivers requiring temperature-sensitive products.

Unflavoured Variants Dominate Flavor Preference Segment

A 40% share has been accounted for by unflavoured food in 2025, owing to ingredient simplicity, pediatric recommendations, and reduced labeling complexities tied to regulatory disclosure rules. Sweeteners and salt are excluded to conform with WHO dietary thresholds for infants under 2 years.
  • Single-ingredient purées allow low heavy-metal risk and simpler nutrition analysis.
  • Mild taste improves acceptance rates when transitioning from milk to solids.
  • Labeling across multilingual SKUs is simplified due to absence of additives.
  • Lack of flavorings and colorants minimizes oxidative degradation and off-notes during ambient storage.

Baby Food Market Analysis By Flavor

Bags in Boxes Lead Packaging Choice Segment

A 35% share has been held by bags in boxes in 2025, attributed to their structural protection, dosing precision, and resilience across transport and retail channels.

  • Inner liners use multilayer films flushed with nitrogen to prevent fat oxidation during storage.
  • Gusseted bags allow uniform dispensing in humid conditions, preventing caking or scoop jamming.
  • Carton surfaces support printing of feeding schedules, trace codes, and allergen callouts.
  • Box geometry improves pallet efficiency and reduces unit freight cost in container shipments.
  • Tear-strip openings meet EU food-contact safety regulations without the use of foil or metal seals.

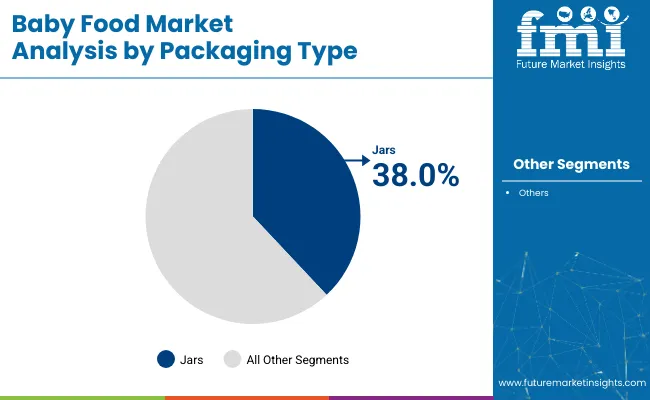
Baby Food Market Analysis By Packaging Type

Top Baby Food Market Dynamics

Product formulation shifts and regulatory enforcement are giving a direction to the industry. Innovations are being driven by compositional scrutiny and traceability requirements across regions with strong infant food regulation, particularly the EU, USA, and select ASEAN countries.

Compositional Reforms Responding to Parental Ingredient Concerns

Brands are being pushed to reformulate based on flagged additives, processing residues, and micronutrient inconsistencies. Parental concerns over maltodextrin, excess sugar, and palm oil content have led to product recalls and delistings in France and Germany. DSM and Arla are introducing custom infant-grade ingredients to align with stricter guidelines from EFSA and Codex Alimentarius. Multinational retailers have begun conducting independent lab checks before listing new SKUs. Clean compositions with region-specific fortification are crucial for shelf access in pharmacies and premium retail chains.

  • Reformulation is being led by nutrient purity and additive removal mandates.
  • In-house and third-party testing protocols are expanded across European distribution networks.
  • Ingredient suppliers are launching infant-compliant blends tailored to regional nutrient norms.

Traceability Standards Raising Entry Barriers for New Entrants

Global traceability enforcement has increased sharply after contamination incidents in powdered formulas. Regulations in China and the EU now require source tracing for every input in the supply chain. Platforms like TraceOne and iFoodDS have been implemented by processors and distributors to log ingredient origin, process flow, and batch validation. Local brands in India and Indonesia are facing rejection from modern trade due to unverifiable sourcing. Companies without traceable vendor ecosystems are struggling to maintain buyer confidence or meet export clearance norms.
  • Ingredient-level traceability systems are becoming mandatory in cross-border infant food trade.
  • Digital compliance tools are being adopted to track raw material flow from origin to pack-out.
  • Unverified regional brands are losing access to premium retail and pharmacy outlets.

Top Countries Producing, Importing, and Distributing Baby Food

Baby Food Market Country Wise Analysis

Country CAGR (2025 to 2035)
Australia 11.3%
Germany 10.4%
United States 9.3%
India 8.2%
China 7.5%

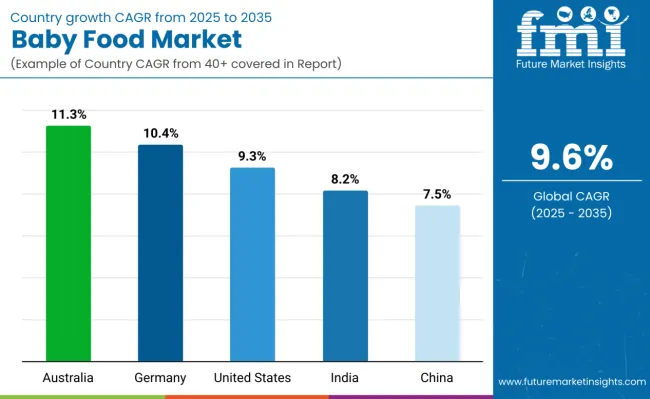
Global baby food industry growth is being led by Australia at a 11.3% CAGR, followed by Germany at 10.4%, and the United States at 9.3%. India stands at 8.2%, while China follows with a 7.5% CAGR. All five countries outperform the estimated global average, reflecting distinct regulatory, demographic, and supply chain catalysts across regions.

Growth premiums range from +1.2 to +5.3 percentage points over baseline CAGR, with Australia’s export-led growth delivering the highest margin. Australia outpaces global CAGR by +5.3 points, driven by regulatory rigor and export focus. Germany posts a +4.4 point premium due to rising demand for premium, non-GMO formulations.

United States exceeds by +3.3 points, backed by USDA and FDA-backed safety initiatives. India maintains a +2.2 point lead, supported by targeted rural nutrition programs and infrastructure incentives. China achieves a +1.2 point premium, sustained by traceability mandates and domestic innovation support. These countries are shaping global dynamics in the baby food segment, balancing domestic demand with cross-border distribution strengths. The report covers detailed analysis across 40+ countries.

Baby Food Sales Outlook in the United States

The baby food market in the United States is expected to grow at a CAGR of 9.3% from 2025 to 2035. The FDA’s Closer to Zero initiative redefined heavy metal thresholds, prompting recipe reformulations across mainstream and specialty brands. USDA’s fast-tracked organic approvals have increased the shelf presence of certified infant products.

Momentum is also coming from pediatric nutrition startups leveraging DTC models with clinical endorsements. Some states have introduced grants to incentivize local ingredient sourcing for infant purées. Clinical trials supported by the NIH are increasing confidence in hypoallergenic formulas.

  • FDA’s Closer to Zero guidelines enforce lower metal limits in baby food
  • USDA approval acceleration raises certified organic food availability
  • State-level subsidies encourage local sourcing of infant nutrition ingredients

Baby Food Market Expansion in Germany

The baby food market in Germany is projected to grow at a CAGR of 10.4% from 2025 to 2035. Federal regulations on lactose, sweeteners, and pesticide residues have raised the compliance bar above EU norms. Non-GMO and biodynamic farming alliances have integrated directly into infant food supply chains.

The Federal Ministry of Food and Agriculture includes quality in its nutrition policy roadmap. Regional procurement for hospitals and daycare centers favors certified local producers. Retail expansion is being led by niche companies specializing in ultra-clean formulations for newborns and toddlers.

  • Infant formula must meet stricter thresholds than EU’s general food safety limits
  • Public-sector buyers favor certified regional producers for child nutrition programs
  • Biodynamic supply chains integrated with premium infant food manufacturing hubs

Baby Food Market Growth Trajectory in China

The baby food market in China is forecast to expand at a CAGR of 7.5% from 2025 to 2035. Regulations by SAMR now require end-to-end traceability, including QR-coded batch histories for all infant nutrition products. Import-dependent categories like infant formula have been included in Free Trade Zone (FTZ) fast lanes to reduce bottlenecks.

Government innovation grants are supporting domestic R&D to replace key imported micronutrients. Regional governments have launched pilot initiatives linking maternal health clinics with certified providers. Tier-1 cities are the core demand centers for high-end food imports.

  • SAMR mandates batch-level traceability on all packaged infant nutrition products
  • FTZs reduce customs lead time for premium infant formula imports
  • State grants support domestic innovation in micronutrient-enriched infant food

Baby Food Market Growth Outlook in Australia

The baby food market in Australia is anticipated to grow at a CAGR of 11.3% from 2025 to 2035. FSANZ imposes among the world’s strictest safety requirements for infant nutrition, creating a quality benchmark for local and export products. The Infant Nutrition Council oversees a dual-certification program to support ASEAN-bound product approvals.

State governments have extended infrastructure incentives to manufacturers using locally sourced produce. Export-focused production has accelerated across Victoria and New South Wales, positioning Australian brands in high-value regional industries. Clinical partnerships are being formed with pediatric hospitals to trial new allergen-free blends.

  • FSANZ sets stringent production and packaging rules for infant nutrition products
  • Infant Nutrition Council dual-certifies brands for export within ASEAN region
  • State programs incentivize use of local produce in fortified food

Baby Food Market Sales Analysis in India

The baby food market in India is expected to grow at a CAGR of 8.2% between 2025 and 2035. The Ministry of Women and Child Development has expanded POSHAN Abhiyaan to include private-sector fortified food in government programs. FSSAI has revised licensing to allow greater flexibility for regional producers. Growth is shifting from metros to tier 2 and tier 3 cities due to rising institutional demand. Government-aided ICDS centers are increasingly procuring blended infant meals from certified suppliers. New labelling rules now require declaration of every nutrient added to infant formulations above minimal levels.
  • POSHAN Abhiyaan scale-up opens ICDS procurement to private-sector fortified foods
  • FSSAI licensing reforms support regional and small-scale infant food units
  • Procurement from ICDS centers increasing for certified blended nutrition products

Leading Suppliers in the Baby Food Industry

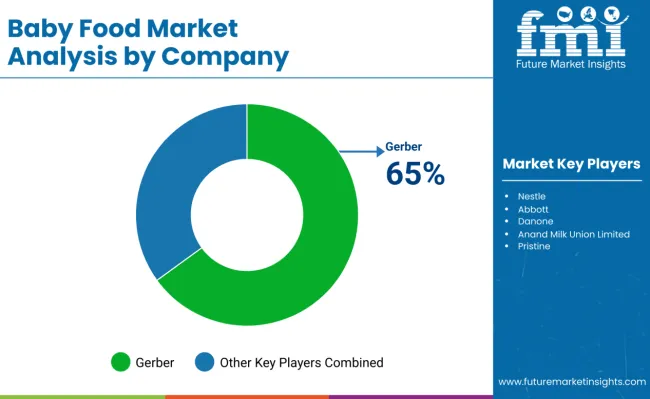
The baby food market is highly competitive, with leaders like Nestlé, Abbott, Danone, and Reckitt Benckiser (Mead Johnson) holding large shares. These companies leverage strong brand recognition, vast distribution networks, and heavy investments in marketing. Nestlé dominates with products like Gerber and Cerelac, while Abbott and Danone cater to premium segments with brands like Similac and Aptamil. Reckitt Benckiser bolsters its position through Enfamil. Emerging players such as Manna Foods, Pristine, and Tiny Spoons target niche markets, offering organic and locally sourced options. The market is moderately fragmented, driven by innovation from both large and small companies. As demand for diverse and high-quality food grows, the competitive landscape is constantly changing.

Recent Industry News

  • Nestlé India introduced 14 variants of its Cerelac baby cereal line without refined sugar, aiming to align with global health standards. This move follows scrutiny over sugar content in products sold in low-income countries.
  • Danone India launched AptaGrow, a nutritional supplement for children aged 3-6 years, featuring 37 nutrients and a unique prebiotic blend to support growth, brain development, and immunity.
  • Manna Foods introduced new products, including sprouted ragi with dates and banana. The product has 100% natural ingredients. These offerings cater to infants aged 6 months and above.

Key Players

  • Nestle
  • Abbott
  • Danone
  • Anand Milk Union Limited
  • Mead Johnson Nutrition India /Reckitt Benckiser
  • Manna Foods.
  • Pristine
  • Mightly Steps Private Limited
  • The Great Banyan
  • Tiny Spoons
  • Gerber - Nestlé Sub
  • Nurture, Inc.
  • Heinz
  • Hain Celestial Group
  • Ella’s Kitchen
  • Sprout
  • Plum Organics
  • Hero Group
  • HiPP
  • Others

Report Coverage and Scope Summary

Report Attributes Key Insights
Estimated Market Value (2025) USD 85.25 billion
Projected Market Value (2035) USD 213.21 billion
CAGR (2025 to 2035) 9.6%
Base Year for Estimation 2024
Historical Period 2020 to 2024
Forecast Period 2025 to 2035
Quantitative Units Revenue in USD billion
Product Type Infant Formula, Complementary Food
Flavor Unflavoured, Vanilla, Chocolate, Berries, Mango, Apple, Banana, Mixed Fruits, Others
Packaging Type Bags in Boxes, Pouches, Jars, Can/Tins, Others
Sales Channel Store-based (Hypermarkets, Supermarkets, Drugstores & Pharmacies, Convenience Stores, Grocery Stores, Baby Specialty Stores), Online Retailers
Region North America, Latin America, Europe, East Asia, South Asia, Oceania, Middle East & Africa
Countries Covered United States, Canada, Mexico, Brazil, Argentina, Germany, France, United Kingdom, Italy, Spain, Netherlands, China, India, Japan, South Korea, ANZ, GCC Countries, South Africa
Key Players Nestle, Abbott, Danone, Anand Milk Union Limited, Mead Johnson Nutrition India /Reckitt Benckiser, Manna Foods, Pristine, Mightly Steps Private Limited, The Great Banyan, Tiny Spoons, Gerber - Nestlé Sub, Nurture, Inc., Heinz, Hain Celestial Group, Ella’s Kitchen, Sprout, Plum Organics, Hero Group, HiPP, Others
Additional Attributes Dollar sales, CAGR trends, product type distribution, flavor preferences, packaging preferences, competitor dollar sales & market share, regional growth patterns, sales channel trends, end-user segmentation

Key Segments Analyzed

By Product Type:

The segmentation is into Infant Formula (0 to 6 Months - Starting Infant Formula, 6 to 12 Months - Follow-on Milk Formula, 12 to 24 Months - Toddlers Milk Formula, and 0 to 24 Months - Special Milk Formula), and Complementary Food (6 to 24 Months) (Fruit and Vegetable Puree, Baby Cereals, and Baby Porridge).

By Flavor:

The segmentation is into Unflavoured, Vanilla, Chocolate, Berries, Mango, Apple, Banana, Mixed Fruits, and Others (nuts, honey).

By Packaging Type:

The segmentation is into Bags in Boxes, Pouches, Jars, Can/Tins, and Others (Small Tubs).

By Sales Channel:

The segmentation is into store-based (Hypermarkets, Supermarkets, Drugstores & Pharmacies, Convenience Stores, Grocery Stores, and Baby Specialty Stores), and Online Retailers.

By Region:

The segmentation is into North America, Latin America, Europe, East Asia, South Asia, Oceania, and the Middle East & Africa.

Table of Content

  1. Executive Summary
    • Global Market Outlook
    • Demand-side Trends
    • Supply-side Trends
    • Technology Roadmap Analysis
    • Analysis and Recommendations
  2. Market Overview
    • Market Coverage / Taxonomy
    • Market Definition / Scope / Limitations
  3. Market Background
    • Market Dynamics
      • Drivers
      • Restraints
      • Opportunity
      • Trends
    • Scenario Forecast
      • Demand in Optimistic Scenario
      • Demand in Likely Scenario
      • Demand in Conservative Scenario
    • Opportunity Map Analysis
    • Product Life Cycle Analysis
    • Supply Chain Analysis
      • Supply Side Participants and their Roles
        • Producers
        • Mid-Level Participants (Traders/ Agents/ Brokers)
        • Wholesalers and Distributors
      • Value Added and Value Created at Node in the Supply Chain
      • List of Raw Material Suppliers
      • List of Existing and Potential Buyer’s
    • Investment Feasibility Matrix
    • Value Chain Analysis
      • Profit Margin Analysis
      • Wholesalers and Distributors
      • Retailers
    • PESTLE and Porter’s Analysis
    • Regulatory Landscape
      • By Key Regions
      • By Key Countries
    • Regional Parent Market Outlook
    • Production and Consumption Statistics
    • Import and Export Statistics
  4. Global Market Analysis 2020 to 2024 and Forecast, 2025 to 2035
    • Historical Market Size Value (USD Billion) & Million Units Analysis, 2020 to 2024
    • Current and Future Market Size Value (USD Billion) & Million Units Projections, 2025 to 2035
      • Y-o-Y Growth Trend Analysis
      • Absolute $ Opportunity Analysis
  5. Global Market Pricing Analysis 2020 to 2024 and Forecast 2025 to 2035
  6. Global Market Analysis 2020 to 2024 and Forecast 2025 to 2035, By Product Type
    • Introduction / Key Findings
    • Historical Market Size Value (USD Billion) & Million Units Analysis By Product Type, 2020 to 2024
    • Current and Future Market Size Value (USD Billion) & Million Units Analysis and Forecast By Product Type, 2025 to 2035
      • Infant Formula
        • 0 to 6 Months - Starting Infant Formula
        • 6 to 12 Months - Follow-on Milk Formula
        • 12 to 24 Months - Toddlers Milk Formula
        • 0 to 24 Months - Special Milk Formula
      • Complementary Food
        • 6 to 24 Months
        • Fruit and Vegetable Puree
        • Baby Cereals
        • Baby Porridge
    • Y-o-Y Growth Trend Analysis By Product Type, 2020 to 2024
    • Absolute $ Opportunity Analysis By Product Type, 2025 to 2035
  7. Global Market Analysis 2020 to 2024 and Forecast 2025 to 2035, By Flavor
    • Introduction / Key Findings
    • Historical Market Size Value (USD Billion) & Million Units Analysis By Flavor, 2020 to 2024
    • Current and Future Market Size Value (USD Billion) & Million Units Analysis and Forecast By Flavor, 2025 to 2035
      • Unflavoured
      • Vanilla
      • Chocolate
      • Berries
      • Mango
      • Apple
      • Banana
      • Mixed Fruits
      • Others
        • Nuts
        • Honey
    • Y-o-Y Growth Trend Analysis By Flavor, 2020 to 2024
    • Absolute $ Opportunity Analysis By Flavor, 2025 to 2035
  8. Global Market Analysis 2020 to 2024 and Forecast 2025 to 2035, By Packaging Type
    • Introduction / Key Findings
    • Historical Market Size Value (USD Billion) & Million Units Analysis By Packaging Type, 2020 to 2024
    • Current and Future Market Size Value (USD Billion) & Million Units Analysis and Forecast By Packaging Type, 2025 to 2035
      • Bags in Boxes
      • Pouches
      • Jars
      • Can/Tins
      • Others
        • Small Tubs
    • Y-o-Y Growth Trend Analysis By Packaging Type, 2020 to 2024
    • Absolute $ Opportunity Analysis By Packaging Type, 2025 to 2035
  9. Global Market Analysis 2020 to 2024 and Forecast 2025 to 2035, By Sales Channel
    • Introduction / Key Findings
    • Historical Market Size Value (USD Billion) & Million Units Analysis By Sales Channel, 2020 to 2024
    • Current and Future Market Size Value (USD Billion) & Million Units Analysis and Forecast By Sales Channel, 2025 to 2035
      • Store-based
        • Hypermarkets
        • Supermarkets
        • Drugstores and Pharmacies
        • Convenience Stores
        • Baby Specialty Stores
      • Online Retailers
    • Y-o-Y Growth Trend Analysis By Sales Channel, 2020 to 2024
    • Absolute $ Opportunity Analysis By Sales Channel, 2025 to 2035
  10. Global Market Analysis 2020 to 2024 and Forecast 2025 to 2035, By Region
    • Introduction
    • Historical Market Size Value (USD Billion) & Million Units Analysis By Region, 2020 to 2024
    • Current Market Size Value (USD Billion) & Million Units Analysis and Forecast By Region, 2025 to 2035
      • North America
      • Latin America
      • Western Europe
      • Eastern Europe
      • East Asia
      • South Asia & Pacific
      • Middle East and Africa
    • Market Attractiveness Analysis By Region
  11. North America Market Analysis 2020 to 2024 and Forecast 2025 to 2035, By Country
    • Historical Market Size Value (USD Billion) & Million Units Trend Analysis By Market Taxonomy, 2020 to 2024
    • Market Size Value (USD Billion) & Million Units Forecast By Market Taxonomy, 2025 to 2035
      • By Country
        • USA
        • Canada
        • Mexico
      • By Product Type
      • By Flavor
      • By Packaging Type
      • By Sales Channel
    • Market Attractiveness Analysis
      • By Country
      • By Product Type
      • By Flavor
      • By Packaging Type
      • By Sales Channel
    • Key Takeaways
  12. Latin America Market Analysis 2020 to 2024 and Forecast 2025 to 2035, By Country
    • Historical Market Size Value (USD Billion) & Million Units Trend Analysis By Market Taxonomy, 2020 to 2024
    • Market Size Value (USD Billion) & Million Units Forecast By Market Taxonomy, 2025 to 2035
      • By Country
        • Brazil
        • Argentina
        • Rest of LATAM
      • By Product Type
      • By Flavor
      • By Packaging Type
      • By Sales Channel
    • Market Attractiveness Analysis
      • By Country
      • By Product Type
      • By Flavor
      • By Packaging Type
      • By Sales Channel
    • Key Takeaways
  13. Western Europe Market Analysis 2020 to 2024 and Forecast 2025 to 2035, By Country
    • Historical Market Size Value (USD Billion) & Million Units Trend Analysis By Market Taxonomy, 2020 to 2024
    • Market Size Value (USD Billion) & Million Units Forecast By Market Taxonomy, 2025 to 2035
      • By Country
        • Germany
        • Italy
        • France
        • UK
        • Spain
        • BENELUX
        • Nordic
        • Rest of W.Europe
      • By Product Type
      • By Flavor
      • By Packaging Type
      • By Sales Channel
    • Market Attractiveness Analysis
      • By Country
      • By Product Type
      • By Flavor
      • By Packaging Type
      • By Sales Channel
    • Key Takeaways
  14. Eastern Europe Market Analysis 2020 to 2024 and Forecast 2025 to 2035, By Country
    • Historical Market Size Value (USD Billion) & Million Units Trend Analysis By Market Taxonomy, 2020 to 2024
    • Market Size Value (USD Billion) & Million Units Forecast By Market Taxonomy, 2025 to 2035
      • By Country
        • Russia
        • Hungary
        • Poland
        • Balkan & Baltics
        • Rest of E. Europe
      • By Product Type
      • By Flavor
      • By Packaging Type
      • By Sales Channel
    • Market Attractiveness Analysis
      • By Country
      • By Product Type
      • By Flavor
      • By Packaging Type
      • By Sales Channel
    • Key Takeaways
  15. East Asia Market Analysis 2020 to 2024 and Forecast 2025 to 2035, By Country
    • Historical Market Size Value (USD Billion) & Million Units Trend Analysis By Market Taxonomy, 2020 to 2024
    • Market Size Value (USD Billion) & Million Units Forecast By Market Taxonomy, 2025 to 2035
      • By Country
        • China
        • Japan
        • South Korea
      • By Product Type
      • By Flavor
      • By Packaging Type
      • By Sales Channel
    • Market Attractiveness Analysis
      • By Country
      • By Product Type
      • By Flavor
      • By Packaging Type
      • By Sales Channel
    • Key Takeaways
  16. South Asia & Pacific Market Analysis 2020 to 2024 and Forecast 2025 to 2035, By Country
    • Historical Market Size Value (USD Billion) & Million Units Trend Analysis By Market Taxonomy, 2020 to 2024
    • Market Size Value (USD Billion) & Million Units Forecast By Market Taxonomy, 2025 to 2035
      • By Country
        • India
        • Australia & New Zealand
        • ASEAN
        • Rest of SAP
      • By Product Type
      • By Flavor
      • By Packaging Type
      • By Sales Channel
    • Market Attractiveness Analysis
      • By Country
      • By Product Type
      • By Flavor
      • By Packaging Type
      • By Sales Channel
    • Key Takeaways
  17. Middle East and Africa Market Analysis 2020 to 2024 and Forecast 2025 to 2035, By Country
    • Historical Market Size Value (USD Billion) & Million Units Trend Analysis By Market Taxonomy, 2020 to 2024
    • Market Size Value (USD Billion) & Million Units Forecast By Market Taxonomy, 2025 to 2035
      • By Country
        • GCC Countries
        • Northern Africa
        • South Africa
        • Turkiye
        • Rest of MEA
      • By Product Type
      • By Flavor
      • By Packaging Type
      • By Sales Channel
    • Market Attractiveness Analysis
      • By Country
      • By Product Type
      • By Flavor
      • By Packaging Type
      • By Sales Channel
    • Key Takeaways
  18. Key Countries Market Analysis
    • USA
      • Pricing Analysis
      • Market Share Analysis, 2024
        • By Product Type
        • By Flavor
        • By Packaging Type
        • By Sales Channel
    • Canada
      • Pricing Analysis
      • Market Share Analysis, 2024
        • By Product Type
        • By Flavor
        • By Packaging Type
        • By Sales Channel
    • Brazil
      • Pricing Analysis
      • Market Share Analysis, 2024
        • By Product Type
        • By Flavor
        • By Packaging Type
        • By Sales Channel
    • Mexico
      • Pricing Analysis
      • Market Share Analysis, 2024
        • By Product Type
        • By Flavor
        • By Packaging Type
        • By Sales Channel
    • Argentina
      • Pricing Analysis
      • Market Share Analysis, 2024
        • By Product Type
        • By Flavor
        • By Packaging Type
        • By Sales Channel
  19. Market Structure Analysis
    • Competition Dashboard
    • Competition Benchmarking
    • Market Share Analysis of Top Players
      • By Regional
      • By Product Type
      • By Flavor
      • By Packaging Type
      • By Sales Channel
  20. Competition Analysis
    • Competition Deep Dive
      • Nestle
        • Overview
        • Product Portfolio
        • Profitability by Market Segments (Product/Age /Sales Channel/Region)
        • Sales Footprint
        • Strategy Overview
          • Marketing Strategy
          • Product Strategy
          • Channel Strategy
      • Abbott
        • Overview
        • Product Portfolio
        • Profitability by Market Segments (Product/Age /Sales Channel/Region)
        • Sales Footprint
        • Strategy Overview
          • Marketing Strategy
          • Product Strategy
          • Channel Strategy
      • Danone
        • Overview
        • Product Portfolio
        • Profitability by Market Segments (Product/Age /Sales Channel/Region)
        • Sales Footprint
        • Strategy Overview
          • Marketing Strategy
          • Product Strategy
          • Channel Strategy
      • Anand Milk Union Limited
        • Overview
        • Product Portfolio
        • Profitability by Market Segments (Product/Age /Sales Channel/Region)
        • Sales Footprint
        • Strategy Overview
          • Marketing Strategy
          • Product Strategy
          • Channel Strategy
      • Mead Johnson Nutrition India /Reckitt Benckiser
        • Overview
        • Product Portfolio
        • Profitability by Market Segments (Product/Age /Sales Channel/Region)
        • Sales Footprint
        • Strategy Overview
          • Marketing Strategy
          • Product Strategy
          • Channel Strategy
      • Manna Foods.
        • Overview
        • Product Portfolio
        • Profitability by Market Segments (Product/Age /Sales Channel/Region)
        • Sales Footprint
        • Strategy Overview
          • Marketing Strategy
          • Product Strategy
          • Channel Strategy
      • Pristine
        • Overview
        • Product Portfolio
        • Profitability by Market Segments (Product/Age /Sales Channel/Region)
        • Sales Footprint
        • Strategy Overview
          • Marketing Strategy
          • Product Strategy
          • Channel Strategy
      • Mightly Steps Private Limited
        • Overview
        • Product Portfolio
        • Profitability by Market Segments (Product/Age /Sales Channel/Region)
        • Sales Footprint
        • Strategy Overview
          • Marketing Strategy
          • Product Strategy
          • Channel Strategy
      • The Great Banyan
        • Overview
        • Product Portfolio
        • Profitability by Market Segments (Product/Age /Sales Channel/Region)
        • Sales Footprint
        • Strategy Overview
          • Marketing Strategy
          • Product Strategy
          • Channel Strategy
      • Tiny Spoons
        • Overview
        • Product Portfolio
        • Profitability by Market Segments (Product/Age /Sales Channel/Region)
        • Sales Footprint
        • Strategy Overview
          • Marketing Strategy
          • Product Strategy
          • Channel Strategy
      • Gerber - Nestlé Sub
        • Overview
        • Product Portfolio
        • Profitability by Market Segments (Product/Age /Sales Channel/Region)
        • Sales Footprint
        • Strategy Overview
          • Marketing Strategy
          • Product Strategy
          • Channel Strategy
      • Nurture, Inc.
        • Overview
        • Product Portfolio
        • Profitability by Market Segments (Product/Age /Sales Channel/Region)
        • Sales Footprint
        • Strategy Overview
          • Marketing Strategy
          • Product Strategy
          • Channel Strategy
      • Heinz
        • Overview
        • Product Portfolio
        • Profitability by Market Segments (Product/Age /Sales Channel/Region)
        • Sales Footprint
        • Strategy Overview
          • Marketing Strategy
          • Product Strategy
          • Channel Strategy
      • Hain Celestial Group
        • Overview
        • Product Portfolio
        • Profitability by Market Segments (Product/Age /Sales Channel/Region)
        • Sales Footprint
        • Strategy Overview
          • Marketing Strategy
          • Product Strategy
          • Channel Strategy
      • Ella’s Kitchen
        • Overview
        • Product Portfolio
        • Profitability by Market Segments (Product/Age /Sales Channel/Region)
        • Sales Footprint
        • Strategy Overview
          • Marketing Strategy
          • Product Strategy
          • Channel Strategy
      • Sprout
        • Overview
        • Product Portfolio
        • Profitability by Market Segments (Product/Age /Sales Channel/Region)
        • Sales Footprint
        • Strategy Overview
          • Marketing Strategy
          • Product Strategy
          • Channel Strategy
      • Plum Organics
        • Overview
        • Product Portfolio
        • Profitability by Market Segments (Product/Age /Sales Channel/Region)
        • Sales Footprint
        • Strategy Overview
          • Marketing Strategy
          • Product Strategy
          • Channel Strategy
      • Hero Group
        • Overview
        • Product Portfolio
        • Profitability by Market Segments (Product/Age /Sales Channel/Region)
        • Sales Footprint
        • Strategy Overview
          • Marketing Strategy
          • Product Strategy
          • Channel Strategy
      • HiPP
        • Overview
        • Product Portfolio
        • Profitability by Market Segments (Product/Age /Sales Channel/Region)
        • Sales Footprint
        • Strategy Overview
          • Marketing Strategy
          • Product Strategy
          • Channel Strategy
      • Others
        • Overview
        • Product Portfolio
        • Profitability by Market Segments (Product/Age /Sales Channel/Region)
        • Sales Footprint
        • Strategy Overview
          • Marketing Strategy
          • Product Strategy
          • Channel Strategy
  21. Assumptions & Acronyms Used
  22. Research Methodology

List of Tables

  • Table 1: Global Market Value (USD Billion) Forecast by Region, 2020-2035
  • Table 2: Global Market Million Units Forecast by Region, 2020-2035
  • Table 3: Global Market Value (USD Billion) Forecast by Product Type, 2020-2035
  • Table 4: Global Market Million Units Forecast by Product Type, 2020-2035
  • Table 5: Global Market Value (USD Billion) Forecast by Flavor, 2020-2035
  • Table 6: Global Market Million Units Forecast by Flavor, 2020-2035
  • Table 7: Global Market Value (USD Billion) Forecast by Packaging Type, 2020-2035
  • Table 8: Global Market Million Units Forecast by Packaging Type, 2020-2035
  • Table 9: Global Market Value (USD Billion) Forecast by Sales Channel, 2020-2035
  • Table 10: Global Market Million Units Forecast by Sales Channel, 2020-2035
  • Table 11: North America Market Value (USD Billion) Forecast by Country, 2020-2035
  • Table 12: North America Market Million Units Forecast by Country, 2020-2035
  • Table 13: North America Market Value (USD Billion) Forecast by Product Type, 2020-2035
  • Table 14: North America Market Million Units Forecast by Product Type, 2020-2035
  • Table 15: North America Market Value (USD Billion) Forecast by Flavor, 2020-2035
  • Table 16: North America Market Million Units Forecast by Flavor, 2020-2035
  • Table 17: North America Market Value (USD Billion) Forecast by Packaging Type, 2020-2035
  • Table 18: North America Market Million Units Forecast by Packaging Type, 2020-2035
  • Table 19: North America Market Value (USD Billion) Forecast by Sales Channel, 2020-2035
  • Table 20: North America Market Million Units Forecast by Sales Channel, 2020-2035
  • Table 21: Latin America Market Value (USD Billion) Forecast by Country, 2020-2035
  • Table 22: Latin America Market Million Units Forecast by Country, 2020-2035
  • Table 23: Latin America Market Value (USD Billion) Forecast by Product Type, 2020-2035
  • Table 24: Latin America Market Million Units Forecast by Product Type, 2020-2035
  • Table 25: Latin America Market Value (USD Billion) Forecast by Flavor, 2020-2035
  • Table 26: Latin America Market Million Units Forecast by Flavor, 2020-2035
  • Table 27: Latin America Market Value (USD Billion) Forecast by Packaging Type, 2020-2035
  • Table 28: Latin America Market Million Units Forecast by Packaging Type, 2020-2035
  • Table 29: Latin America Market Value (USD Billion) Forecast by Sales Channel, 2020-2035
  • Table 30: Latin America Market Million Units Forecast by Sales Channel, 2020-2035
  • Table 31: Western Europe Market Value (USD Billion) Forecast by Country, 2020-2035
  • Table 32: Western Europe Market Million Units Forecast by Country, 2020-2035
  • Table 33: Western Europe Market Value (USD Billion) Forecast by Product Type, 2020-2035
  • Table 34: Western Europe Market Million Units Forecast by Product Type, 2020-2035
  • Table 35: Western Europe Market Value (USD Billion) Forecast by Flavor, 2020-2035
  • Table 36: Western Europe Market Million Units Forecast by Flavor, 2020-2035
  • Table 37: Western Europe Market Value (USD Billion) Forecast by Packaging Type, 2020-2035
  • Table 38: Western Europe Market Million Units Forecast by Packaging Type, 2020-2035
  • Table 39: Western Europe Market Value (USD Billion) Forecast by Sales Channel, 2020-2035
  • Table 40: Western Europe Market Million Units Forecast by Sales Channel, 2020-2035
  • Table 41: Eastern Europe Market Value (USD Billion) Forecast by Country, 2020-2035
  • Table 42: Eastern Europe Market Million Units Forecast by Country, 2020-2035
  • Table 43: Eastern Europe Market Value (USD Billion) Forecast by Product Type, 2020-2035
  • Table 44: Eastern Europe Market Million Units Forecast by Product Type, 2020-2035
  • Table 45: Eastern Europe Market Value (USD Billion) Forecast by Flavor, 2020-2035
  • Table 46: Eastern Europe Market Million Units Forecast by Flavor, 2020-2035
  • Table 47: Eastern Europe Market Value (USD Billion) Forecast by Packaging Type, 2020-2035
  • Table 48: Eastern Europe Market Million Units Forecast by Packaging Type, 2020-2035
  • Table 49: Eastern Europe Market Value (USD Billion) Forecast by Sales Channel, 2020-2035
  • Table 50: Eastern Europe Market Million Units Forecast by Sales Channel, 2020-2035
  • Table 51: East Asia Market Value (USD Billion) Forecast by Country, 2020-2035
  • Table 52: East Asia Market Million Units Forecast by Country, 2020-2035
  • Table 53: East Asia Market Value (USD Billion) Forecast by Product Type, 2020-2035
  • Table 54: East Asia Market Million Units Forecast by Product Type, 2020-2035
  • Table 55: East Asia Market Value (USD Billion) Forecast by Flavor, 2020-2035
  • Table 56: East Asia Market Million Units Forecast by Flavor, 2020-2035
  • Table 57: East Asia Market Value (USD Billion) Forecast by Packaging Type, 2020-2035
  • Table 58: East Asia Market Million Units Forecast by Packaging Type, 2020-2035
  • Table 59: East Asia Market Value (USD Billion) Forecast by Sales Channel, 2020-2035
  • Table 60: East Asia Market Million Units Forecast by Sales Channel, 2020-2035
  • Table 61: South Asia & Pacific Market Value (USD Billion) Forecast by Country, 2020-2035
  • Table 62: South Asia & Pacific Market Million Units Forecast by Country, 2020-2035
  • Table 63: South Asia & Pacific Market Value (USD Billion) Forecast by Product Type, 2020-2035
  • Table 64: South Asia & Pacific Market Million Units Forecast by Product Type, 2020-2035
  • Table 65: South Asia & Pacific Market Value (USD Billion) Forecast by Flavor, 2020-2035
  • Table 66: South Asia & Pacific Market Million Units Forecast by Flavor, 2020-2035
  • Table 67: South Asia & Pacific Market Value (USD Billion) Forecast by Packaging Type, 2020-2035
  • Table 68: South Asia & Pacific Market Million Units Forecast by Packaging Type, 2020-2035
  • Table 69: South Asia & Pacific Market Value (USD Billion) Forecast by Sales Channel, 2020-2035
  • Table 70: South Asia & Pacific Market Million Units Forecast by Sales Channel, 2020-2035
  • Table 71: Middle East and Africa Market Value (USD Billion) Forecast by Country, 2020-2035
  • Table 72: Middle East and Africa Market Million Units Forecast by Country, 2020-2035
  • Table 73: Middle East and Africa Market Value (USD Billion) Forecast by Product Type, 2020-2035
  • Table 74: Middle East and Africa Market Million Units Forecast by Product Type, 2020-2035
  • Table 75: Middle East and Africa Market Value (USD Billion) Forecast by Flavor, 2020-2035
  • Table 76: Middle East and Africa Market Million Units Forecast by Flavor, 2020-2035
  • Table 77: Middle East and Africa Market Value (USD Billion) Forecast by Packaging Type, 2020-2035
  • Table 78: Middle East and Africa Market Million Units Forecast by Packaging Type, 2020-2035
  • Table 79: Middle East and Africa Market Value (USD Billion) Forecast by Sales Channel, 2020-2035
  • Table 80: Middle East and Africa Market Million Units Forecast by Sales Channel, 2020-2035

List of Figures

  • Figure 1: Global Market Million Units Forecast 2020-2035
  • Figure 2: Global Market Pricing Analysis
  • Figure 3: Global Market Value (USD Billion) Forecast 2020-2035
  • Figure 4: Global Market Value Share and BPS Analysis by Product Type, 2025 and 2035
  • Figure 5: Global Market Y-o-Y Growth Comparison by Product Type, 2025-2035
  • Figure 6: Global Market Attractiveness Analysis by Product Type
  • Figure 7: Global Market Value Share and BPS Analysis by Flavor, 2025 and 2035
  • Figure 8: Global Market Y-o-Y Growth Comparison by Flavor, 2025-2035
  • Figure 9: Global Market Attractiveness Analysis by Flavor
  • Figure 10: Global Market Value Share and BPS Analysis by Packaging Type, 2025 and 2035
  • Figure 11: Global Market Y-o-Y Growth Comparison by Packaging Type, 2025-2035
  • Figure 12: Global Market Attractiveness Analysis by Packaging Type
  • Figure 13: Global Market Value Share and BPS Analysis by Sales Channel, 2025 and 2035
  • Figure 14: Global Market Y-o-Y Growth Comparison by Sales Channel, 2025-2035
  • Figure 15: Global Market Attractiveness Analysis by Sales Channel
  • Figure 16: Global Market Value (USD Billion) Share and BPS Analysis by Region, 2025 and 2035
  • Figure 17: Global Market Y-o-Y Growth Comparison by Region, 2025-2035
  • Figure 18: Global Market Attractiveness Analysis by Region
  • Figure 19: North America Market Incremental $ Opportunity, 2025-2035
  • Figure 20: Latin America Market Incremental $ Opportunity, 2025-2035
  • Figure 21: Western Europe Market Incremental $ Opportunity, 2025-2035
  • Figure 22: Eastern Europe Market Incremental $ Opportunity, 2025-2035
  • Figure 23: East Asia Market Incremental $ Opportunity, 2025-2035
  • Figure 24: South Asia & Pacific Market Incremental $ Opportunity, 2025-2035
  • Figure 25: Middle East and Africa Market Incremental $ Opportunity, 2025-2035
  • Figure 26: North America Market Value Share and BPS Analysis by Country, 2025 and 2035
  • Figure 27: North America Market Value Share and BPS Analysis by Product Type, 2025 and 2035
  • Figure 28: North America Market Y-o-Y Growth Comparison by Product Type, 2025-2035
  • Figure 29: North America Market Attractiveness Analysis by Product Type
  • Figure 30: North America Market Value Share and BPS Analysis by Flavor, 2025 and 2035
  • Figure 31: North America Market Y-o-Y Growth Comparison by Flavor, 2025-2035
  • Figure 32: North America Market Attractiveness Analysis by Flavor
  • Figure 33: North America Market Value Share and BPS Analysis by Packaging Type, 2025 and 2035
  • Figure 34: North America Market Y-o-Y Growth Comparison by Packaging Type, 2025-2035
  • Figure 35: North America Market Attractiveness Analysis by Packaging Type
  • Figure 36: North America Market Value Share and BPS Analysis by Sales Channel, 2025 and 2035
  • Figure 37: North America Market Y-o-Y Growth Comparison by Sales Channel, 2025-2035
  • Figure 38: North America Market Attractiveness Analysis by Sales Channel
  • Figure 39: Latin America Market Value Share and BPS Analysis by Country, 2025 and 2035
  • Figure 40: Latin America Market Value Share and BPS Analysis by Product Type, 2025 and 2035
  • Figure 41: Latin America Market Y-o-Y Growth Comparison by Product Type, 2025-2035
  • Figure 42: Latin America Market Attractiveness Analysis by Product Type
  • Figure 43: Latin America Market Value Share and BPS Analysis by Flavor, 2025 and 2035
  • Figure 44: Latin America Market Y-o-Y Growth Comparison by Flavor, 2025-2035
  • Figure 45: Latin America Market Attractiveness Analysis by Flavor
  • Figure 46: Latin America Market Value Share and BPS Analysis by Packaging Type, 2025 and 2035
  • Figure 47: Latin America Market Y-o-Y Growth Comparison by Packaging Type, 2025-2035
  • Figure 48: Latin America Market Attractiveness Analysis by Packaging Type
  • Figure 49: Latin America Market Value Share and BPS Analysis by Sales Channel, 2025 and 2035
  • Figure 50: Latin America Market Y-o-Y Growth Comparison by Sales Channel, 2025-2035
  • Figure 51: Latin America Market Attractiveness Analysis by Sales Channel
  • Figure 52: Western Europe Market Value Share and BPS Analysis by Country, 2025 and 2035
  • Figure 53: Western Europe Market Value Share and BPS Analysis by Product Type, 2025 and 2035
  • Figure 54: Western Europe Market Y-o-Y Growth Comparison by Product Type, 2025-2035
  • Figure 55: Western Europe Market Attractiveness Analysis by Product Type
  • Figure 56: Western Europe Market Value Share and BPS Analysis by Flavor, 2025 and 2035
  • Figure 57: Western Europe Market Y-o-Y Growth Comparison by Flavor, 2025-2035
  • Figure 58: Western Europe Market Attractiveness Analysis by Flavor
  • Figure 59: Western Europe Market Value Share and BPS Analysis by Packaging Type, 2025 and 2035
  • Figure 60: Western Europe Market Y-o-Y Growth Comparison by Packaging Type, 2025-2035
  • Figure 61: Western Europe Market Attractiveness Analysis by Packaging Type
  • Figure 62: Western Europe Market Value Share and BPS Analysis by Sales Channel, 2025 and 2035
  • Figure 63: Western Europe Market Y-o-Y Growth Comparison by Sales Channel, 2025-2035
  • Figure 64: Western Europe Market Attractiveness Analysis by Sales Channel
  • Figure 65: Eastern Europe Market Value Share and BPS Analysis by Country, 2025 and 2035
  • Figure 66: Eastern Europe Market Value Share and BPS Analysis by Product Type, 2025 and 2035
  • Figure 67: Eastern Europe Market Y-o-Y Growth Comparison by Product Type, 2025-2035
  • Figure 68: Eastern Europe Market Attractiveness Analysis by Product Type
  • Figure 69: Eastern Europe Market Value Share and BPS Analysis by Flavor, 2025 and 2035
  • Figure 70: Eastern Europe Market Y-o-Y Growth Comparison by Flavor, 2025-2035
  • Figure 71: Eastern Europe Market Attractiveness Analysis by Flavor
  • Figure 72: Eastern Europe Market Value Share and BPS Analysis by Packaging Type, 2025 and 2035
  • Figure 73: Eastern Europe Market Y-o-Y Growth Comparison by Packaging Type, 2025-2035
  • Figure 74: Eastern Europe Market Attractiveness Analysis by Packaging Type
  • Figure 75: Eastern Europe Market Value Share and BPS Analysis by Sales Channel, 2025 and 2035
  • Figure 76: Eastern Europe Market Y-o-Y Growth Comparison by Sales Channel, 2025-2035
  • Figure 77: Eastern Europe Market Attractiveness Analysis by Sales Channel
  • Figure 78: East Asia Market Value Share and BPS Analysis by Country, 2025 and 2035
  • Figure 79: East Asia Market Value Share and BPS Analysis by Product Type, 2025 and 2035
  • Figure 80: East Asia Market Y-o-Y Growth Comparison by Product Type, 2025-2035
  • Figure 81: East Asia Market Attractiveness Analysis by Product Type
  • Figure 82: East Asia Market Value Share and BPS Analysis by Flavor, 2025 and 2035
  • Figure 83: East Asia Market Y-o-Y Growth Comparison by Flavor, 2025-2035
  • Figure 84: East Asia Market Attractiveness Analysis by Flavor
  • Figure 85: East Asia Market Value Share and BPS Analysis by Packaging Type, 2025 and 2035
  • Figure 86: East Asia Market Y-o-Y Growth Comparison by Packaging Type, 2025-2035
  • Figure 87: East Asia Market Attractiveness Analysis by Packaging Type
  • Figure 88: East Asia Market Value Share and BPS Analysis by Sales Channel, 2025 and 2035
  • Figure 89: East Asia Market Y-o-Y Growth Comparison by Sales Channel, 2025-2035
  • Figure 90: East Asia Market Attractiveness Analysis by Sales Channel
  • Figure 91: South Asia & Pacific Market Value Share and BPS Analysis by Country, 2025 and 2035
  • Figure 92: South Asia & Pacific Market Value Share and BPS Analysis by Product Type, 2025 and 2035
  • Figure 93: South Asia & Pacific Market Y-o-Y Growth Comparison by Product Type, 2025-2035
  • Figure 94: South Asia & Pacific Market Attractiveness Analysis by Product Type
  • Figure 95: South Asia & Pacific Market Value Share and BPS Analysis by Flavor, 2025 and 2035
  • Figure 96: South Asia & Pacific Market Y-o-Y Growth Comparison by Flavor, 2025-2035
  • Figure 97: South Asia & Pacific Market Attractiveness Analysis by Flavor
  • Figure 98: South Asia & Pacific Market Value Share and BPS Analysis by Packaging Type, 2025 and 2035
  • Figure 99: South Asia & Pacific Market Y-o-Y Growth Comparison by Packaging Type, 2025-2035
  • Figure 100: South Asia & Pacific Market Attractiveness Analysis by Packaging Type
  • Figure 101: South Asia & Pacific Market Value Share and BPS Analysis by Sales Channel, 2025 and 2035
  • Figure 102: South Asia & Pacific Market Y-o-Y Growth Comparison by Sales Channel, 2025-2035
  • Figure 103: South Asia & Pacific Market Attractiveness Analysis by Sales Channel
  • Figure 104: Middle East and Africa Market Value Share and BPS Analysis by Country, 2025 and 2035
  • Figure 105: Middle East and Africa Market Value Share and BPS Analysis by Product Type, 2025 and 2035
  • Figure 106: Middle East and Africa Market Y-o-Y Growth Comparison by Product Type, 2025-2035
  • Figure 107: Middle East and Africa Market Attractiveness Analysis by Product Type
  • Figure 108: Middle East and Africa Market Value Share and BPS Analysis by Flavor, 2025 and 2035
  • Figure 109: Middle East and Africa Market Y-o-Y Growth Comparison by Flavor, 2025-2035
  • Figure 110: Middle East and Africa Market Attractiveness Analysis by Flavor
  • Figure 111: Middle East and Africa Market Value Share and BPS Analysis by Packaging Type, 2025 and 2035
  • Figure 112: Middle East and Africa Market Y-o-Y Growth Comparison by Packaging Type, 2025-2035
  • Figure 113: Middle East and Africa Market Attractiveness Analysis by Packaging Type
  • Figure 114: Middle East and Africa Market Value Share and BPS Analysis by Sales Channel, 2025 and 2035
  • Figure 115: Middle East and Africa Market Y-o-Y Growth Comparison by Sales Channel, 2025-2035
  • Figure 116: Middle East and Africa Market Attractiveness Analysis by Sales Channel
  • Figure 117: Global Market - Tier Structure Analysis
  • Figure 118: Global Market - Company Share Analysis

Frequently Asked Questions

What is the projected valuation of the baby food market in 2025?

The projected valuation of the baby food market in 2025 is 85.25 billion USD.

What is the forecast valuation of the baby food market by 2035?

The forecast valuation of the baby food market by 2035 is 213.21 billion USD.

What is the expected CAGR for the baby food market from 2025 to 2035?

The expected CAGR for the baby food market from 2025 to 2035 is 9.6%.

Which segment will lead the baby food market in 2035?

The 0-24 months, special milk formula segment will lead in 2035, with a 18.2% share in 2025.

Which country is expected to experience the highest growth?

Australia is expected to be the leading country in the baby food market, with a 11.3% CAGR.

Explore Similar Insights

Future Market Insights

Baby Food Market