Baby Diaper Market Forecast and Outlook 2025 to 2035

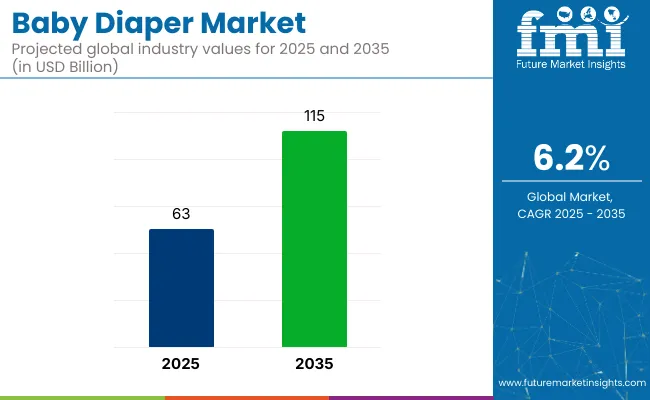
The global baby diaper market is set to grow at a CAGR of 6.2% and reach USD 115 billion by 2035, up from USD 63 billion in 2025. The growing working female population and increasing focus on skin-friendly baby diapers is driving growth. Premiumization, skin-friendliness and personalization are being focused on by baby diaper brands in developed markets.

Subscription-based and D2C diaper companies are increasing their market share. As per Future Market Insights' latest Q2, 2025 update on the global baby diapers market report, the market is likely to witness steady momentum throughout the forecast period.
Quick Stats on Baby Diaper Market

  • Global Market Size: USD 63 billion in 2025
  • Forecast Value: USD 115 billion by 2035
  • Forecast CAGR: 6.2%
  • Highest Selling Baby Diaper Type: Underwear Pants (50% market share in 2025)
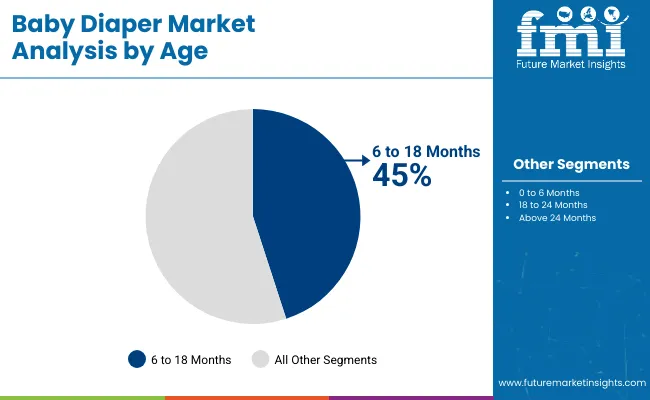
  • Top Segment by Age: 6 months to 18 months (45% market share in 2025)
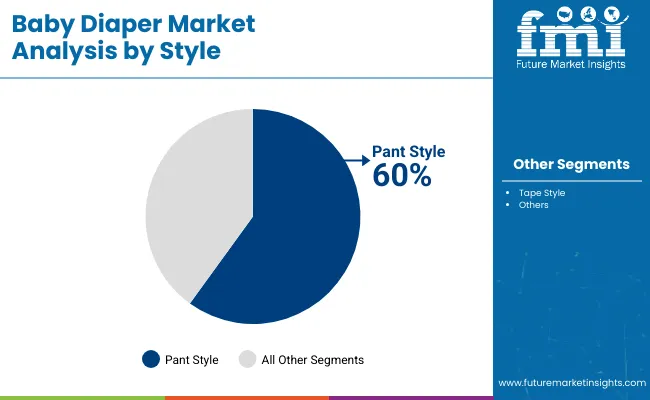
  • Top-selling Baby Diapers by Style: Pant style (60% market share in 2025)

Baby Diaper Market

As per Future Market Insights analysis, USA will continue to hold the largest market share, accounting for nearly 37% of the global diaper market. On the other hand, in terms of growth rate, China baby diaper market is likely to grow at a CAGR of 10% during the forecast period 2025 to 2035.

Underwear pants will continue to account for nearly 50% share of the market in 2025, owing to the convenience they provide. By age, 6 months to 18 month accounts for higher revenues than any other segment on account of the sweet spot of volume and price.

FMI Pro Tip: Although newborns use 10-12 diapers per day, which is higher than the age group 6 month to 18 month, the latter still account for higher revenue share. This is on account of higher unit price per diaper and higher leakage risk in outside settings.

Analyzing Baby Diaper Market by Top Investment Segments

The global baby diaper market has been analyzed across key segmentation parameters for the historical period 2020 to 2024 and forecast period 2025 to 2035. By product type, the market includes Underwear Pants, Cloth Diapers, Flat Cloth Diaper, Pre-Fold Cloth Diaper, Pocket Diaper, Fitted Cloth Diaper, Hybrid Cloth Diaper, All-in-One Diaper, Preemie Diapers, and Swim Diaper.

By age group, the market is segmented into 0 to 6 Months, 6 to 18 Months, 18 to 24 Months, and Above 24 Months. By style, the market is classified into Tape Style and Pant Style. Based on functionality, the market is divided into Disposable Diapers and Reusable Diapers. Regionally, the report covers North America, Latin America, Western Europe, Eastern Europe, East Asia, South Asia Pacific, and the Middle East and Africa.
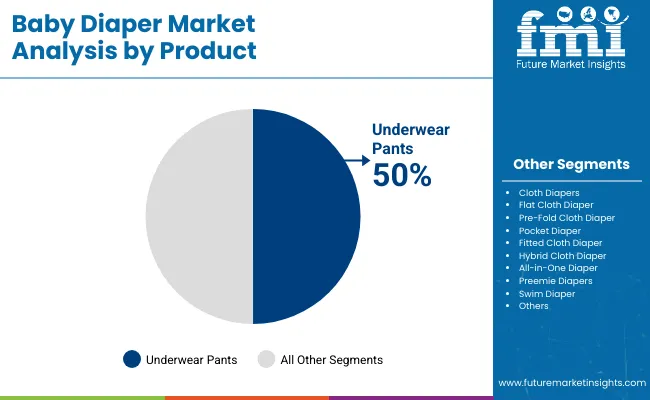
By Product, Underwear Pants to Lead with 50% Market Share in 2025

FMI analysts expect underwear pants to remain the top-selling product type, capturing nearly 50% of global market share in 2025, driven by high adoption among parents in the 6 to 18-month group.
  • Cloth diapers, which include flat, pre-fold, pocket, fitted, and hybrid variants, collectively account for 14% market share, on account of their usability quotient.
  • Premium baby diapers are witnessing steady adoption, especially in developed countries and urban centers in developing countries.
  • A brisk pace of growth is likely to be observed in the swim diapers segment, which is currently a niche category in most markets.

Baby Diaper Market Analysis By Product Type

By Age, 6 month to 18 month Segment will Lead with 45% Market Share in 2025

6 month to 18 month segment holds nearly 45% market share in 2025, owing to higher average price per unit. The 0 to 6 month segment follows, accounting for a substantial share of the market. The 18 to 24 months segment and above 24 months are least lucrative as potty training begins to reduce usage volume. Diaper usage is varied across geographies, with lower sales in Europe and North America observed compared to Asia Pacific.
Baby Diaper Market Analysis By Age Group

By Type, Pant Style Segment to Lead with 60% Market Share in 2025 

By type, pant-style diapers are projected to lead the global baby diaper market with an estimated 60% market share in 2025, reflecting a decisive shift in consumer preference away from traditional tape-style diapers. Conversely, tape-style diapers continue to serve newborns where frequent changes and delicate skin handling are critical, but their role in the toddler segment is shrinking fast.
  • Retailers and brands are prioritizing pant-style variants due to higher margins and visibility.
  • Pant-style formats have been the focus of most recent product innovations.
  • Parents in developing markets have made pant-style diapers the default option.

Baby Diaper Market Analysis By Type

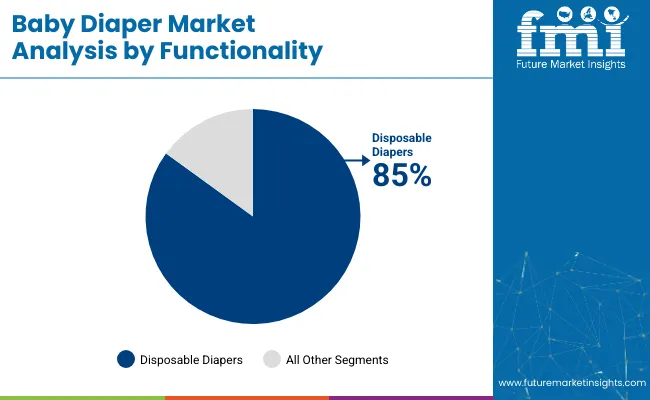
By Functionality, Disposable Diapers to Remain Dominant with Over 85% Market Share in 2025

Disposable diapers will continue to command the lion’s share of the baby diaper market; over 85% of global sales in 2025 are expected to be accounted for by disposable diapers. Their widespread adoption can be attributed to convenience, ease of disposal, and advancements in absorbency technology.

In urban households, disposable diapers have become the default choice due to their time-saving nature and hygienic appeal. Meanwhile, reusable diapers, though eco-friendly and cost-effective in the long run, account for less than 15% of the market. Their limited uptake is primarily due to the added laundry burden and inconsistent performance in public or daycare settings. In urban households, disposable diapers are the default choice, especially among working parents and nuclear families.

  • Reusable diapers hold less than 15% of market share, mainly due to their high maintenance requirements and limited practicality in outdoor or daycare environments.
  • Despite low adoption, reusable diapers are gaining niche traction among eco-conscious parents, particularly in USA, UK, Germany, France, and Italy.
  • Minimalism oriented brands are exploring hybrid models that blend reusable fabric with disposable inserts to bridge the gap between convenience and eco-responsibility.

Baby Diaper Market Analysis By Functionality

Top Baby Diaper Market Dynamics

The global baby diaper market is witnessing steady growth, fueled by rising birth rates in developing regions, increased participation of women in the workforce, and growing preference for premium, skin-friendly diapering solutions. The expansion of D2C and subscription-based diaper brands is further reshaping purchase behavior. However, the market is not without challenges, particularly around sustainability concerns and price sensitivity in emerging economies.

Recent Trends in the Baby Diaper Industry

  • Pant-style diapers are dominating, especially among toddlers, due to ease of use and comfort.
  • Premiumization is on the rise with demand for diapers offering anti-rash layers, organic cotton linings, and night-long absorption.
  • Direct-to-consumer (D2C) models are scaling, with subscription services gaining popularity among urban parents.
  • Smart diapers and connected baby care tech are emerging, with prototypes that monitor wetness and skin temperature.
  • Regional preferences are shifting, with tape-style still common for newborns in hospitals, while pant-style dominates in retail.

Challenges in the Baby Diaper Market

  • Environmental concerns around diaper waste disposal continue to pressure manufacturers to innovate eco-friendly solutions.
  • Price sensitivity in developing markets limits adoption of premium products despite rising aspirations.
  • Fluctuations in raw material costs are squeezing margins for manufacturers.
  • Cultural habits and toilet training practices vary widely, affecting diaper usage beyond 24 months.
  • Brand loyalty is hard to maintain, especially in price-sensitive markets where switching based on deals is common.

Analyzing Top Countries in Baby Diapers Market

An Overview of USA Baby Diaper Market Growth

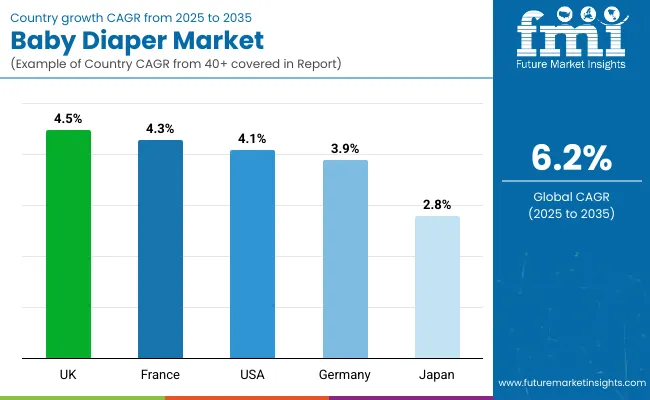
The USA baby diaper market is expected to grow at a CAGR of 4.1% from 2025 to 2035. Despite being a mature market, growth is supported by the shift toward premium, organic, and skin-sensitive diapers. Leading players like Procter & Gamble, Kimberly-Clark, and Honest Co. dominate the landscape. Subscription-based D2C models and increasing demand for eco-friendly disposable diapers are shaping consumer behavior. Key trends in US baby diaper market include,

  • Strong demand for premium and ultra-soft diapers with anti-rash layers.
  • Growth in D2C and subscription diaper models in urban households.
  • High brand loyalty but rising interest in sustainable alternatives.
  • Mature market with innovation-led growth opportunities.

UK Baby Diaper Market Analysis and Growth

The UK baby diaper market is projected to expand at a CAGR of 4.5% during 2025 to 2035. Growth is driven by the rising preference for biodegradable diapers and a sharp increase in online diaper subscriptions. Brands like Tesco, Kit & Kin, and Pampers are prominent in the market. Retailers are also promoting reusable diaper lines in line with the government’s drive.

  • Rising awareness around plastic-free and compostable diaper materials.
  • High uptake of hybrid and reusable diaper solutions.
  • E-commerce driving recurring diaper sales among new parents.
  • Strong presence of eco-conscious brands like Kit & Kin.
  • Government support for sustainable parenting products.

Germany Baby Diaper Market Overview

Germany’s baby diaper market is forecasted to register a CAGR of 3.9% between 2025 and 2035. As one of Europe’s most eco-conscious markets, demand is steadily shifting toward reusable and biodegradable options. Conventional brands face stiff competition from local startups offering sustainable diapering solutions.

  • Environmentally friendly diapers gaining significant traction.
  • Reusable cloth diapers more widely accepted than in other Western markets.
  • German consumers prioritize safety and comfort.
  • Private label brands expanding aggressively in retail.

France Baby Diaper Market Outlook

France’s baby diaper market is projected to grow at a CAGR of 4.3% from 2025 to 2035, driven by rising demand for organic, skin-sensitive, and biodegradable diapers. Parents are increasingly prioritizing eco-friendly and dermatologically tested products, while domestic and EU-based brands continue to dominate both online and offline retail channels.

  • Growing demand for compostable and plastic-free diaper materials.
  • High adoption of premium and dermatologically certified diapers.
  • Reusable and hybrid diaper models gaining traction among eco-conscious parents.
  • Retailers offering private-label organic diaper lines at competitive pricing.
  • Regulatory push for reduced chemical content and sustainable packaging boosting product innovation

Japan Baby Diaper Market Analysis

Japan’s baby diaper market is projected to grow at a CAGR of 2.8% over the forecast period. A declining birth rate and aging population cap overall demand, but premium and night-use diapers are seeing increased penetration. Companies like Unicharm lead the domestic market with advanced features like ultra-thin absorbents and breathable fabrics.

  • Technological innovation in ultra-thin and night-use diapers.
  • Growth in adult-to-baby crossover innovations in absorbency tech.
  • Declining birth rates offset by high per-baby spending.
  • Strong export of Japanese diapers to Southeast Asia.

Baby Diaper Market Country Wise Analysis

Baby Diapers Industry News

  • In May 2024, Pampers became the official sponsor of the Olympic Village Nursery at the Paris 2024 Olympic and Paralympic Games, providing diapers and wipes to athlete families and enhancing brand visibility on a global stage.
  • In August 2024, P&G showcased the behind-the-scenes development of Pampers Premium Protection diapers, emphasizing collaboration with up to 800 families weekly and advanced features like the DermaComfort layer and Stop & Protect pocket for superior skin health and leak protection
  • In August 2024, Ontex launched its Dreamshield® 360° baby pants across Europe, featuring triple leakage barriers and SeconDRY® technology, following strong consumer panel results and rising demand for baby pants over traditional diapers

Report Scope Table - Baby Diapers Market

Attribute Details
Market Size (2025) USD 63 billion
Forecast Size (2035) USD 115 billion
CAGR (2025 to 2035) 6.2%
Base Year 2024
Historical Data 2020 to 2024
Forecast Period 2025 to 2035
Metric Revenue in USD Billion and Volume in Units
By Product Underwear Pants, Cloth Diapers (Flat, Pre-Fold, Pocket, Fitted, Hybrid), All-in-One Diapers, Preemie Diapers, Swim Diapers
By Age Group 0 to 6 Months, 6 to 18 Months, 18 to 24 Months, Above 24 Months
By Style Tape Style, Pant Style
By Functionality Disposable Diapers, Reusable Diapers
By Region North America, Latin America, Western Europe, Eastern Europe, East Asia, South Asia Pacific, Middle East & Africa
Key Countries United States, Canada, Brazil, Germany, UK, France, Italy, Spain, China, India, Japan, GCC countries and more
Key Players Procter & Gamble, Kimberly-Clark Corporation, Unicharm Corporation, The Honest Company, Ontex Group, Essity, First Quality Enterprises, Daio Paper Corporation, Domtar Corporation

Key Segmentation

By Product:

  • Underwear Pants
  • Cloth Diapers
  • Flat Cloth Diaper
  • Pre-Fold Cloth Diaper
  • Pocket Diaper
  • Fitted Cloth Diaper
  • Hybrid Cloth Diaper
  • All-in-One Diaper
  • Preemie Diapers
  • Swim Diaper

By Age:

  • 0 to 6 Months
  • 6 to 18 Months
  • 18 to 24 Months
  • Above 24 Months

By Style:

  • Tape Style
  • Pant Style

By Functionality:

  • Disposable Diaper
  • Reusable Diaper

By Region:

  • North America
  • Latin America
  • Europe
  • Asia Pacific
  • Middle East and Africa

Table of Content

  1. Executive Summary
  2. Industry Introduction, including Taxonomy and Market Definition
  3. Market Trends and Success Factors, including Macro-economic Factors, Market Dynamics, and Recent Industry Developments
  4. Market Demand Analysis 2020 to 2024 and Forecast 2025 to 2035, including Historical Analysis and Future Projections
  5. Market Analysis 2020 to 2024 and Forecast 2025 to 2035
    • Product
    • Age
    • Style
    • Functionality
  6. Market Analysis 2020 to 2024 and Forecast 2025 to 2035, By Product
    • Underwear Pants
    • Cloth Diapers
      • Flat Cloth Diaper
      • Pre-Fold Cloth Diaper
      • Pocket Diaper
      • Fitted Cloth Diaper
      • Hybrid Cloth Diaper
    • All-in-One Diaper
    • Preemie Diapers
    • Swim Diaper
  7. Market Analysis 2020 to 2024 and Forecast 2025 to 2035, By Age
    • 0 to 6 Months
    • 6 to 18 Months
    • 18 to 24 Months
    • Above 24 Months
  8. Market Analysis 2020 to 2024 and Forecast 2025 to 2035, By Style
    • Tape Style
    • Pant Style
  9. Market Analysis 2020 to 2024 and Forecast 2025 to 2035, By Functionality
    • Disposable Diaper
    • Reusable Diaper
  10. Market Analysis 2020 to 2024 and Forecast 2025 to 2035, By Region
    • North America
    • Latin America
    • Western Europe
    • Eastern Europe
    • East Asia
    • South Asia Pacific
    • Middle East and Africa
  11. North America Sales Analysis 2020 to 2024 and Forecast 2025 to 2035, by Key Segments and Countries
  12. Latin America Sales Analysis 2020 to 2024 and Forecast 2025 to 2035, by Key Segments and Countries
  13. Western Europe Sales Analysis 2020 to 2024 and Forecast 2025 to 2035, by Key Segments and Countries
  14. Eastern Europe Sales Analysis 2020 to 2024 and Forecast 2025 to 2035, by Key Segments and Countries
  15. East Asia Sales Analysis 2020 to 2024 and Forecast 2025 to 2035, by Key Segments and Countries
  16. South Asia Pacific Sales Analysis 2020 to 2024 and Forecast 2025 to 2035, by Key Segments and Countries
  17. Middle East and Africa Sales Analysis 2020 to 2024 and Forecast 2025 to 2035, by Key Segments and Countries
  18. Sales Forecast 2025 to 2035 by Product, Age, Style, and Functionality for 30 Countries
  19. Competition Outlook, including Market Structure Analysis, Company Share Analysis by Key Players, and Competition Dashboard
  20. Company Profile
    • Procter & Gamble Co. (P&G)
    • Kimberly-Clark Corporation
    • Unicharm Corporation
    • Essity Aktiebolag (AB)
    • Kao Corporation
    • Ontex Group
    • Hengan International Group
    • Nobel Hygiene
    • Domtar Corporation
    • First Quality Enterprises

List of Tables

  • Table 1: Global Market Value (USD Million) Forecast by Region, 2020 to 2035
  • Table 2: Global Market Volume (Units) Forecast by Region, 2020 to 2035
  • Table 3: Global Market Value (USD Million) Forecast by Product, 2020 to 2035
  • Table 4: Global Market Volume (Units) Forecast by Product, 2020 to 2035
  • Table 5: Global Market Value (USD Million) Forecast by Age, 2020 to 2035
  • Table 6: Global Market Volume (Units) Forecast by Age, 2020 to 2035
  • Table 7: Global Market Value (USD Million) Forecast by Style, 2020 to 2035
  • Table 8: Global Market Volume (Units) Forecast by Style, 2020 to 2035
  • Table 9: Global Market Value (USD Million) Forecast by Functionality, 2020 to 2035
  • Table 10: Global Market Volume (Units) Forecast by Functionality, 2020 to 2035
  • Table 11: North America Market Value (USD Million) Forecast by Country, 2020 to 2035
  • Table 12: North America Market Volume (Units) Forecast by Country, 2020 to 2035
  • Table 13: North America Market Value (USD Million) Forecast by Product, 2020 to 2035
  • Table 14: North America Market Volume (Units) Forecast by Product, 2020 to 2035
  • Table 15: North America Market Value (USD Million) Forecast by Age, 2020 to 2035
  • Table 16: North America Market Volume (Units) Forecast by Age, 2020 to 2035
  • Table 17: North America Market Value (USD Million) Forecast by Style, 2020 to 2035
  • Table 18: North America Market Volume (Units) Forecast by Style, 2020 to 2035
  • Table 19: North America Market Value (USD Million) Forecast by Functionality, 2020 to 2035
  • Table 20: North America Market Volume (Units) Forecast by Functionality, 2020 to 2035
  • Table 21: Latin America Market Value (USD Million) Forecast by Country, 2020 to 2035
  • Table 22: Latin America Market Volume (Units) Forecast by Country, 2020 to 2035
  • Table 23: Latin America Market Value (USD Million) Forecast by Product, 2020 to 2035
  • Table 24: Latin America Market Volume (Units) Forecast by Product, 2020 to 2035
  • Table 25: Latin America Market Value (USD Million) Forecast by Age, 2020 to 2035
  • Table 26: Latin America Market Volume (Units) Forecast by Age, 2020 to 2035
  • Table 27: Latin America Market Value (USD Million) Forecast by Style, 2020 to 2035
  • Table 28: Latin America Market Volume (Units) Forecast by Style, 2020 to 2035
  • Table 29: Latin America Market Value (USD Million) Forecast by Functionality, 2020 to 2035
  • Table 30: Latin America Market Volume (Units) Forecast by Functionality, 2020 to 2035
  • Table 31: Europe Market Value (USD Million) Forecast by Country, 2020 to 2035
  • Table 32: Europe Market Volume (Units) Forecast by Country, 2020 to 2035
  • Table 33: Europe Market Value (USD Million) Forecast by Product, 2020 to 2035
  • Table 34: Europe Market Volume (Units) Forecast by Product, 2020 to 2035
  • Table 35: Europe Market Value (USD Million) Forecast by Age, 2020 to 2035
  • Table 36: Europe Market Volume (Units) Forecast by Age, 2020 to 2035
  • Table 37: Europe Market Value (USD Million) Forecast by Style, 2020 to 2035
  • Table 38: Europe Market Volume (Units) Forecast by Style, 2020 to 2035
  • Table 39: Europe Market Value (USD Million) Forecast by Functionality, 2020 to 2035
  • Table 40: Europe Market Volume (Units) Forecast by Functionality, 2020 to 2035
  • Table 41: Asia Pacific Market Value (USD Million) Forecast by Country, 2020 to 2035
  • Table 42: Asia Pacific Market Volume (Units) Forecast by Country, 2020 to 2035
  • Table 43: Asia Pacific Market Value (USD Million) Forecast by Product, 2020 to 2035
  • Table 44: Asia Pacific Market Volume (Units) Forecast by Product, 2020 to 2035
  • Table 45: Asia Pacific Market Value (USD Million) Forecast by Age, 2020 to 2035
  • Table 46: Asia Pacific Market Volume (Units) Forecast by Age, 2020 to 2035
  • Table 47: Asia Pacific Market Value (USD Million) Forecast by Style, 2020 to 2035
  • Table 48: Asia Pacific Market Volume (Units) Forecast by Style, 2020 to 2035
  • Table 49: Asia Pacific Market Value (USD Million) Forecast by Functionality, 2020 to 2035
  • Table 50: Asia Pacific Market Volume (Units) Forecast by Functionality, 2020 to 2035
  • Table 51: MEA Market Value (USD Million) Forecast by Country, 2020 to 2035
  • Table 52: MEA Market Volume (Units) Forecast by Country, 2020 to 2035
  • Table 53: MEA Market Value (USD Million) Forecast by Product, 2020 to 2035
  • Table 54: MEA Market Volume (Units) Forecast by Product, 2020 to 2035
  • Table 55: MEA Market Value (USD Million) Forecast by Age, 2020 to 2035
  • Table 56: MEA Market Volume (Units) Forecast by Age, 2020 to 2035
  • Table 57: MEA Market Value (USD Million) Forecast by Style, 2020 to 2035
  • Table 58: MEA Market Volume (Units) Forecast by Style, 2020 to 2035
  • Table 59: MEA Market Value (USD Million) Forecast by Functionality, 2020 to 2035
  • Table 60: MEA Market Volume (Units) Forecast by Functionality, 2020 to 2035

List of Figures

  • Figure 1: Global Market Value (USD Million) by Product, 2025 to 2035
  • Figure 2: Global Market Value (USD Million) by Age, 2025 to 2035
  • Figure 3: Global Market Value (USD Million) by Style, 2025 to 2035
  • Figure 4: Global Market Value (USD Million) by Functionality, 2025 to 2035
  • Figure 5: Global Market Value (USD Million) by Region, 2025 to 2035
  • Figure 6: Global Market Value (USD Million) Analysis by Region, 2020 to 2035
  • Figure 7: Global Market Volume (Units) Analysis by Region, 2020 to 2035
  • Figure 8: Global Market Value Share (%) and BPS Analysis by Region, 2025 to 2035
  • Figure 9: Global Market Y-o-Y Growth (%) Projections by Region, 2025 to 2035
  • Figure 10: Global Market Value (USD Million) Analysis by Product, 2020 to 2035
  • Figure 11: Global Market Volume (Units) Analysis by Product, 2020 to 2035
  • Figure 12: Global Market Value Share (%) and BPS Analysis by Product, 2025 to 2035
  • Figure 13: Global Market Y-o-Y Growth (%) Projections by Product, 2025 to 2035
  • Figure 14: Global Market Value (USD Million) Analysis by Age, 2020 to 2035
  • Figure 15: Global Market Volume (Units) Analysis by Age, 2020 to 2035
  • Figure 16: Global Market Value Share (%) and BPS Analysis by Age, 2025 to 2035
  • Figure 17: Global Market Y-o-Y Growth (%) Projections by Age, 2025 to 2035
  • Figure 18: Global Market Value (USD Million) Analysis by Style, 2020 to 2035
  • Figure 19: Global Market Volume (Units) Analysis by Style, 2020 to 2035
  • Figure 20: Global Market Value Share (%) and BPS Analysis by Style, 2025 to 2035
  • Figure 21: Global Market Y-o-Y Growth (%) Projections by Style, 2025 to 2035
  • Figure 22: Global Market Value (USD Million) Analysis by Functionality, 2020 to 2035
  • Figure 23: Global Market Volume (Units) Analysis by Functionality, 2020 to 2035
  • Figure 24: Global Market Value Share (%) and BPS Analysis by Functionality, 2025 to 2035
  • Figure 25: Global Market Y-o-Y Growth (%) Projections by Functionality, 2025 to 2035
  • Figure 26: Global Market Attractiveness by Product, 2025 to 2035
  • Figure 27: Global Market Attractiveness by Age, 2025 to 2035
  • Figure 28: Global Market Attractiveness by Style, 2025 to 2035
  • Figure 29: Global Market Attractiveness by Functionality, 2025 to 2035
  • Figure 30: Global Market Attractiveness by Region, 2025 to 2035
  • Figure 31: North America Market Value (USD Million) by Product, 2025 to 2035
  • Figure 32: North America Market Value (USD Million) by Age, 2025 to 2035
  • Figure 33: North America Market Value (USD Million) by Style, 2025 to 2035
  • Figure 34: North America Market Value (USD Million) by Functionality, 2025 to 2035
  • Figure 35: North America Market Value (USD Million) by Country, 2025 to 2035
  • Figure 36: North America Market Value (USD Million) Analysis by Country, 2020 to 2035
  • Figure 37: North America Market Volume (Units) Analysis by Country, 2020 to 2035
  • Figure 38: North America Market Value Share (%) and BPS Analysis by Country, 2025 to 2035
  • Figure 39: North America Market Y-o-Y Growth (%) Projections by Country, 2025 to 2035
  • Figure 40: North America Market Value (USD Million) Analysis by Product, 2020 to 2035
  • Figure 41: North America Market Volume (Units) Analysis by Product, 2020 to 2035
  • Figure 42: North America Market Value Share (%) and BPS Analysis by Product, 2025 to 2035
  • Figure 43: North America Market Y-o-Y Growth (%) Projections by Product, 2025 to 2035
  • Figure 44: North America Market Value (USD Million) Analysis by Age, 2020 to 2035
  • Figure 45: North America Market Volume (Units) Analysis by Age, 2020 to 2035
  • Figure 46: North America Market Value Share (%) and BPS Analysis by Age, 2025 to 2035
  • Figure 47: North America Market Y-o-Y Growth (%) Projections by Age, 2025 to 2035
  • Figure 48: North America Market Value (USD Million) Analysis by Style, 2020 to 2035
  • Figure 49: North America Market Volume (Units) Analysis by Style, 2020 to 2035
  • Figure 50: North America Market Value Share (%) and BPS Analysis by Style, 2025 to 2035
  • Figure 51: North America Market Y-o-Y Growth (%) Projections by Style, 2025 to 2035
  • Figure 52: North America Market Value (USD Million) Analysis by Functionality, 2020 to 2035
  • Figure 53: North America Market Volume (Units) Analysis by Functionality, 2020 to 2035
  • Figure 54: North America Market Value Share (%) and BPS Analysis by Functionality, 2025 to 2035
  • Figure 55: North America Market Y-o-Y Growth (%) Projections by Functionality, 2025 to 2035
  • Figure 56: North America Market Attractiveness by Product, 2025 to 2035
  • Figure 57: North America Market Attractiveness by Age, 2025 to 2035
  • Figure 58: North America Market Attractiveness by Style, 2025 to 2035
  • Figure 59: North America Market Attractiveness by Functionality, 2025 to 2035
  • Figure 60: North America Market Attractiveness by Country, 2025 to 2035
  • Figure 61: Latin America Market Value (USD Million) by Product, 2025 to 2035
  • Figure 62: Latin America Market Value (USD Million) by Age, 2025 to 2035
  • Figure 63: Latin America Market Value (USD Million) by Style, 2025 to 2035
  • Figure 64: Latin America Market Value (USD Million) by Functionality, 2025 to 2035
  • Figure 65: Latin America Market Value (USD Million) by Country, 2025 to 2035
  • Figure 66: Latin America Market Value (USD Million) Analysis by Country, 2020 to 2035
  • Figure 67: Latin America Market Volume (Units) Analysis by Country, 2020 to 2035
  • Figure 68: Latin America Market Value Share (%) and BPS Analysis by Country, 2025 to 2035
  • Figure 69: Latin America Market Y-o-Y Growth (%) Projections by Country, 2025 to 2035
  • Figure 70: Latin America Market Value (USD Million) Analysis by Product, 2020 to 2035
  • Figure 71: Latin America Market Volume (Units) Analysis by Product, 2020 to 2035
  • Figure 72: Latin America Market Value Share (%) and BPS Analysis by Product, 2025 to 2035
  • Figure 73: Latin America Market Y-o-Y Growth (%) Projections by Product, 2025 to 2035
  • Figure 74: Latin America Market Value (USD Million) Analysis by Age, 2020 to 2035
  • Figure 75: Latin America Market Volume (Units) Analysis by Age, 2020 to 2035
  • Figure 76: Latin America Market Value Share (%) and BPS Analysis by Age, 2025 to 2035
  • Figure 77: Latin America Market Y-o-Y Growth (%) Projections by Age, 2025 to 2035
  • Figure 78: Latin America Market Value (USD Million) Analysis by Style, 2020 to 2035
  • Figure 79: Latin America Market Volume (Units) Analysis by Style, 2020 to 2035
  • Figure 80: Latin America Market Value Share (%) and BPS Analysis by Style, 2025 to 2035
  • Figure 81: Latin America Market Y-o-Y Growth (%) Projections by Style, 2025 to 2035
  • Figure 82: Latin America Market Value (USD Million) Analysis by Functionality, 2020 to 2035
  • Figure 83: Latin America Market Volume (Units) Analysis by Functionality, 2020 to 2035
  • Figure 84: Latin America Market Value Share (%) and BPS Analysis by Functionality, 2025 to 2035
  • Figure 85: Latin America Market Y-o-Y Growth (%) Projections by Functionality, 2025 to 2035
  • Figure 86: Latin America Market Attractiveness by Product, 2025 to 2035
  • Figure 87: Latin America Market Attractiveness by Age, 2025 to 2035
  • Figure 88: Latin America Market Attractiveness by Style, 2025 to 2035
  • Figure 89: Latin America Market Attractiveness by Functionality, 2025 to 2035
  • Figure 90: Latin America Market Attractiveness by Country, 2025 to 2035
  • Figure 91: Europe Market Value (USD Million) by Product, 2025 to 2035
  • Figure 92: Europe Market Value (USD Million) by Age, 2025 to 2035
  • Figure 93: Europe Market Value (USD Million) by Style, 2025 to 2035
  • Figure 94: Europe Market Value (USD Million) by Functionality, 2025 to 2035
  • Figure 95: Europe Market Value (USD Million) by Country, 2025 to 2035
  • Figure 96: Europe Market Value (USD Million) Analysis by Country, 2020 to 2035
  • Figure 97: Europe Market Volume (Units) Analysis by Country, 2020 to 2035
  • Figure 98: Europe Market Value Share (%) and BPS Analysis by Country, 2025 to 2035
  • Figure 99: Europe Market Y-o-Y Growth (%) Projections by Country, 2025 to 2035
  • Figure 100: Europe Market Value (USD Million) Analysis by Product, 2020 to 2035
  • Figure 101: Europe Market Volume (Units) Analysis by Product, 2020 to 2035
  • Figure 102: Europe Market Value Share (%) and BPS Analysis by Product, 2025 to 2035
  • Figure 103: Europe Market Y-o-Y Growth (%) Projections by Product, 2025 to 2035
  • Figure 104: Europe Market Value (USD Million) Analysis by Age, 2020 to 2035
  • Figure 105: Europe Market Volume (Units) Analysis by Age, 2020 to 2035
  • Figure 106: Europe Market Value Share (%) and BPS Analysis by Age, 2025 to 2035
  • Figure 107: Europe Market Y-o-Y Growth (%) Projections by Age, 2025 to 2035
  • Figure 108: Europe Market Value (USD Million) Analysis by Style, 2020 to 2035
  • Figure 109: Europe Market Volume (Units) Analysis by Style, 2020 to 2035
  • Figure 110: Europe Market Value Share (%) and BPS Analysis by Style, 2025 to 2035
  • Figure 111: Europe Market Y-o-Y Growth (%) Projections by Style, 2025 to 2035
  • Figure 112: Europe Market Value (USD Million) Analysis by Functionality, 2020 to 2035
  • Figure 113: Europe Market Volume (Units) Analysis by Functionality, 2020 to 2035
  • Figure 114: Europe Market Value Share (%) and BPS Analysis by Functionality, 2025 to 2035
  • Figure 115: Europe Market Y-o-Y Growth (%) Projections by Functionality, 2025 to 2035
  • Figure 116: Europe Market Attractiveness by Product, 2025 to 2035
  • Figure 117: Europe Market Attractiveness by Age, 2025 to 2035
  • Figure 118: Europe Market Attractiveness by Style, 2025 to 2035
  • Figure 119: Europe Market Attractiveness by Functionality, 2025 to 2035
  • Figure 120: Europe Market Attractiveness by Country, 2025 to 2035
  • Figure 121: Asia Pacific Market Value (USD Million) by Product, 2025 to 2035
  • Figure 122: Asia Pacific Market Value (USD Million) by Age, 2025 to 2035
  • Figure 123: Asia Pacific Market Value (USD Million) by Style, 2025 to 2035
  • Figure 124: Asia Pacific Market Value (USD Million) by Functionality, 2025 to 2035
  • Figure 125: Asia Pacific Market Value (USD Million) by Country, 2025 to 2035
  • Figure 126: Asia Pacific Market Value (USD Million) Analysis by Country, 2020 to 2035
  • Figure 127: Asia Pacific Market Volume (Units) Analysis by Country, 2020 to 2035
  • Figure 128: Asia Pacific Market Value Share (%) and BPS Analysis by Country, 2025 to 2035
  • Figure 129: Asia Pacific Market Y-o-Y Growth (%) Projections by Country, 2025 to 2035
  • Figure 130: Asia Pacific Market Value (USD Million) Analysis by Product, 2020 to 2035
  • Figure 131: Asia Pacific Market Volume (Units) Analysis by Product, 2020 to 2035
  • Figure 132: Asia Pacific Market Value Share (%) and BPS Analysis by Product, 2025 to 2035
  • Figure 133: Asia Pacific Market Y-o-Y Growth (%) Projections by Product, 2025 to 2035
  • Figure 134: Asia Pacific Market Value (USD Million) Analysis by Age, 2020 to 2035
  • Figure 135: Asia Pacific Market Volume (Units) Analysis by Age, 2020 to 2035
  • Figure 136: Asia Pacific Market Value Share (%) and BPS Analysis by Age, 2025 to 2035
  • Figure 137: Asia Pacific Market Y-o-Y Growth (%) Projections by Age, 2025 to 2035
  • Figure 138: Asia Pacific Market Value (USD Million) Analysis by Style, 2020 to 2035
  • Figure 139: Asia Pacific Market Volume (Units) Analysis by Style, 2020 to 2035
  • Figure 140: Asia Pacific Market Value Share (%) and BPS Analysis by Style, 2025 to 2035
  • Figure 141: Asia Pacific Market Y-o-Y Growth (%) Projections by Style, 2025 to 2035
  • Figure 142: Asia Pacific Market Value (USD Million) Analysis by Functionality, 2020 to 2035
  • Figure 143: Asia Pacific Market Volume (Units) Analysis by Functionality, 2020 to 2035
  • Figure 144: Asia Pacific Market Value Share (%) and BPS Analysis by Functionality, 2025 to 2035
  • Figure 145: Asia Pacific Market Y-o-Y Growth (%) Projections by Functionality, 2025 to 2035
  • Figure 146: Asia Pacific Market Attractiveness by Product, 2025 to 2035
  • Figure 147: Asia Pacific Market Attractiveness by Age, 2025 to 2035
  • Figure 148: Asia Pacific Market Attractiveness by Style, 2025 to 2035
  • Figure 149: Asia Pacific Market Attractiveness by Functionality, 2025 to 2035
  • Figure 150: Asia Pacific Market Attractiveness by Country, 2025 to 2035
  • Figure 151: MEA Market Value (USD Million) by Product, 2025 to 2035
  • Figure 152: MEA Market Value (USD Million) by Age, 2025 to 2035
  • Figure 153: MEA Market Value (USD Million) by Style, 2025 to 2035
  • Figure 154: MEA Market Value (USD Million) by Functionality, 2025 to 2035
  • Figure 155: MEA Market Value (USD Million) by Country, 2025 to 2035
  • Figure 156: MEA Market Value (USD Million) Analysis by Country, 2020 to 2035
  • Figure 157: MEA Market Volume (Units) Analysis by Country, 2020 to 2035
  • Figure 158: MEA Market Value Share (%) and BPS Analysis by Country, 2025 to 2035
  • Figure 159: MEA Market Y-o-Y Growth (%) Projections by Country, 2025 to 2035
  • Figure 160: MEA Market Value (USD Million) Analysis by Product, 2020 to 2035
  • Figure 161: MEA Market Volume (Units) Analysis by Product, 2020 to 2035
  • Figure 162: MEA Market Value Share (%) and BPS Analysis by Product, 2025 to 2035
  • Figure 163: MEA Market Y-o-Y Growth (%) Projections by Product, 2025 to 2035
  • Figure 164: MEA Market Value (USD Million) Analysis by Age, 2020 to 2035
  • Figure 165: MEA Market Volume (Units) Analysis by Age, 2020 to 2035
  • Figure 166: MEA Market Value Share (%) and BPS Analysis by Age, 2025 to 2035
  • Figure 167: MEA Market Y-o-Y Growth (%) Projections by Age, 2025 to 2035
  • Figure 168: MEA Market Value (USD Million) Analysis by Style, 2020 to 2035
  • Figure 169: MEA Market Volume (Units) Analysis by Style, 2020 to 2035
  • Figure 170: MEA Market Value Share (%) and BPS Analysis by Style, 2025 to 2035
  • Figure 171: MEA Market Y-o-Y Growth (%) Projections by Style, 2025 to 2035
  • Figure 172: MEA Market Value (USD Million) Analysis by Functionality, 2020 to 2035
  • Figure 173: MEA Market Volume (Units) Analysis by Functionality, 2020 to 2035
  • Figure 174: MEA Market Value Share (%) and BPS Analysis by Functionality, 2025 to 2035
  • Figure 175: MEA Market Y-o-Y Growth (%) Projections by Functionality, 2025 to 2035
  • Figure 176: MEA Market Attractiveness by Product, 2025 to 2035
  • Figure 177: MEA Market Attractiveness by Age, 2025 to 2035
  • Figure 178: MEA Market Attractiveness by Style, 2025 to 2035
  • Figure 179: MEA Market Attractiveness by Functionality, 2025 to 2035
  • Figure 180: MEA Market Attractiveness by Country, 2025 to 2035

Frequently Asked Questions

What is the Baby Diaper Market Size in 2025 and 2035?

The global baby diaper market is valued at USD 63 billion in 2025 and is projected to reach USD 115 billion by 2035, growing at a CAGR of 6.2%.

Which is the Top-Selling Baby Diaper Type in 2025?

Underwear pants are expected to dominate the global baby diaper market in 2025, holding nearly 50% market share.

Which Age Group Drives the Highest Revenue in the Baby Diaper Market?

The 6 to 18 months age group contributes nearly 45% of market revenue in 2025.

What is the Market Share of Pant Style vs. Tape Style Baby Diapers?

Pant style baby diapers hold around 60% market share in 2025, reflecting a global consumer shift toward convenience.

Which Countries are the Fastest Growing Baby Diaper Markets?

China leads with a projected CAGR of 10% (2025 to 2035), followed by India and other Asian markets, due to rising birth rates and urbanization.

Explore Similar Insights

Future Market Insights

Baby Diaper Market