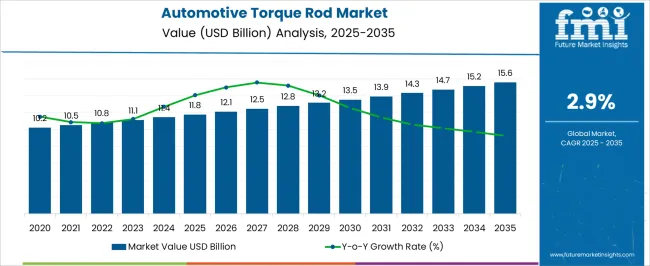
The Automotive Torque Rod Market is estimated to be valued at USD 11.8 billion in 2025 and is projected to reach USD 15.6 billion by 2035, registering a compound annual growth rate (CAGR) of 2.9% over the forecast period.
| Metric | Value |
|---|---|
| Automotive Torque Rod Market Estimated Value in (2025 E) | USD 11.8 billion |
| Automotive Torque Rod Market Forecast Value in (2035 F) | USD 15.6 billion |
| Forecast CAGR (2025 to 2035) | 2.9% |
The Automotive Torque Rod market is experiencing steady growth, driven by the increasing demand for enhanced vehicle stability, ride comfort, and safety across the global automotive industry. Rising production of passenger vehicles and commercial vehicles, coupled with the adoption of advanced suspension systems, is supporting market expansion. Torque rods play a critical role in controlling axle movement and improving handling performance, which has led to their widespread adoption in both front and rear suspension systems.
Innovations in material selection and manufacturing processes have enhanced durability, load-bearing capacity, and resistance to vibration, contributing to performance optimization. The market is further fueled by rising consumer expectations for safety and comfort, as well as stringent regulatory standards governing vehicle stability and crashworthiness.
Integration of torque rods with modern suspension technologies in passenger cars and commercial vehicles enables improved maneuverability and reduced wear on components As automotive manufacturers focus on lightweight, high-performance, and cost-effective solutions, the market for torque rods is expected to witness continued growth over the forecast period, supported by advancements in design, materials, and production efficiency.
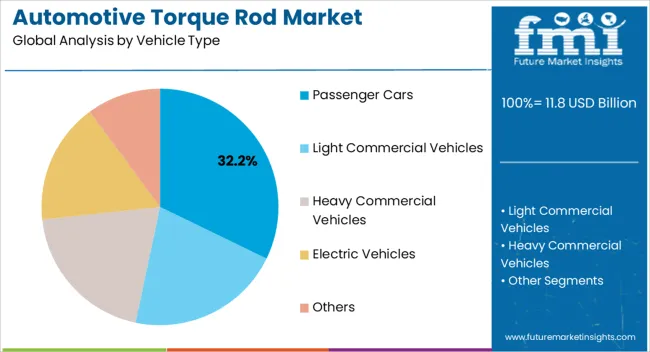
The passenger cars segment is projected to hold 32.2% of the Automotive Torque Rod market revenue in 2025, establishing it as the leading vehicle type. Growth in this segment is being driven by the increasing production of passenger vehicles and the rising consumer focus on ride quality, safety, and handling performance. Torque rods are widely deployed in passenger cars to enhance front and rear suspension stability, reduce axle displacement, and improve steering response.
Advanced engineering design and the integration of lightweight materials in torque rod systems allow for improved durability and performance while maintaining fuel efficiency. Manufacturers are leveraging these components to comply with stricter safety regulations and consumer expectations for superior driving comfort.
Adoption is further reinforced by the trend toward premium and mid-range vehicles, which demand higher suspension performance As passenger vehicle production continues to grow globally, and suspension technologies advance, the passenger cars segment is expected to maintain its leading position, supported by innovation in design, performance, and reliability.
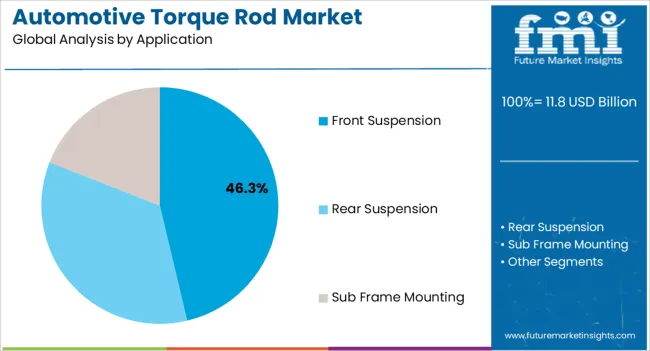
The front suspension application segment is anticipated to account for 46.3% of the market revenue in 2025, making it the leading application area. Growth in this segment is being driven by the increasing demand for improved steering control, vehicle stability, and ride comfort in modern automobiles. Torque rods in front suspension systems help reduce axle movement, maintain alignment, and enhance handling performance, particularly under high load or challenging driving conditions.
Manufacturers are increasingly integrating high-strength materials and precision-engineered components to achieve consistent performance and durability. The ability to enhance suspension response while reducing vibrations and wear has further reinforced adoption. Growing emphasis on safety regulations and consumer expectations for superior ride quality in passenger vehicles supports sustained market expansion.
Technological advancements in suspension design, including integration with electronic stability systems, are further propelling adoption As automotive manufacturers continue to optimize vehicle dynamics, the front suspension application segment is expected to remain the primary contributor to market growth.
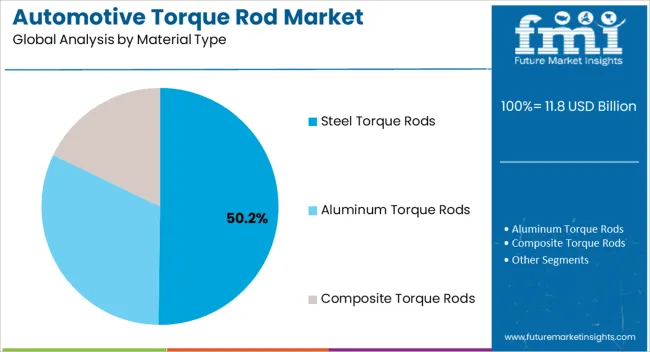
The steel torque rods segment is projected to hold 50.2% of the market revenue in 2025, establishing it as the leading material type. Growth in this segment is being driven by the material’s high strength, durability, and cost-effectiveness, which are essential for controlling axle movements and maintaining suspension stability. Steel torque rods offer superior load-bearing capacity, impact resistance, and fatigue life, making them ideal for both passenger cars and commercial vehicles.
The ability to withstand dynamic forces while maintaining dimensional stability ensures long-term performance and reliability. Manufacturers continue to optimize steel compositions and heat treatment processes to enhance magnetic and mechanical properties, further supporting adoption.
Steel torque rods are compatible with existing suspension designs, reducing the need for redesign and enabling cost-efficient integration As the automotive industry increasingly focuses on safety, performance, and regulatory compliance, steel torque rods are expected to maintain their market dominance, supported by widespread industry familiarity, consistent quality, and established manufacturing infrastructure.
From 2020 to 2025, the global Automotive Torque Rod market experienced a CAGR of 1.2%, reaching a market size of USD 11.8 million in 2025.
From 2020 to 2025, the global Automotive Torque Rod market witnessed steady growth due to SUVs and crossovers have become increasingly popular in recent years.
These vehicles are typically heavier than cars, which puts more stress on the suspension system. Torque rods play an important role in supporting the weight of these vehicles and keeping them stable on the road.
Looking ahead, the global Automotive Torque Rod market is expected to rise at a CAGR of 3.0% from 2025 to 2035. During the forecast period, the market size is expected to reach USD 11,095.4 million.
The Automotive Torque Rod market is expected to continue its growth trajectory from 2025 to 2035, driven by use of lightweight materials, such as aluminum and Composite Material.
These materials are strong and durable, but they are also lighter than traditional materials, such as steel. This weight reduction can improve fuel efficiency and performance. The growth of the Automobile sector and the rising adoption of advance safety features are expected to drive the demand for Automotive Torque Rod during the forecast period.
The Asia Pacific region is poised for substantial growth in the Automotive Torque Rod market, fueled by the rapid development of economies like China and India. Nevertheless, the market's expansion may encounter obstacles due to the emergence of alternative technologies and the considerable expenses associated with Torque Rod manufacturing, including installation and maintenance costs.
| Country | The United States |
|---|---|
| Market Size (USD million) by End of Forecast Period (2035) | USD 2,715.1 million |
| CAGR % 2025 to End of Forecast (2035) | 3.20 % |
The Automotive Torque Rod market in the United States is expected to reach a market share of USD 2,715.1 million by 2035, expanding at a CAGR of 3.20%. The Automotive Torque Rod market in the United States is expected to witness growth due to Passenger vehicles are more likely to have torque rods than commercial vehicles, so the growth in the passenger vehicle market has led to an increase in demand for torque rods. Additionally, there are a few other factors expected to drive the demand for Automotive Torque Rod in the country are:
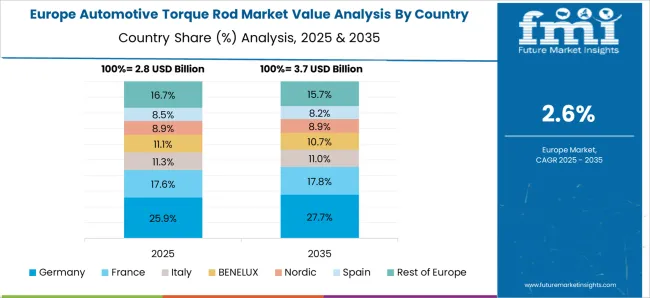
| Country | Germany |
|---|---|
| Market Size (USD million) by End of Forecast Period (2035) | USD 2,611.6 million |
| CAGR % 2025 to End of Forecast (2035) | 2.80 % |
The Automotive Torque Rod market in the Germany is expected to reach a market share of USD 2,611.6 million, expanding at a CAGR of 2.80 % during the forecast period. The Germany market is projected to experience growth owing to the rising demand for Automotive Torque Rod in the automotive market.
The German automotive sector is characterized by advanced manufacturing capabilities, technological innovation, and a focus on high-quality vehicles. As a result, the demand for various automotive components, including torque rods, remains robust.
| Country | China |
|---|---|
| Market Size (USD million) by End of Forecast Period (2035) | USD 2822.1 million |
| CAGR % 2025 to End of Forecast (2035) | 3.60 % |
The Automotive Torque Rod market in China is anticipated to reach a market share of USD 2822.1 million, moving at a CAGR of 3.60 % during the forecast period. The Automotive Torque Rod market in China is expected to grow prominently due increasing use of torque rods in electric vehicles is expected to drive growth in the automotive torque rod market in China.
Electric motors generate high torque from the moment they start, and the torque is delivered differently compared to an ICE. Therefore, torque rods designed specifically for EVs need to accommodate these unique requirements, such as managing the torque distribution and controlling vibrations caused by the electric motor. This necessitates the development and use of specialized torque rods for EVs, driving the market growth.
With a market share of 78% in 2025, the Passenger Car segment is poised to emerge as the dominant force within the Automotive Torque Rod market. This segment already holds a substantial market share in 2025, fueled by the escalating demand for Passenger cars and a growing emphasis on safety and performance.
The increasing focus on safety and performance aspects acts as a catalyst, propelling the Passenger Car segment to a prominent position in the market.
SUVs and crossovers are becoming increasingly popular, and this is also driving the demand for automotive torque rods. These vehicles are heavier than passenger cars, and they require stronger torque rods to support the weight.
The growing demand for electric vehicles (EVs) is driving the market for automotive torque rods. EVs are heavier than traditional gasoline-powered vehicles and have different suspension requirements, which means they need stronger and more sophisticated torque rods. Efficient torque transfer is crucial in electric vehicles to maximize traction and minimize wheel slippage.
Additionally, EV manufacturers are using new technologies like active suspension systems, which require different types of torque rods that are designed to meet the specific needs of these systems.
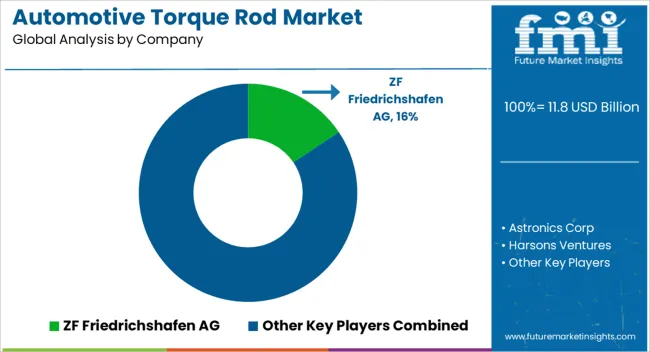
Key players in the market prioritize high product quality, reliability, and durability to meet strict industry standards. This emphasis allows them to gain a competitive edge by delivering superior performance and enhancing customer satisfaction through their torque rod offerings.
Key Strategies Adopted by the Players
Product Innovation
Key players in the market are constantly innovating and developing new technologies to improve the performance and efficiency of torque rods. For example, some companies are developing new materials for torque rods that are stronger and lighter than traditional materials.
Strategic Partnerships and Collaborations
It can be a valuable tool for key players in the automotive torque rod market. By forming these partnerships, companies can gain access to new resources, expertise, and markets. This can help them to stay competitive in a rapidly changing market.
Expansion into Emerging Markets
The emerging markets of China and India are experiencing remarkable growth in the Automotive Torque Rod market. To capitalize on this potential, major players in the market are strategically expanding their footprint in these markets. They are achieving this by establishing local manufacturing facilities and bolstering their distribution networks, ensuring a strong presence and effective market reach in these dynamic regions.
Performance Optimization
Digital solutions optimize automotive torque shaft performance by leveraging data analytics and AI algorithms to identify areas for improvement, and refine designs to meet market demands.
Key Players in the Automotive Torque Rod Market
Key Developments in the Automotive Torque Rod Market:
The global automotive torque rod market is estimated to be valued at USD 11.8 billion in 2025.
The market size for the automotive torque rod market is projected to reach USD 15.6 billion by 2035.
The automotive torque rod market is expected to grow at a 2.9% CAGR between 2025 and 2035.
The key product types in automotive torque rod market are passenger cars, _compact, _mid-size, _luxury, _suv, light commercial vehicles, heavy commercial vehicles, electric vehicles and others.
In terms of application, front suspension segment to command 46.3% share in the automotive torque rod market in 2025.


Full Research Suite comprises of:
Market outlook & trends analysis
Interviews & case studies
Strategic recommendations
Vendor profiles & capabilities analysis
5-year forecasts
8 regions and 60+ country-level data splits
Market segment data splits
12 months of continuous data updates
DELIVERED AS:
PDF EXCEL ONLINE
Automotive Torque Rod Bush Market Size and Share Forecast Outlook 2025 to 2035
Automotive Seating Market Size and Share Forecast Outlook 2025 to 2035
Automotive Appearance Chemical Market Size and Share Forecast Outlook 2025 to 2035
Automotive Remote Diagnostic Market Size and Share Forecast Outlook 2025 to 2035
Automotive-grade Inertial Navigation System Market Size and Share Forecast Outlook 2025 to 2035
Automotive Thin IGBT Module Market Size and Share Forecast Outlook 2025 to 2035
Automotive Hydrogen Leak Detection Sensors Market Size and Share Forecast Outlook 2025 to 2035
Automotive Hybrid IGBTs Market Size and Share Forecast Outlook 2025 to 2035
Automotive Exhaust Extraction Hose Reels Market Size and Share Forecast Outlook 2025 to 2035
Automotive Electroplating Service Market Size and Share Forecast Outlook 2025 to 2035
Automotive Manufacturing Equipment Market Size and Share Forecast Outlook 2025 to 2035
Automotive Pressure Sensor Market Size and Share Forecast Outlook 2025 to 2035
Automotive Vacuum Brake Booster Market Size and Share Forecast Outlook 2025 to 2035
Automotive Smart Antenna Market Size and Share Forecast Outlook 2025 to 2035
Automotive Actuator Market Size and Share Forecast Outlook 2025 to 2035
Automotive Exhaust Manifold Market Size and Share Forecast Outlook 2025 to 2035
Automotive Roof Rails Market Size and Share Forecast Outlook 2025 to 2035
Automotive Resonator Market Size and Share Forecast Outlook 2025 to 2035
Automotive Counter Shaft Market Size and Share Forecast Outlook 2025 to 2035
Automotive Wheel Coating Market Size and Share Forecast Outlook 2025 to 2035

Thank you!
You will receive an email from our Business Development Manager. Please be sure to check your SPAM/JUNK folder too.
Chat With
MaRIA