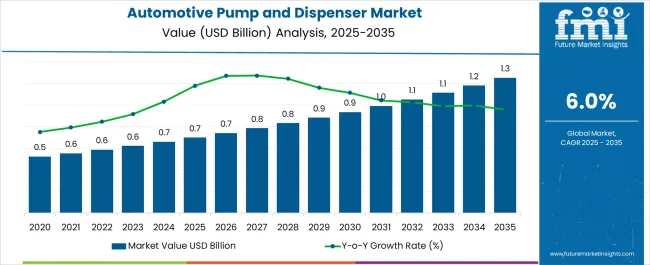
The Automotive Pump and Dispenser Market is estimated to be valued at USD 0.7 billion in 2025 and is projected to reach USD 1.3 billion by 2035, registering a compound annual growth rate (CAGR) of 6.0% over the forecast period.
| Metric | Value |
|---|---|
| Automotive Pump and Dispenser Market Estimated Value in (2025 E) | USD 0.7 billion |
| Automotive Pump and Dispenser Market Forecast Value in (2035 F) | USD 1.3 billion |
| Forecast CAGR (2025 to 2035) | 6.0% |
The automotive pump and dispenser market is expanding due to increasing demand for efficient fluid handling systems in automotive servicing, maintenance, and lubrication processes. Growth is being driven by rising vehicle ownership, expanding service networks, and the growing importance of precise dispensing systems to enhance efficiency and reduce wastage.
Current dynamics are characterized by strong demand from aftermarket service providers and OEM workshops, with technology advancements in pump design and material durability supporting broader adoption. The shift toward cost-effective, lightweight, and corrosion-resistant solutions is reinforcing market expansion, particularly in emerging economies with expanding automotive fleets.
Future outlook is defined by the integration of automated and precision-based dispensers, the rise of eco-friendly materials, and regulatory compliance promoting safety and reduced emissions during fluid handling Growth rationale is anchored on the critical role dispensers play in ensuring operational efficiency, reliability, and accuracy in automotive servicing, while innovations in materials and design are expected to sustain long-term growth and global adoption.
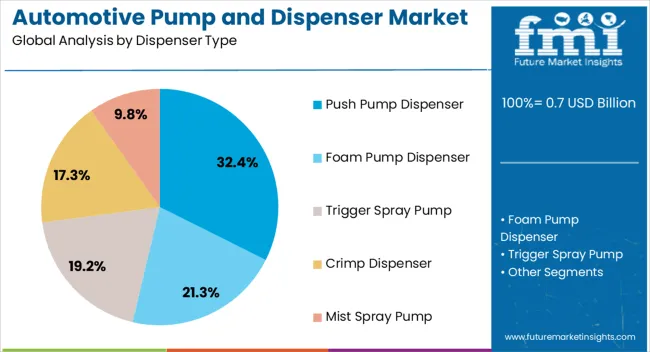
The push pump dispenser segment, accounting for 32.40% of the dispenser type category, has established leadership due to its ease of use, reliability, and suitability for handling a wide range of automotive fluids. Its prominence has been reinforced by cost-effectiveness, wide availability, and adaptability across service stations and workshops.
Demand stability is being supported by consistent adoption in both OEM and aftermarket channels. Improvements in dispenser mechanisms, such as enhanced sealing and controlled flow delivery, have contributed to performance reliability and reduced leakage.
The segment is further benefiting from the trend toward user-friendly designs that minimize servicing time while ensuring precision Strategic investments by manufacturers in ergonomics and efficiency are expected to sustain this segment’s share, with incremental growth anticipated as service volumes rise across global automotive hubs.
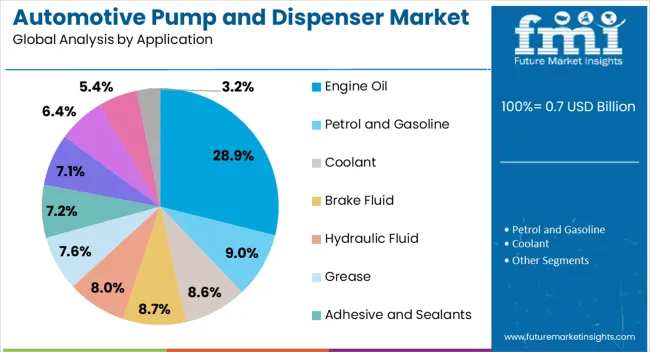
The engine oil application segment, representing 28.90% of the application category, has secured leadership as the most critical area of use for pumps and dispensers. Engine maintenance relies heavily on precise and efficient oil dispensing, ensuring vehicle performance and longevity. Consistent demand for regular servicing, combined with the rising number of vehicles in operation, has reinforced this segment’s position.
Workshops and service centers prioritize accurate dispensing to minimize wastage, improve cost efficiency, and comply with maintenance standards. Advancements in dispenser technology, such as controlled flow regulation and spill prevention features, have further supported growth.
The segment is also benefiting from increasing adoption in OEM facilities where streamlined operations are critical As vehicle ownership expands globally and maintenance cycles remain essential, the engine oil application segment is expected to maintain its market leadership and drive stable demand for automotive pump and dispenser solutions.
The global automotive pump and dispenser market is expected to experience a lucrative growth outlook during the forecast period. A new estimation predicts that sales will rise by 2035 and is projected to build a cumulative financial benefit of USD 380.5 million. The market is predicted to expand 1.6 times the current value during the forecast period.
The use of recyclable and sustainable automotive pumps and dispensers is experiencing significant growth in response to the increasing demand for sustainable packaging solutions. Moreover, this transition toward recyclable materials corresponds with the escalating consumer inclination toward eco-friendly packaging choices. Manufacturers are acknowledging the imperative of carbon footprint reduction and prioritizing the creation of recyclable solutions.
For instance, in May 2025, TriMas Packaging Group announced the launch of Singolo product of 2CC dispensing pumps manufactured from polypropylene material, which is fully recyclable. The product also boasts of a class ‘A’ rating by RecyClass. It is a cross-industry initiative dedicated to advancing the recyclability and traceability of plastic packaging in Europe.
The production of automobiles is experiencing sustained growth for several interconnected reasons. These include increasing consumer demand, technological advancements and innovation, government incentives, and globalization.
For instance, data provided by the European Automobile Manufacturers Association (ACEA) reveal that over 0.7 million automobiles were produced around the world in 2025, recording around a 6% y-o-y increase from 2024. Over the past decade, the automotive market in emerging economies such as China, India, and Brazil has demonstrated impressive resilience.
Until recently, these countries have outperformed several mature markets. This growth can be attributed primarily to factors such as increasing urbanization and the rapid development of infrastructure, among others.
Growth is expected to drive demand for automotive pumps and dispensers in developing nations. This is because automobile production necessitates the use of several fluids, such as oil and washing fluids, for the design, testing, and maintenance of the vehicles.
The global automotive pump and dispenser market exhibited a CAGR of 3.1% during the historical period. It stood at a market value of USD 0.7 million in 2025 from USD 0.5 million in 2020.
| Historical CAGR (2020 to 2025) | 3.1% |
|---|---|
| Historical Value (2025) | USD 0.7 million |
The global automotive industry has been increasing steadily. According to the International Organization of Motor Vehicle Manufacturers, in 2025, the global sales of all vehicles were 81,628,533 units.
As more vehicles are being sold, the demand for automotive pumps and dispensers is also increasing. The growing demand for convenience and efficiency is fueling the need for automotive pumps and dispensers.
Car enthusiasts and owners seeking to customize their vehicles often undertake several modifications, including engine enhancements, oil and fluid upgrades, and cosmetic changes. These modifications frequently involve the addition or replacement of automotive fluids such as high-performance motor oil, specialty lubricants, and aftermarket additives.
A notable and transformative trend in the automotive pump and dispenser market is the substantial surge in manufacturers' investments in research and development. It is also pushed by their commitment to pioneering product innovation, accompanied by the strategic launch of novel offerings.
Manufacturers are also directing substantial financial resources and intellectual capital toward research and development initiatives. They aim to cultivate proprietary technologies and gain a competitive edge. Easy dispensing, wide product adaptability, and different appealing looks are other significant factors expected to drive the global automotive pump and dispenser market over the forecast period.
The table presents the expected CAGR for the automotive pump and dispenser market over several semi-annual periods from 2025 to 2035. In the first half (H1) of the decade from 2025 to 2035, the business is expected to surge at a CAGR of 5.8%, followed by a slightly higher growth rate of 5.7% in the second half (H2) of the same decade.
Moving into the subsequent period, from H1 2025 to H2 2035, the CAGR is projected to increase slightly to 6.3% in the first half and remain steady at 6.1% in the second half. These values offer insights into the anticipated growth trends for the automotive pump and dispenser market, aiding stakeholders and investors in making informed decisions regarding investments and strategies.
| Particular | Value CAGR |
|---|---|
| H1 | 5.8% (2025 to 2035) |
| H2 | 5.7% (2025 to 2035) |
| H1 | 6.3% (2025 to 2035) |
| H2 | 6.1% (2025 to 2035) |
| Attributes | Key Factors |
|---|---|
| Automotive Pump and Dispenser Market Trends |
|
| Growth Hindrances |
|
| Upcoming Opportunities |
|
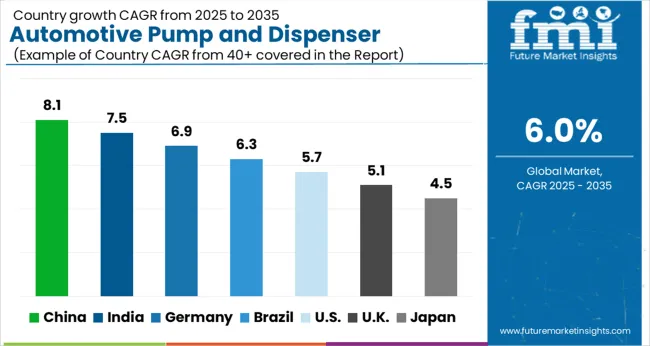
In the table below, the CAGRs of the top six countries are given for the review period 2025 to 2035. China, Japan, and India are expected to remain dominant by exhibiting CAGRs of 5.9%, 6.6%, and 7.1%, respectively. The United Kingdom and the United States are set to follow with CAGRs of 3.0% and 3.3%, respectively.
| Countries | Value CAGR |
|---|---|
| United States | 3.3% |
| Germany | 2.7% |
| United Kingdom | 3.0% |
| Japan | 6.6% |
| China | 5.9% |
| India | 7.1% |
India’s automotive pump and dispenser market is estimated to expand at a CAGR of 7.1% during the forecast period. According to the India Brand Equity Foundation (IBEF), the country’s passenger car market was valued at USD 0.70 billion in 2024. It is expected to attain a valuation of USD 1.3 billion by 2035 while registering a CAGR of over 9% between 2025 and 2035.
In July 2025, the total production of passenger vehicles, three-wheelers, two-wheelers, and quadricycles was 2.08 units. With the rapid expansion of the automotive industry in India, the automotive pump and dispenser market is set to rise steadily.
The Government of India is also encouraging biofuel consumption. This includes regulations aimed at promoting the development and consumption of biofuels, which can have a positive impact on the need for specialty dispensers.
Specialized dispensing solutions are in high demand in urban areas due to developments in urbanization in India, especially in large cities. This also applies to small, effective gas stations.
Efficiency and convenience are important to India-based customers. Fast, dependable, and user-friendly dispensing experiences can increase a company's chances of success in the marketplace. Expanding their franchise and dealer networks can create an opportunity for businesses, particularly in areas with high demand.
The United Kingdom is expected to showcase growth at a CAGR of 3.0% from 2025 to 2035. Similar to several other nations, the United Kingdom is witnessing a transition toward electric automobiles. The traditional automobile pump and dispenser business is being impacted by this shift since there can be a long-term decline in the need for gasoline and diesel.
Enhancing the United Kingdom's infrastructure for charging electric vehicles is a top priority. This offers businesses the chance to invest in EV charging infrastructure, such as fast chargers located beside important highways and in urban areas.
To encourage the use of electric cars, the United Kingdom’s government has launched a number of programs and incentives. This includes tax breaks, low-emission zones in cities, and incentives for the construction of EV charging infrastructure. There is a growing interest in sustainable and renewable fuels, including biofuels and synthetic fuels.
The United Kingdom has also shown interest in hydrogen fuel cell technology, which can lead to the potential to construct specialized hydrogen fueling stations and dispensers. The demand for dispensers that accommodate these different fuel types would increase as a result.
Improvements in pump and dispenser technologies, such as the incorporation of IoT for data analytics, are another crucial factor that is set to drive demand in the United Kingdom. At the same time, the emergence of smart payment systems and remote monitoring is anticipated to push growth.
The automotive pump and dispenser market in China is projected to surge at a CAGR of 5.9% through 2035. Market adherence to safety and regulatory requirements is essential in China. Businesses that provide sophisticated safety features and compliance capabilities in their pumps and dispensers can discover new opportunities.
The need for specialized dispensing solutions in urban areas can be driven by trends in urbanization and the emphasis on sustainable solutions for urban mobility. In the pump and dispenser business, partnerships between energy providers, technological companies, and automakers can result in the development of novel solutions. It is still of utmost importance to give clients a seamless and practical experience, including quick and dependable dispensing, simple payment methods, and intuitive user interfaces.
In the short to medium term, traditional fuels (diesel and gasoline) will continue to play a crucial role. These are projected to help in offering opportunities for pump and dispenser firms even while the shift to electric vehicles and other fuels is underway.
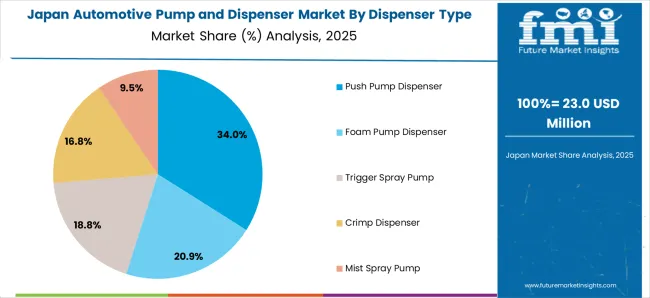
Japan’s automotive pump and dispenser market is projected to expand at a CAGR of 6.6% by 2035. The advanced automobile technology sector in Japan is well-known. This includes a focus on hydrogen fuel cell vehicles (FCVs), electric cars (EVs), and hybrid technologies. The nation's pump and dispenser market is being shaped by this dynamic.
Building up its infrastructure for charging electric vehicles, which includes fast-charging stations at strategic points, roads, and metropolitan areas, is a top priority for Japan. This offers chances for businesses that specialize in EV charging systems.
Japan has been investigating and funding hydrogen fuel cell technologies for use in automobiles. Opportunities for the development of specialized hydrogen dispensers and stations are created by this.
Japan also has strict environmental laws and emission restrictions. This influences the market for pumps and dispensers by increasing the demand for cars that are low-emission and fuel-efficient.
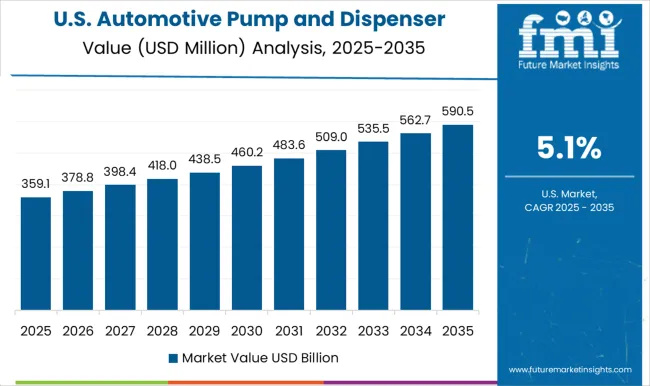
The United States’ automotive pump and dispenser market is projected to expand at a CAGR of 3.3% by 2035. Pumps and dispensers that have Internet of Things (IoT) technology integrated into them enable predictive maintenance, data-driven insights, and remote monitoring.
It has the potential to enhance customer satisfaction and optimize operations. Fueling stations are among the areas of the automotive industry where automation is advancing. Labor costs can be decreased, and efficiency can be raised using automated pumps and dispensers.
Emerging markets are seeing expansion in the automotive sector, which has raised the demand for pumps and dispensers. Manufacturers would need to change their product lines to meet the unique needs and tastes of consumers in these markets.
Interest in sustainable and renewable energies is rising as worries about climate change become more pressing. This covers synthetic fuels, biofuels, and several fuel substitutes for conventional fossil fuels, a handful of which could need specific dispensing tools.
The table below signifies leading sub-categories under material and dispenser type categories in the global automotive pump and dispenser market. Plastic materials are expected to dominate the market for automotive pumps and dispensers by exhibiting a 5.8% CAGR in the evaluation period. Under the dispenser type category, the push pump dispenser segment is projected to lead the global automotive pump and dispenser market at a 6.2% CAGR.
| Segment | Value CAGR |
|---|---|
| Plastic (Material) | 5.8% |
| Push Pump Dispenser (Dispenser Type) | 6.2% |
Based on material, plastic is expected to surge at a CAGR of 5.8% through 2035. Plastic is suitable for use with several automotive fluids, including fuels, oils, and coolants, owing to its high corrosion-resistant properties.
Plastic pumps and dispensers can withstand exposure to these fluids without deteriorating or causing contamination. The plastic segment is set to establish an added dollar value of USD 1.3 million by 2035.
Based on dispenser type, the push pump dispenser segment is projected to rise at a 6.2% CAGR from 2025 to 2035. Push pump dispensers are set to be user-friendly and convenient to use. As these are designed with features to prevent fuel overfilling and spills, their demand can surge.
Push pump dispensers are durable, compatible, easy to maintain, and provide accurate measurements. Owing to the aforementioned factors, the push pump dispenser segment is estimated to capture a market share of around 44.7% in 2025.
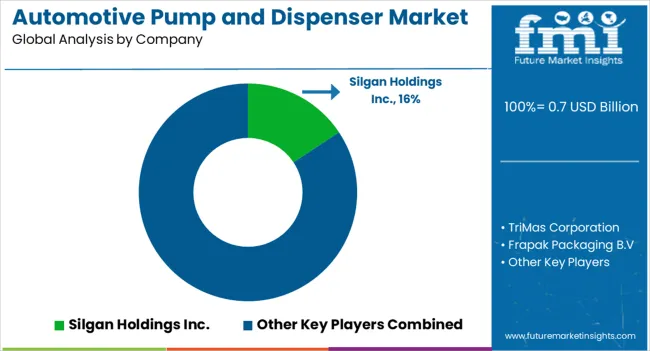
Key players in the field are gaining high shares by developing innovations and advancements in the global automotive pump and dispenser market. Leading players are also seeking to execute the expansion strategy.
Recent Developments Implemented by Leading Players in the Market are
| Attribute | Details |
|---|---|
| Automotive Pump and Dispenser Market Value in 2025 | USD 0.7 billion |
| Automotive Pump and Dispenser Market Forecast Value in 2035 | USD 1.3 billion |
| Growth Rate (2025 to 2035) | 6.0% CAGR |
| Historical Data | 2020 to 2025 |
| Forecast Period | 2025 to 2035 |
| Quantitative Units | Value (USD million) |
| Report Coverage | Revenue Forecast, Volume Forecast, Company Ranking, Competitive Landscape, Growth Factors, Trends and Pricing Analysis |
| Segments Covered | By Dispenser Type, By Material, By Application, By Region |
| Key Companies Profiled | TriMas Corporation; Silgan Holdings Inc.; Frapak Packaging B.V; Prosking Plastic Products Inc.; Richmond Containers CTP Ltd.; Scopenext Ltd.; Tolco Corporation; The Cary Company; Containers Plus; Paramount Global, Inc.; Cormack Packaging; Griot's Garage |
The global automotive pump and dispenser market is estimated to be valued at USD 0.7 billion in 2025.
The market size for the automotive pump and dispenser market is projected to reach USD 1.3 billion by 2035.
The automotive pump and dispenser market is expected to grow at a 6.0% CAGR between 2025 and 2035.
The key product types in automotive pump and dispenser market are push pump dispenser, foam pump dispenser, trigger spray pump, crimp dispenser and mist spray pump.
In terms of material, plastic segment to command 47.6% share in the automotive pump and dispenser market in 2025.


Our Research Products

The "Full Research Suite" delivers actionable market intel, deep dives on markets or technologies, so clients act faster, cut risk, and unlock growth.

The Leaderboard benchmarks and ranks top vendors, classifying them as Established Leaders, Leading Challengers, or Disruptors & Challengers.

Locates where complements amplify value and substitutes erode it, forecasting net impact by horizon

We deliver granular, decision-grade intel: market sizing, 5-year forecasts, pricing, adoption, usage, revenue, and operational KPIs—plus competitor tracking, regulation, and value chains—across 60 countries broadly.

Spot the shifts before they hit your P&L. We track inflection points, adoption curves, pricing moves, and ecosystem plays to show where demand is heading, why it is changing, and what to do next across high-growth markets and disruptive tech

Real-time reads of user behavior. We track shifting priorities, perceptions of today’s and next-gen services, and provider experience, then pace how fast tech moves from trial to adoption, blending buyer, consumer, and channel inputs with social signals (#WhySwitch, #UX).

Partner with our analyst team to build a custom report designed around your business priorities. From analysing market trends to assessing competitors or crafting bespoke datasets, we tailor insights to your needs.
Supplier Intelligence
Discovery & Profiling
Capacity & Footprint
Performance & Risk
Compliance & Governance
Commercial Readiness
Who Supplies Whom
Scorecards & Shortlists
Playbooks & Docs
Category Intelligence
Definition & Scope
Demand & Use Cases
Cost Drivers
Market Structure
Supply Chain Map
Trade & Policy
Operating Norms
Deliverables
Buyer Intelligence
Account Basics
Spend & Scope
Procurement Model
Vendor Requirements
Terms & Policies
Entry Strategy
Pain Points & Triggers
Outputs
Pricing Analysis
Benchmarks
Trends
Should-Cost
Indexation
Landed Cost
Commercial Terms
Deliverables
Brand Analysis
Positioning & Value Prop
Share & Presence
Customer Evidence
Go-to-Market
Digital & Reputation
Compliance & Trust
KPIs & Gaps
Outputs
Full Research Suite comprises of:
Market outlook & trends analysis
Interviews & case studies
Strategic recommendations
Vendor profiles & capabilities analysis
5-year forecasts
8 regions and 60+ country-level data splits
Market segment data splits
12 months of continuous data updates
DELIVERED AS:
PDF EXCEL ONLINE
Automotive Network Testing Market Size and Share Forecast Outlook 2025 to 2035
Automotive Performance Part Market Size and Share Forecast Outlook 2025 to 2035
Automotive Carbon Ceramic Brake Market Size and Share Forecast Outlook 2025 to 2035
Automotive Camshaft Market Size and Share Forecast Outlook 2025 to 2035
Automotive Stamping Industry Analysis in India Size and Share Forecast Outlook 2025 to 2035
Automotive Cylinder Liner Market Size and Share Forecast Outlook 2025 to 2035
Automotive Microcontroller Market Size and Share Forecast Outlook 2025 to 2035
Automotive Roof Rails Market Size and Share Forecast Outlook 2025 to 2035
Automotive Active Safety System Market Size and Share Forecast Outlook 2025 to 2035
Automotive Diagnostic Scan Tool Market Size and Share Forecast Outlook 2025 to 2035
Automotive Test Equipment Market Size and Share Forecast Outlook 2025 to 2035
Automotive Dynamic Map Data Market Size and Share Forecast Outlook 2025 to 2035
Automotive Green Tires Market Size and Share Forecast Outlook 2025 to 2035
Automotive E-Tailing Market Size and Share Forecast Outlook 2025 to 2035
Automotive Interior Market Forecast Outlook 2025 to 2035
Automotive Key Market Size and Share Forecast Outlook 2025 to 2035
Automotive Appearance Chemical Market Forecast and Outlook 2025 to 2035
Automotive Seating Market Forecast and Outlook 2025 to 2035
Automotive Domain Control Module Market Forecast and Outlook 2025 to 2035
Automotive Remote Diagnostic Market Forecast and Outlook 2025 to 2035

Thank you!
You will receive an email from our Business Development Manager. Please be sure to check your SPAM/JUNK folder too.
Chat With
MaRIA