Automatic Identification and Data Capture Market Size and Share Forecast Outlook 2025 to 2035

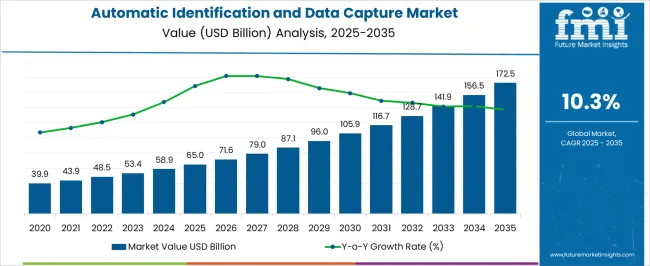
The Automatic Identification and Data Capture Market is estimated to be valued at USD 65.0 billion in 2025 and is projected to reach USD 172.5 billion by 2035, registering a compound annual growth rate (CAGR) of 10.3% over the forecast period.
Quick Stats for Automatic Identification and Data Capture Market

  • Automatic Identification and Data Capture Market Industry Value (2025): USD 65.0 billion
  • Automatic Identification and Data Capture Market Forecast Value (2035): USD 172.5 billion
  • Automatic Identification and Data Capture Market Forecast CAGR: 10.3%
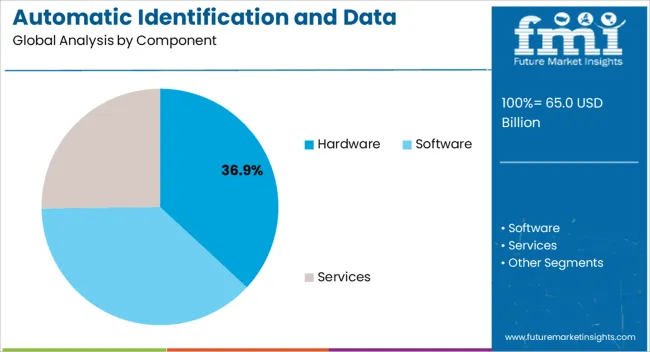
  • Leading Segment in Automatic Identification and Data Capture Market in 2025: Hardware (36.9%)
  • Key Growth Region in Automatic Identification and Data Capture Market: North America, Asia-Pacific, Europe
  • Top Key Players in Automatic Identification and Data Capture Market: RIOTEC Co. Ltd., ZIH Corp., Synaptics Incorporated, CVISION Technologies Inc., SATO Holdings Corporation, Toshiba TEC Corporation

Automatic Identification And Data Capture Market Market Value Analysis

Metric Value
Automatic Identification and Data Capture Market Estimated Value in (2025 E) USD 65.0 billion
Automatic Identification and Data Capture Market Forecast Value in (2035 F) USD 172.5 billion
Forecast CAGR (2025 to 2035) 10.3%

Rationale for Segmental Growth in the Automatic Identification and Data Capture Market

The Automatic Identification and Data Capture market is witnessing significant growth, driven by the increasing need for efficient data collection, tracking, and management across diverse industries. The adoption of barcode scanning, RFID, and other identification technologies is being supported by growing demand for operational efficiency, inventory accuracy, and real-time visibility. Advanced technologies enable rapid and precise data capture, reducing manual errors and improving decision-making processes in logistics, supply chain management, and asset tracking.

Integration with enterprise resource planning and warehouse management systems enhances automation, scalability, and workflow optimization. Regulatory compliance, particularly in retail, healthcare, and manufacturing sectors, is further accelerating adoption, as organizations seek traceability and audit readiness.

Rising demand for contactless and automated solutions is being fueled by the need for faster transactions, improved customer experiences, and enhanced security As enterprises prioritize data-driven operations and digital transformation initiatives, the market is expected to sustain long-term growth, supported by continuous technological innovation, increased adoption across end-use industries, and enhanced connectivity in business operations.
Segmental Analysis

Insights into the Hardware Component Segment

Automatic Identification And Data Capture Market Analysis By Component

The hardware component segment is projected to hold 36.9% of the market revenue in 2025, establishing it as the leading component type. Its growth is being driven by the essential role that physical devices such as scanners, readers, and sensors play in enabling accurate and efficient data capture. These hardware devices provide the foundation for reliable performance in barcode scanning, RFID, and other automatic identification technologies.

Integration with software platforms ensures seamless data processing, storage, and real-time analytics. The rising demand for durable, high-performance hardware capable of supporting high-volume operations has strengthened adoption across retail, logistics, and manufacturing sectors. Advances in sensor technology, miniaturization, and wireless connectivity have enhanced device efficiency and flexibility.

Enterprises are leveraging hardware solutions to reduce manual intervention, minimize errors, and achieve faster operational throughput As demand for automated identification and data capture continues to grow, hardware is expected to maintain its leading position, driven by the need for scalable, reliable, and high-performance devices that support digital transformation initiatives and process optimization across industries.
Insights into the Retail End-User Segment

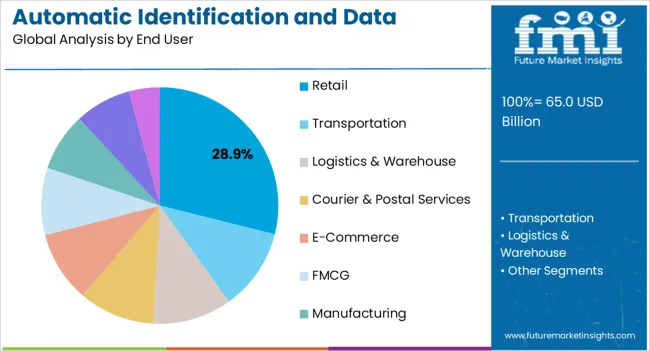
Automatic Identification And Data Capture Market Analysis By End User

The retail end-user segment is anticipated to account for 28.9% of the market revenue in 2025, making it the leading end-use industry. Growth is driven by the need for accurate inventory management, faster checkout processes, and enhanced customer experiences. Automatic identification and data capture technologies enable real-time tracking of products, reduce stockouts, and improve operational efficiency.

Retailers are increasingly adopting barcode scanning, RFID, and IoT-enabled devices to enhance supply chain visibility and streamline store operations. Integration with point-of-sale and inventory management systems supports data-driven decision-making and improved planning. The adoption of contactless and automated solutions is being accelerated by changing consumer expectations for seamless shopping experiences and faster transactions.

Compliance with regulatory standards for product traceability further reinforces the importance of these technologies in retail operations As the retail sector continues to embrace digitalization and operational efficiency initiatives, the segment is expected to remain a primary driver of market growth, supported by technological advancements and increased adoption of automated identification solutions.

Which are Some Prominent Drivers of Automatic Identification and Data Capture Market?

The growing e-commerce industry globally, increasing use of smartphones for QR code scanning and image recognition, and rising adoption of automatic identification and data capture solutions due to their ability to minimize queuing and transaction time and provide greater convenience to users in making small-value payments are the key factors that are anticipated to boost the market growth over the analysis period.

Additionally, the surging adoption of automatic identification and data capture solutions by banking and financial institutions to ensure customer safety and security, along with data privacy are some other factors that are expected to accelerate the growth of the automatic identification and data capture industry during the forecast period.

E-Commerce Industry Augmenting Growth of Automatic Identification and Data Capture

The automatic identification and data capture sector is witnessing a surge, owing to the rise in the use of the e-commerce industry paired with an increase in demand for smartphones, which is expected to propel the growth of the market in the forthcoming years.

The rising adoption of automatic identification and data capture solutions owing to their ability to minimize human error is expected to fuel the growth of the market during the forecast period.

What are the Challenges Faced by the Market?

The high cost associated with the installation of automatic identification and data capture systems is one of the key factors that is expected to impede the growth of the automatic identification and data capture sector during the forecast period. In addition, the rise in concerns about malware attacks and security breaches is projected to challenge the automatic identification and data capture business over the analysis period.

A huge chunk of a retail outlet’s total sale is contributed by low-value products and it is therefore economically unviable to use technologies such as RFIDs and 2D barcodes which are at the base of developments in the Automatic Identification & Data Capture market.

This is true for many other industries too, where the cost of large-scale implementation is hampering the growth of the automatic identification and data capture industry.

Attributes Value
Automatic Identification and Data Capture Market Size (2025) USD 52,910.7 million
Automatic Identification and Data Capture Market Projected Size (2035) USD 147,992.7 million
Automatic Identification and Data Capture Market CAGR (2025 to 2035) 10.8%

2020 to 2024 Automatic Identification and Data Capture Demand Analysis vs Forecast 2025 to 2035

The global demand for automatic identification and data capture is projected to increase at a CAGR of 10.8% during the forecast period, reaching a total of USD 147,992.7 million in 2035, according to a report from Future Market Insights (FMI). From 2020 to 2025, sales witnessed significant growth, registering a CAGR of 10.8%.

Data capturing has become essential to track and trace products of nearly all end-user industries. Not only does this help in analyzing the information about the product but also stores and saves information regarding the purchase of the product along with recording minute details of the same.

Although the COVID-19 pandemic affected the demand for automatic identification and data capture, the increasing sales of consumer products and emerging end-user industries are positively influencing the demand for automatic identification and data capture.

Regional Analysis

Countries Market Share (2025)
United States 16.4%
Germany 9.4%
Japan 4.3%
Australia 5.4%

Awareness Regarding AIDC Devices Contributing to Automatic Identification and Data Capture Sector Growth in North America?

The growth of automatic identification and data capture is largely driven by the increasing awareness and high adoption of AIDC devices, increasing government legislation & investments, particularly in retail, healthcare, and manufacturing industries; it contributes to the technological development of numerous industries in the region.

The region is expected to witness the leading growth during the forecast period, owing to the wide acceptance of advanced technologies in the region. In terms of regional platforms, North America holds the leading market share in the market. The region accumulated a market share of 27.2% in 2025.
Technological Advancements in End User Industries Changing Landscape for Automatic Identification and Data Capture Industry in Europe?

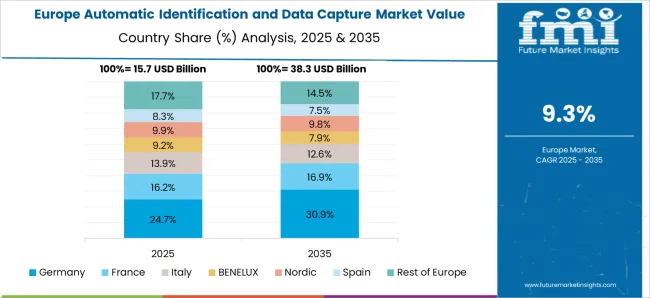
Automatic Identification And Data Capture Market Europe Country Market Share Analysis, 2025 & 2035

Europe expanded with 22.1% share in the market. The region is presently experiencing prominent growth in the barcode, RFID, and biometric technologies in various industries such as retail, manufacturing, transportation & logistics, healthcare, and BFSI. Furthermore, technological advancement and innovation are changing the landscape for automatic identification and data capture in the market in the region.

According to Future Market Insights, Europe is expected to provide immense growth opportunities for automatic identification and data capture and is expected to yield 24.7% revenue in 2025.

Retail and Logistic Companies Key Contributors to Automatic Identification and Data Capture Industry in Asia Pacific?

Countries CAGR (2025 to 2035)
China 8.2%
India 14.3%

Retail and logistics companies are expanding their presence in the Asia Pacific region to capitalize on the increased purchasing power of middle-class people. This, in turn, has led to the growth of automatic identification and data capture in the market in the region.

The significant presence of several market players, such as Panasonic, SATO, Toshiba, Godex, and Optoelectronics in the region is likely to propel the growth of the automatic identification and data capture sector in Asia Pacific. Thus, Asia Pacific is expected to procure a 32% market share for the automatic identification and data capture of the market in 2025.

Increasing need for Data Capturing of Hardware Components Elevating Growth

Hardware segment dominated the market with 44.3% in 2025. The high requirement for hardware components in several automatic identification and data capture products such as barcoding solutions, magnetic stripe cards, smart cards, optical character recognition (OCR) systems, RFID tags, printers and readers, tablets, wearables, VR devices, heads-up display devices, Google Glass, and biometric systems, has contributed to the leading size of the hardware segment.

The increasing sales of these products are contributing to the growth of the hardware component segment.

Start-ups for Automatic Identification and Data Capture Market

Key players in the global automatic identification and data capture sector are Onna, Consilio, Amplitude, ContentSquare, LiveRamp, mParticle and TreasureData
  • ContentSquare, a key player in the automatic identification and data capture sector offers AI-based customer journey analytics software. The platform not only captures data but also analyzes the same for future use.
  • Amplitude, another key player in the automatic identification and data capture industry helps companies to leverage data to drive user growth. The company is focusing on analyzing real-time data and using it to make decisions for the future.

Market Competition

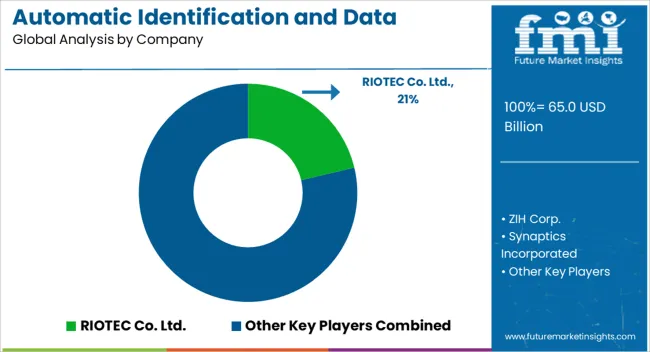
Automatic Identification And Data Capture Market Analysis By Company

Key participants present in the global market are RIOTEC Co. Ltd., Datalogic, ZIH Corp., Synaptics Incorporated, CVISION Technologies Inc., SATO Holdings Corporation, and Toshiba TEC Corporation, among others.

  • In May 2025, Datalogic announced the launch of MATRIX 320 5 MP which read multiple labels and codes in a single acquisition with a single reader. Through these products, the company is focusing on boosting operational capability and gaining higher productivity.
  • RIOTEC Co. Ltd, a key player in the market, is offering a variety of data-capturing products such as pocket, mobile and wearable scanners.

Key Players :

  • RIOTEC Co. Ltd.
  • ZIH Corp.
  • Synaptics Incorporated
  • CVISION Technologies Inc.
  • SATO Holdings Corporation
  • Toshiba TEC Corporation

Key Segments

By Component :

  • Hardware
    • RFID Reader
    • Barcode Scanner
    • Smart Cards
    • Magnetic Ink Character Recognition Devices
    • Optical Character Recognition Devices
    • Biometric Devices
  • Software
  • Services
    • Integration & Installation Services
    • Support & Maintenance Services

By End User :

  • Transportation
  • Logistics & Warehouse
  • Courier & Postal Services
  • Retail
  • E-Commerce
  • FMCG
  • Manufacturing
  • Healthcare
  • Other End Users (Toll Plaza, etc.)

By Region :

  • North America
  • Latin America
  • Europe
  • Asia Pacific
  • Middle East & Africa

Frequently Asked Questions

How big is the automatic identification and data capture market in 2025?

The global automatic identification and data capture market is estimated to be valued at USD 65.0 billion in 2025.

What will be the size of automatic identification and data capture market in 2035?

The market size for the automatic identification and data capture market is projected to reach USD 172.5 billion by 2035.

How much will be the automatic identification and data capture market growth between 2025 and 2035?

The automatic identification and data capture market is expected to grow at a 10.3% CAGR between 2025 and 2035.

What are the key product types in the automatic identification and data capture market?

The key product types in automatic identification and data capture market are hardware, _rfid reader, _barcode scanner, _smart cards, _magnetic ink character recognition devices, _optical character recognition devices, _biometric devices, software, services, _integration & installation services and _support & maintenance services.

Which end user segment to contribute significant share in the automatic identification and data capture market in 2025?

In terms of end user, retail segment to command 28.9% share in the automatic identification and data capture market in 2025.

Table of Content

  1. Executive Summary
    • Global Market Outlook
    • Demand-side Trends
    • Supply-side Trends
    • Technology Roadmap Analysis
    • Analysis and Recommendations
  2. Market Overview
    • Market Coverage / Taxonomy
    • Market Definition / Scope / Limitations
  3. Market Background
    • Market Dynamics
      • Drivers
      • Restraints
      • Opportunity
      • Trends
    • Scenario Forecast
      • Demand in Optimistic Scenario
      • Demand in Likely Scenario
      • Demand in Conservative Scenario
    • Opportunity Map Analysis
    • Product Life Cycle Analysis
    • Supply Chain Analysis
    • Investment Feasibility Matrix
    • Value Chain Analysis
    • PESTLE and Porter’s Analysis
    • Regulatory Landscape
    • Regional Parent Market Outlook
    • Production and Consumption Statistics
    • Import and Export Statistics
  4. Global Market Analysis 2020 to 2024 and Forecast, 2025 to 2035
    • Historical Market Size Value (USD Million) Analysis, 2020 to 2024
    • Current and Future Market Size Value (USD Million) Projections, 2025 to 2035
      • Y-o-Y Growth Trend Analysis
      • Absolute $ Opportunity Analysis
  5. Global Market Pricing Analysis 2020 to 2024 and Forecast 2025 to 2035
  6. Global Market Analysis 2020 to 2024 and Forecast 2025 to 2035, By Component
    • Introduction / Key Findings
    • Historical Market Size Value (USD Million) Analysis By Component , 2020 to 2024
    • Current and Future Market Size Value (USD Million) Analysis and Forecast By Component , 2025 to 2035
      • Hardware
        • RFID Reader
        • Barcode Scanner
        • Smart Cards
        • Magnetic Ink Character Recognition Devices
        • Optical Character Recognition Devices
        • Biometric Devices
      • Software
      • Services
        • Integration & Installation Services
        • Support & Maintenance Services
    • Y-o-Y Growth Trend Analysis By Component , 2020 to 2024
    • Absolute $ Opportunity Analysis By Component , 2025 to 2035
  7. Global Market Analysis 2020 to 2024 and Forecast 2025 to 2035, By End User
    • Introduction / Key Findings
    • Historical Market Size Value (USD Million) Analysis By End User, 2020 to 2024
    • Current and Future Market Size Value (USD Million) Analysis and Forecast By End User, 2025 to 2035
      • Retail
      • Transportation
      • Logistics & Warehouse
      • Courier & Postal Services
      • E-Commerce
      • FMCG
      • Manufacturing
      • Healthcare
      • Other End Users (Toll Plaza, etc.)
    • Y-o-Y Growth Trend Analysis By End User, 2020 to 2024
    • Absolute $ Opportunity Analysis By End User, 2025 to 2035
  8. Global Market Analysis 2020 to 2024 and Forecast 2025 to 2035, By Region
    • Introduction
    • Historical Market Size Value (USD Million) Analysis By Region, 2020 to 2024
    • Current Market Size Value (USD Million) Analysis and Forecast By Region, 2025 to 2035
      • North America
      • Latin America
      • Western Europe
      • Eastern Europe
      • East Asia
      • South Asia and Pacific
      • Middle East & Africa
    • Market Attractiveness Analysis By Region
  9. North America Market Analysis 2020 to 2024 and Forecast 2025 to 2035, By Country
    • Historical Market Size Value (USD Million) Trend Analysis By Market Taxonomy, 2020 to 2024
    • Market Size Value (USD Million) Forecast By Market Taxonomy, 2025 to 2035
      • By Country
        • USA
        • Canada
        • Mexico
      • By Component
      • By End User
    • Market Attractiveness Analysis
      • By Country
      • By Component
      • By End User
    • Key Takeaways
  10. Latin America Market Analysis 2020 to 2024 and Forecast 2025 to 2035, By Country
    • Historical Market Size Value (USD Million) Trend Analysis By Market Taxonomy, 2020 to 2024
    • Market Size Value (USD Million) Forecast By Market Taxonomy, 2025 to 2035
      • By Country
        • Brazil
        • Chile
        • Rest of Latin America
      • By Component
      • By End User
    • Market Attractiveness Analysis
      • By Country
      • By Component
      • By End User
    • Key Takeaways
  11. Western Europe Market Analysis 2020 to 2024 and Forecast 2025 to 2035, By Country
    • Historical Market Size Value (USD Million) Trend Analysis By Market Taxonomy, 2020 to 2024
    • Market Size Value (USD Million) Forecast By Market Taxonomy, 2025 to 2035
      • By Country
        • Germany
        • UK
        • Italy
        • Spain
        • France
        • Nordic
        • BENELUX
        • Rest of Western Europe
      • By Component
      • By End User
    • Market Attractiveness Analysis
      • By Country
      • By Component
      • By End User
    • Key Takeaways
  12. Eastern Europe Market Analysis 2020 to 2024 and Forecast 2025 to 2035, By Country
    • Historical Market Size Value (USD Million) Trend Analysis By Market Taxonomy, 2020 to 2024
    • Market Size Value (USD Million) Forecast By Market Taxonomy, 2025 to 2035
      • By Country
        • Russia
        • Poland
        • Hungary
        • Balkan & Baltic
        • Rest of Eastern Europe
      • By Component
      • By End User
    • Market Attractiveness Analysis
      • By Country
      • By Component
      • By End User
    • Key Takeaways
  13. East Asia Market Analysis 2020 to 2024 and Forecast 2025 to 2035, By Country
    • Historical Market Size Value (USD Million) Trend Analysis By Market Taxonomy, 2020 to 2024
    • Market Size Value (USD Million) Forecast By Market Taxonomy, 2025 to 2035
      • By Country
        • China
        • Japan
        • South Korea
      • By Component
      • By End User
    • Market Attractiveness Analysis
      • By Country
      • By Component
      • By End User
    • Key Takeaways
  14. South Asia and Pacific Market Analysis 2020 to 2024 and Forecast 2025 to 2035, By Country
    • Historical Market Size Value (USD Million) Trend Analysis By Market Taxonomy, 2020 to 2024
    • Market Size Value (USD Million) Forecast By Market Taxonomy, 2025 to 2035
      • By Country
        • India
        • ASEAN
        • Australia & New Zealand
        • Rest of South Asia and Pacific
      • By Component
      • By End User
    • Market Attractiveness Analysis
      • By Country
      • By Component
      • By End User
    • Key Takeaways
  15. Middle East & Africa Market Analysis 2020 to 2024 and Forecast 2025 to 2035, By Country
    • Historical Market Size Value (USD Million) Trend Analysis By Market Taxonomy, 2020 to 2024
    • Market Size Value (USD Million) Forecast By Market Taxonomy, 2025 to 2035
      • By Country
        • Kingdom of Saudi Arabia
        • Other GCC Countries
        • Turkiye
        • South Africa
        • Other African Union
        • Rest of Middle East & Africa
      • By Component
      • By End User
    • Market Attractiveness Analysis
      • By Country
      • By Component
      • By End User
    • Key Takeaways
  16. Key Countries Market Analysis
    • USA
      • Pricing Analysis
      • Market Share Analysis, 2024
        • By Component
        • By End User
    • Canada
      • Pricing Analysis
      • Market Share Analysis, 2024
        • By Component
        • By End User
    • Mexico
      • Pricing Analysis
      • Market Share Analysis, 2024
        • By Component
        • By End User
    • Brazil
      • Pricing Analysis
      • Market Share Analysis, 2024
        • By Component
        • By End User
    • Chile
      • Pricing Analysis
      • Market Share Analysis, 2024
        • By Component
        • By End User
    • Germany
      • Pricing Analysis
      • Market Share Analysis, 2024
        • By Component
        • By End User
    • UK
      • Pricing Analysis
      • Market Share Analysis, 2024
        • By Component
        • By End User
    • Italy
      • Pricing Analysis
      • Market Share Analysis, 2024
        • By Component
        • By End User
    • Spain
      • Pricing Analysis
      • Market Share Analysis, 2024
        • By Component
        • By End User
    • France
      • Pricing Analysis
      • Market Share Analysis, 2024
        • By Component
        • By End User
    • India
      • Pricing Analysis
      • Market Share Analysis, 2024
        • By Component
        • By End User
    • ASEAN
      • Pricing Analysis
      • Market Share Analysis, 2024
        • By Component
        • By End User
    • Australia & New Zealand
      • Pricing Analysis
      • Market Share Analysis, 2024
        • By Component
        • By End User
    • China
      • Pricing Analysis
      • Market Share Analysis, 2024
        • By Component
        • By End User
    • Japan
      • Pricing Analysis
      • Market Share Analysis, 2024
        • By Component
        • By End User
    • South Korea
      • Pricing Analysis
      • Market Share Analysis, 2024
        • By Component
        • By End User
    • Russia
      • Pricing Analysis
      • Market Share Analysis, 2024
        • By Component
        • By End User
    • Poland
      • Pricing Analysis
      • Market Share Analysis, 2024
        • By Component
        • By End User
    • Hungary
      • Pricing Analysis
      • Market Share Analysis, 2024
        • By Component
        • By End User
    • Kingdom of Saudi Arabia
      • Pricing Analysis
      • Market Share Analysis, 2024
        • By Component
        • By End User
    • Turkiye
      • Pricing Analysis
      • Market Share Analysis, 2024
        • By Component
        • By End User
    • South Africa
      • Pricing Analysis
      • Market Share Analysis, 2024
        • By Component
        • By End User
  17. Market Structure Analysis
    • Competition Dashboard
    • Competition Benchmarking
    • Market Share Analysis of Top Players
      • By Regional
      • By Component
      • By End User
  18. Competition Analysis
    • Competition Deep Dive
      • RIOTEC Co. Ltd.
        • Overview
        • Product Portfolio
        • Profitability by Market Segments (Product/Age /Sales Channel/Region)
        • Sales Footprint
        • Strategy Overview
          • Marketing Strategy
          • Product Strategy
          • Channel Strategy
      • ZIH Corp.
      • Synaptics Incorporated
      • CVISION Technologies Inc.
      • SATO Holdings Corporation
      • Toshiba TEC Corporation
  19. Assumptions & Acronyms Used
  20. Research Methodology

List of Tables

  • Table 1: Global Market Value (USD Million) Forecast by Region, 2020 to 2035
  • Table 2: Global Market Value (USD Million) Forecast by Component , 2020 to 2035
  • Table 3: Global Market Value (USD Million) Forecast by End User, 2020 to 2035
  • Table 4: North America Market Value (USD Million) Forecast by Country, 2020 to 2035
  • Table 5: North America Market Value (USD Million) Forecast by Component , 2020 to 2035
  • Table 6: North America Market Value (USD Million) Forecast by End User, 2020 to 2035
  • Table 7: Latin America Market Value (USD Million) Forecast by Country, 2020 to 2035
  • Table 8: Latin America Market Value (USD Million) Forecast by Component , 2020 to 2035
  • Table 9: Latin America Market Value (USD Million) Forecast by End User, 2020 to 2035
  • Table 10: Western Europe Market Value (USD Million) Forecast by Country, 2020 to 2035
  • Table 11: Western Europe Market Value (USD Million) Forecast by Component , 2020 to 2035
  • Table 12: Western Europe Market Value (USD Million) Forecast by End User, 2020 to 2035
  • Table 13: Eastern Europe Market Value (USD Million) Forecast by Country, 2020 to 2035
  • Table 14: Eastern Europe Market Value (USD Million) Forecast by Component , 2020 to 2035
  • Table 15: Eastern Europe Market Value (USD Million) Forecast by End User, 2020 to 2035
  • Table 16: East Asia Market Value (USD Million) Forecast by Country, 2020 to 2035
  • Table 17: East Asia Market Value (USD Million) Forecast by Component , 2020 to 2035
  • Table 18: East Asia Market Value (USD Million) Forecast by End User, 2020 to 2035
  • Table 19: South Asia and Pacific Market Value (USD Million) Forecast by Country, 2020 to 2035
  • Table 20: South Asia and Pacific Market Value (USD Million) Forecast by Component , 2020 to 2035
  • Table 21: South Asia and Pacific Market Value (USD Million) Forecast by End User, 2020 to 2035
  • Table 22: Middle East & Africa Market Value (USD Million) Forecast by Country, 2020 to 2035
  • Table 23: Middle East & Africa Market Value (USD Million) Forecast by Component , 2020 to 2035
  • Table 24: Middle East & Africa Market Value (USD Million) Forecast by End User, 2020 to 2035

List of Figures

  • Figure 1: Global Market Pricing Analysis
  • Figure 2: Global Market Value (USD Million) Forecast 2020-2035
  • Figure 3: Global Market Value Share and BPS Analysis by Component , 2025 and 2035
  • Figure 4: Global Market Y-o-Y Growth Comparison by Component , 2025-2035
  • Figure 5: Global Market Attractiveness Analysis by Component
  • Figure 6: Global Market Value Share and BPS Analysis by End User, 2025 and 2035
  • Figure 7: Global Market Y-o-Y Growth Comparison by End User, 2025-2035
  • Figure 8: Global Market Attractiveness Analysis by End User
  • Figure 9: Global Market Value (USD Million) Share and BPS Analysis by Region, 2025 and 2035
  • Figure 10: Global Market Y-o-Y Growth Comparison by Region, 2025-2035
  • Figure 11: Global Market Attractiveness Analysis by Region
  • Figure 12: North America Market Incremental Dollar Opportunity, 2025-2035
  • Figure 13: Latin America Market Incremental Dollar Opportunity, 2025-2035
  • Figure 14: Western Europe Market Incremental Dollar Opportunity, 2025-2035
  • Figure 15: Eastern Europe Market Incremental Dollar Opportunity, 2025-2035
  • Figure 16: East Asia Market Incremental Dollar Opportunity, 2025-2035
  • Figure 17: South Asia and Pacific Market Incremental Dollar Opportunity, 2025-2035
  • Figure 18: Middle East & Africa Market Incremental Dollar Opportunity, 2025-2035
  • Figure 19: North America Market Value Share and BPS Analysis by Country, 2025 and 2035
  • Figure 20: North America Market Value Share and BPS Analysis by Component , 2025 and 2035
  • Figure 21: North America Market Y-o-Y Growth Comparison by Component , 2025-2035
  • Figure 22: North America Market Attractiveness Analysis by Component
  • Figure 23: North America Market Value Share and BPS Analysis by End User, 2025 and 2035
  • Figure 24: North America Market Y-o-Y Growth Comparison by End User, 2025-2035
  • Figure 25: North America Market Attractiveness Analysis by End User
  • Figure 26: Latin America Market Value Share and BPS Analysis by Country, 2025 and 2035
  • Figure 27: Latin America Market Value Share and BPS Analysis by Component , 2025 and 2035
  • Figure 28: Latin America Market Y-o-Y Growth Comparison by Component , 2025-2035
  • Figure 29: Latin America Market Attractiveness Analysis by Component
  • Figure 30: Latin America Market Value Share and BPS Analysis by End User, 2025 and 2035
  • Figure 31: Latin America Market Y-o-Y Growth Comparison by End User, 2025-2035
  • Figure 32: Latin America Market Attractiveness Analysis by End User
  • Figure 33: Western Europe Market Value Share and BPS Analysis by Country, 2025 and 2035
  • Figure 34: Western Europe Market Value Share and BPS Analysis by Component , 2025 and 2035
  • Figure 35: Western Europe Market Y-o-Y Growth Comparison by Component , 2025-2035
  • Figure 36: Western Europe Market Attractiveness Analysis by Component
  • Figure 37: Western Europe Market Value Share and BPS Analysis by End User, 2025 and 2035
  • Figure 38: Western Europe Market Y-o-Y Growth Comparison by End User, 2025-2035
  • Figure 39: Western Europe Market Attractiveness Analysis by End User
  • Figure 40: Eastern Europe Market Value Share and BPS Analysis by Country, 2025 and 2035
  • Figure 41: Eastern Europe Market Value Share and BPS Analysis by Component , 2025 and 2035
  • Figure 42: Eastern Europe Market Y-o-Y Growth Comparison by Component , 2025-2035
  • Figure 43: Eastern Europe Market Attractiveness Analysis by Component
  • Figure 44: Eastern Europe Market Value Share and BPS Analysis by End User, 2025 and 2035
  • Figure 45: Eastern Europe Market Y-o-Y Growth Comparison by End User, 2025-2035
  • Figure 46: Eastern Europe Market Attractiveness Analysis by End User
  • Figure 47: East Asia Market Value Share and BPS Analysis by Country, 2025 and 2035
  • Figure 48: East Asia Market Value Share and BPS Analysis by Component , 2025 and 2035
  • Figure 49: East Asia Market Y-o-Y Growth Comparison by Component , 2025-2035
  • Figure 50: East Asia Market Attractiveness Analysis by Component
  • Figure 51: East Asia Market Value Share and BPS Analysis by End User, 2025 and 2035
  • Figure 52: East Asia Market Y-o-Y Growth Comparison by End User, 2025-2035
  • Figure 53: East Asia Market Attractiveness Analysis by End User
  • Figure 54: South Asia and Pacific Market Value Share and BPS Analysis by Country, 2025 and 2035
  • Figure 55: South Asia and Pacific Market Value Share and BPS Analysis by Component , 2025 and 2035
  • Figure 56: South Asia and Pacific Market Y-o-Y Growth Comparison by Component , 2025-2035
  • Figure 57: South Asia and Pacific Market Attractiveness Analysis by Component
  • Figure 58: South Asia and Pacific Market Value Share and BPS Analysis by End User, 2025 and 2035
  • Figure 59: South Asia and Pacific Market Y-o-Y Growth Comparison by End User, 2025-2035
  • Figure 60: South Asia and Pacific Market Attractiveness Analysis by End User
  • Figure 61: Middle East & Africa Market Value Share and BPS Analysis by Country, 2025 and 2035
  • Figure 62: Middle East & Africa Market Value Share and BPS Analysis by Component , 2025 and 2035
  • Figure 63: Middle East & Africa Market Y-o-Y Growth Comparison by Component , 2025-2035
  • Figure 64: Middle East & Africa Market Attractiveness Analysis by Component
  • Figure 65: Middle East & Africa Market Value Share and BPS Analysis by End User, 2025 and 2035
  • Figure 66: Middle East & Africa Market Y-o-Y Growth Comparison by End User, 2025-2035
  • Figure 67: Middle East & Africa Market Attractiveness Analysis by End User
  • Figure 68: Global Market - Tier Structure Analysis
  • Figure 69: Global Market - Company Share Analysis
Dashboard
Dashboard
Dashboard
Dashboard
Dashboard
Dashboard

Full Research Suite comprises of:

Market outlook & trends analysis

Market outlook & trends analysis

Interviews & case studies

Interviews & case studies

Strategic recommendations

Strategic recommendations

Vendor profiles & capabilities analysis

Vendor profiles & capabilities analysis

5-year forecasts

5-year forecasts

8 regions and 60+ country-level data splits

8 regions and 60+ country-level data splits

Market segment data splits

Market segment data splits

12 months of continuous data updates

12 months of continuous data updates

DELIVERED AS:

PDF EXCEL ONLINE

Full Research Suite


$5000

$7500

$10000

Buy Report Now
Similar Industry Reports

Similar Industry Reports

Automatic Weigh Price Labeling Machine Market

Automatic Weigh Price Labeling Machine Market Size and Share Forecast Outlook 2025 to 2035

Automatic Bending Machine Market

Automatic Bending Machine Market Size and Share Forecast Outlook 2025 to 2035

Automatic Transmission Market

Automatic Transmission Market Size and Share Forecast Outlook 2025 to 2035

Automatic Emergency Braking System Market

Automatic Emergency Braking System Market Size and Share Forecast Outlook 2025 to 2035

Automatic Impact Testing Machine Market

Automatic Impact Testing Machine Market Size and Share Forecast Outlook 2025 to 2035

Automatic Glue Machine Market

Automatic Glue Machine Market Size and Share Forecast Outlook 2025 to 2035

Automatic Floodgate Market

Automatic Floodgate Market Size and Share Forecast Outlook 2025 to 2035

Automatic Die Cutting Machines Market

Automatic Die Cutting Machines Market Size and Share Forecast Outlook 2025 to 2035

Automatic Dependent Surveillance-Broadcast (ADS-B) System Market

Automatic Dependent Surveillance-Broadcast (ADS-B) System Market Size and Share Forecast Outlook 2025 to 2035

Automatic Silver Sintering Die Attach Machine Market

Automatic Silver Sintering Die Attach Machine Market Size and Share Forecast Outlook 2025 to 2035

Automatic Emergency Braking (AEB) Market

Automatic Emergency Braking (AEB) Market Size and Share Forecast Outlook 2025 to 2035

Automatic Transfer Switch Market

Automatic Transfer Switch Market Size and Share Forecast Outlook 2025 to 2035

Automatic Weapons Market

Automatic Weapons Market Size and Share Forecast Outlook 2025 to 2035

Automatic Bottle Opener Market

Automatic Bottle Opener Market Size and Share Forecast Outlook 2025 to 2035

Automatic Hog Feeder Market

Automatic Hog Feeder Market Size and Share Forecast Outlook 2025 to 2035

Automatic Goat Waterer Market

Automatic Goat Waterer Market Size and Share Forecast Outlook 2025 to 2035

Automatic Wine Dispensers Market

Automatic Wine Dispensers Market Size and Share Forecast Outlook 2025 to 2035

Automatic Content Recognition Market

Automatic Content Recognition Market Size and Share Forecast Outlook 2025 to 2035

Automatic Coffee Machine Market

Automatic Coffee Machine Market Analysis – Size, Share & Forecast 2025 to 2035

Automatic Dishwasher Market

Automatic Dishwasher Market Size and Share Forecast Outlook 2025 to 2035

Future Market Insights

Automatic Identification and Data Capture Market

Chat With MaRIA

Chat With

MaRIA

Hi There, I am MaRIA, Your Market Research Intelligence Assistant. How may I help you?