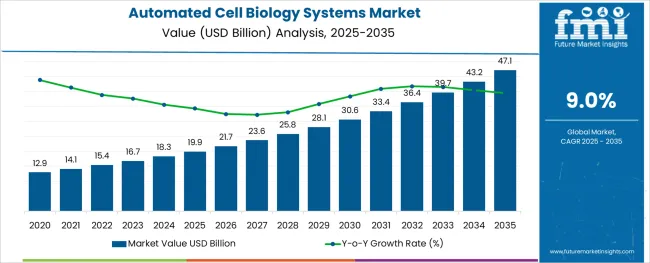
Automated Cell Biology Systems Market Snapshot (2022 to 2032)

By the end of 2022, the global automated cell biology systems market is anticipated to be worth US$ 14.1 Billion, and it will grow at a CAGR of 9.0% to reach an expected valuation of around US$ 33.5 Billion by the year 2032. Infinite cell line cultures dominate the worldwide market in 2021, with a share of around 76.2%, according to a recent analysis by Future Market Insights.

Market Outlook:

Data Points Market Insights
Market Value 2022 US$ 14.1 Billion
Market Value 2032 US$ 33.5 Billion
CAGR 2022 to 2032 9.0%
Market Share of Top 5 Countries 62.3%
Key Market Players Thermo Fisher Scientific, Corning Incorporated, Merck KGaA, Lonza, Sartorius AG, Hitachi. Ltd, Nanoentek, ChemoMetec, Danaher Corporation, Agilent Technologies, Perkin Elmer (Nexcelom Bioscience LLC.), F. Hoffmann-La Roche AG, SHIMADZU CORPORATION, Bio-Rad Laboratories, Miltenyi Biotec, Sinfonia Technology, SHIBUYA CORPORATION, Advanced Instruments, Cell Culture Company, LLC, BD, and Hamilton Company

Compared to the widespread methods utilized in the second half of the twentieth century, modern cell cultivation techniques are not significantly different. Despite the fact that these techniques made it possible to comprehend a variety of biological processes and that they served as determining factors for applications like drug testing and tissue regeneration, they had a number of inherent drawbacks. In actuality, conventional cell culture systems necessitate numerous and intricate manual handling techniques, which restricts the consistency of the cultivation in terms of cell yield and activity.

Additionally, long-term cell maintenance is costly, time-consuming, and demands a lot of reagents, test samples, and work. By reducing the number of operator interventions, the shift to user-friendly automated devices would favor standardizing the cultivation process, cutting production costs, and shortening the time required for cell culture preparation, thus promoting market growth for automated cell biology systems.

Don't pay for what you don't need

Customize your report by selecting specific countries or regions and save 30%!

Sales Analysis of Automated Cell Biology Systems Market from 2015 to 2021 Vs Market Outlook for 2022 to 2032

The market value for automated cell biology systems was approximately 65.8% of the overall ~US$ 19.9 Billion global bioprocess technology market in 2021.

The sale of automated cell biology systems expanded at a CAGR of 6.6% from 2015 to 2021.

Technologies like microfluidics and lab-on-a-chip represent a strategic approach to support the shift to user-friendly automated equipment. By using microculture systems in place of conventional Petri plates and flasks for cellular tests, researchers have been able to minimize the number of reagents used while still achieving high-throughput cell generation and culture in a controlled setting.

The development of tissue engineering aims to increase the possibility of replacing tissue development for regenerating or restoring organ and tissue function. Tissue engineering technology has advanced significantly in recent years, and it is now widely used in domains other than medicine, such as organs-on-a-chip, bioelectronic devices, cultured meats, and so on.

Cell culture is the primary method used for tissue engineering manufacturing. Therefore, it is crucial for tissue engineering research to maintain high standards for cell culture settings.

Modern uses of analytical system automation include clinical, pharmacological, and biomedical environments. The automatic system has played a significant role in both qualitative and quantitative analysis. Optically driven, electrochemical, and mass spectroscopic approaches have all been used as analytical techniques. Robotic automation lowers the cost of analysis while providing high precision and high system throughput.

Numerous lab-on-chip advancements have been made for cell culture and certain other biomedical applications. A cell culture device indicates the viability of the cells, nutrient consumption, nutrient output in the fermentation process, and pharmacological effect.

Because of the aforementioned factors, it is anticipated that from 2022 to 2032, the global automated cell biology systems market will expand at a CAGR of 9.0%.

What are the Major Opportunities in the Global Automated Cell Biology Systems Market?

As automated cell culture, on-chip is widely acknowledged as a benchmark parameter in existing microfluidic systems for cell biology, and a plethora of studies have been documented in the literature. At the research laboratory level, the minimization and downsizing of additional peripheral equipment are considered a fundamental necessity for the utilization of automated devices in cell culture, coupled with the need for systems that are ready-to-use in a plug-and-play mode.

Currently, the use of micro-devices for fluidic control is limited to the use of relatively complicated, specialized, and bulky external equipment and macro-to-micro interface systems, necessitating the ongoing assistance of human operators to manage fluid flow in an unstandardized and manual manner.

The systematic application of a suitably integrated control system for accurate fluid handling in a remote control framework will significantly improve the usability and readout dependability of micro-bioreactors. This is crucial in automating cell culture techniques, reducing human involvement, and significantly lowering the number of connection tubes, intake and output ports, and bulky external equipment.

The adoption of such control systems is gaining traction, owing to the above-mentioned factors, and this is set to pose lucrative opportunities for growth within the global automated cell biology systems market during the forecasted years.

Sabyasachi Ghosh
Sabyasachi Ghosh

Principal Consultant

Talk to Analyst

Find your sweet spots for generating winning opportunities in this market.

What are the Factors Limiting Demand for Automated Cell Biology Systems?

Cell-based therapies have the ability to provide a successful treatment for medical disorders that are presently incurable. Their widespread commercialization has been put at risk by constraints such as scaling up and automating labor-intensive research discoveries, high production costs, and batch variance in large-scale automated manufacturing.

Additionally, even though many cell culture labs employ automated tools to do away with manual duties like handling plates, highly-trained lab staff are still required to spend hours every day maintaining these devices. As a result, the majority of benchtop automation has limitations in terms of scaling in cell culture facilities.

Furthermore, the utilization of mammalian cell culture is quickly expanding. Even though the fundamental processes for sustaining cells are quite repeatable, the majority of cell culture operations are still done by hand.

Personnel is required to perform repetitive tasks for hours on end each day, and frequently they must come in after regular working hours to cater to the cells or modify their biology to accommodate the workload. Both the workflow's throughput and its ability to be tracked are limited by this dependence on manual steps.

With the above-mentioned factors, the market for automated cell biology systems experiences a restraint in growth.
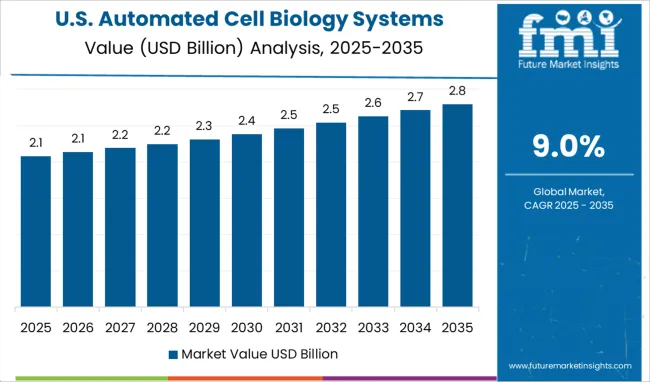
Country-wise Insights

What Makes the USA a Large Market for Automated Cell Biology Systems?

With a market share of 89.8% in all of North America in 2021, the USA presently dominates the region and is expected to sustain this growth throughout the forecast period.

The increasing expenditure on Research and Development in the area can be attributed to the market's expansion. Additionally, the expansion of pharmaceutical firms and manufacturers in the area together with rising public awareness of stem cell therapy is anticipated to significantly contribute to the market's expansion. Additionally, it is predicted that the rising number of bone marrow and cord blood transplants across the region will favorably influence market growth.

What Makes China a Highly Lucrative Market for Automated Cell Biology Systems?

China represents roughly 64.9% of the East Asia market in 2021, with growth at a lucrative CAGR of 13.7% throughout the forecast period. China has a significant demand for automation, according to the International Federation of Robotics (IFR). According to sales volume, China was one of the top five markets for industrial robots in 2015.

The China Robot Industry Alliance estimates that Chinese robot suppliers sold about 20,400 units in 2015, increasing their share of the global market from 25% to 29% from 2013 until 2015. With the growing wave in automation, as well as its adoption, China is posed to be a highly lucrative market for automated cell biology systems over the forecast period.

What is the Outlook of Germany in the Automated Cell Biology Systems Market?

During the forecast years, Germany is projected to grow at a CAGR of nearly 7.2% in the global automated cell biology systems market. The European Medicinal Agency (EMA) granted the CliniMACS Prodigy platform approval for the commercial manufacturing process in 2018 for the customization of protocols, which is accomplished through modularity and flexible programming, allowing its use for a number of different cell types, including the development of CAR-T cells, macrophages, virus-specific T-cells, and dendritic cells. With the manufacturing of such capable platforms, Germany is set to aid with the growth of the overall market during the projected period.

Get the data you need at a Fraction of the cost

Personalize your report by choosing insights you need
and save 40%!

Category-wise Insights

Which Product is Widely Adopted within the Global Automated Cell Biology Systems Market?

Automated cell counters (single function) are the leading segment as a product, hold approximately 34.6% market share in 2021, and are expected to present high growth at a CAGR of 8.1% throughout the forecast period. The benefit of using an automated cell counter is that it largely eliminates human bias from the cell counting process. They can count more cells and are frequently faster than manually counting, which improves statistical accuracy. Automated cell counters are also employed in research and clinical labs. They can be used on urine and blood samples to count the different cell types present or to evaluate the viability of a cultivated cell line for investigation.

Which Cell Cultures are Largely in Focus within the Automated Cell Biology Systems Market?

Infinite cell line cultures hold a global market share of around 76.2%, in 2021. Infinite cell line cultures are more robust and convenient to work with than primary cells since they can reproduce indefinitely. Infinite cell line cultures are also convenient for researchers because they are less expensive, easier to use, and able to survive more stages than primary cells. Because cell lines have a limitless supply of material and are simple to alter and grow, they are preferred for multiple screenings.

Which Application of Automated Cell Biology Systems is Widely Taken over Globally?

Drug development holds a share of around 35.4% in 2021, and this segment is expected to display gradual growth over the forecast period. New scientific developments in basic research, drug development, drug discovery, and customized medicine applications are being driven by 3D cell cultures. To understand the full potential of the technology, researchers can operate more efficiently with complex reagents and precious cells with the aid of high throughput, automated liquid handling solutions.

How are Biopharmaceutical Companies Major End Users for Automated Cell Biology Systems?

Biopharmaceutical companies hold the highest market share value of 27.4% during the year 2021. Growing drug development activities propelled by the rising demand for personalized medicine will propel this segment in terms of growth during the projected years. With the standardization of laboratory protocols, as well as the utilization of automated systems for process control technologies during the production process, this segment gains a higher share among the rest of the end users within the global market.
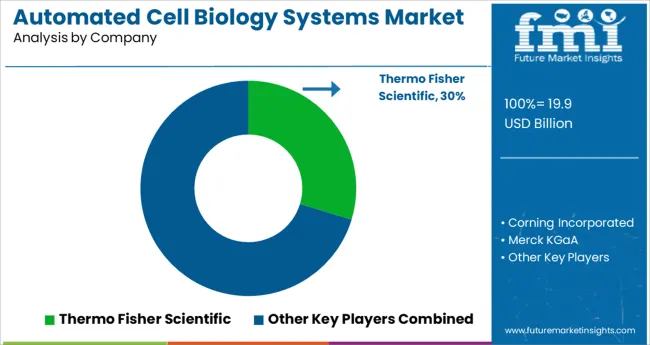
Competitive Landscape

Key players in the market present novel solutions for the lab automation processes for cell biology systems. Moreover, with increasing approvals from the regulatory authorities for software-based total lab automation systems, the key players are presented with an opportunistic outlook for growth during the forecast period.

  • Thermo Fisher launched a closed and automated cell isolation and bead removal solution in October 2022 to aid in the advancement of cell therapy manufacturing.
  • By purchasing Lonza's MAST® Platform, a prominent automated bioreactor sampling system, in April 2022, Merck will advance bioprocessing capabilities.

Similarly, recent developments related to companies manufacturing automated cell biology systems have been tracked by the team at Future Market Insights, which are available in the full report.

Report Scope as per Automated Cell Biology Systems Industry Analysis

Attribute Details
Forecast Period 2022 to 2032
Historical Data Available for 2015 to 2021
Market Analysis US$ Billion for Value
Key Regions Covered North America, Latin America, Europe, South Asia, East Asia, Oceania, and Middle East & Africa
Key Countries Covered USA, Canada, Brazil, Mexico, Argentina, United Kingdom, Germany, Italy, Russia, Spain, France, BENELUX, India, Thailand, Indonesia, Malaysia, Japan, China, South Korea, Australia, New Zealand, Turkey, GCC Countries, North Africa, and South Africa
Key Market Segments Covered Product, Cell Culture, Application, End User, and Region
Key Companies Profiled
  • Thermo Fisher Scientific
  • Corning Incorporated
  • Merck KGaA
  • Lonza
  • Sartorius AG
  • Hitachi. Ltd
  • Nanoentek
  • ChemoMetec
  • Danaher corporation
  • Agilent Technologies
  • Perkin Elmer (Nexcelom Bioscience LLC.)
  • F. Hoffmann-La Roche AG
  • SHIMADZU CORPORATION
  • Bio-Rad Laboratories
  • Miltenyi Biotec
  • Sinfonia Technology
  • SHIBUYA CORPORATION
  • Advanced Instruments
  • Cell Culture Company, LLC
  • BD
  • Hamilton Company
Pricing Available upon Request

Key Market Segments Covered in Automated Cell Biology Systems Industry Research

By Product:

  • Cell Culture Process Automatization Instrument or Robot (Multiple Function)
  • Automated Bioreactor (Single or Multiple Function)
  • Automated Cell Culture Media Exchange System (Single Function)
  • Automated Culture Media Analyzer (Single Function)
  • Automated Cell Wash-and-Concentrate System (Single Function)
  • Automated Cell Counter (Single Function)
  • Automated Fill And Finish System (Single Function)
  • Automated Cell Storage Equipment (Single Function)
  • Management Software

By Cell Culture:

  • Finite Cell Line Cultures
  • Infinite Cell Line Cultures

By Application:

  • Cell Therapy
  • Drug Development
  • Stem Cell Research
  • Regenerative Medicine

By End User:

  • Mega Pharmaceutical companies
  • Biopharmaceutical companies
  • CDMOs/CMOs
  • Research organizations
  • Academic institutes

By Region:

  • North America
  • Latin America
  • Europe
  • South Asia
  • East Asia
  • Oceania
  • Middle East and Africa (MEA)

Frequently Asked Questions

How much is the Automated Cell Biology Systems Market estimated worth in 2022?

The global automated cell biology systems market stands at US$ 14.1 Billion in 2022 and is set to expand 2.4X over the next ten years.

What is the sales forecast for automated cell biology systems through 2032?

The automated cell biology systems market is expected to reach US$ 33.5 Billion by end of 2032 at a CAGR of 9.0%.

What are the trends driving the demand outlook of the global automated cell biology systems market?

The growing geriatric population, the rising burden of chronic and infectious diseases, and rising Research and Development on novel biopharmaceuticals are some of the key trends in this market.

Which region has the highest market share in the global automated cell biology systems market?

By region, North America holds the highest market share of around 37.4% by value, in 2021, in the global automated cell biology systems market.

How likely is the automated cell biology systems market to grow in Europe?

Europe is projected to grow with a CAGR of 7.5% during the forecast period.

Which are the top five countries driving demand for automated cell biology systems market?

The USA, Germany, India, China, and the United Kingdom are the top five countries, which are expected to drive demand in the automated cell biology systems market.

Who are the key manufacturers in the automated cell biology systems market?

Thermo Fisher Scientific, Corning Incorporated, Merck KGaA, Lonza, Sartorius AG, Hitachi. Ltd, Nanoentek, ChemoMetec, Danaher Corporation, Agilent Technologies, Perkin Elmer (Nexcelom Bioscience LLC.), F. Hoffmann-La Roche AG, SHIMADZU CORPORATION, Bio-Rad Laboratories, Miltenyi Biotec, Sinfonia Technology, SHIBUYA CORPORATION, Advanced Instruments, Cell Culture Company, LLC, BD, and Hamilton Company, are some of the key players in the automated cell biology systems industry.

What was the last 6 years’ CAGR value growth for the automated cell biology systems market?

From 2015 to 2021, the market for automated cell biology systems expanded at the rate of 6.6% CAGR.

What are the key market statistics for South Asia in the automated cell biology systems market?

The automated cell biology systems market in South Asia is expected to grow at 12.3% CAGR during the forecast period.

What is the outlook of East Asia in the automated cell biology systems market?

East Asia is set to present lucrative growth at a CAGR of 13.1% during the forecasted years.

Table of Content

1. Executive Summary | Automated Cell Biology Systems Market

    1.1. Global Market Outlook

    1.2. Demand Side Trends

    1.3. Supply Side Trends

    1.4. Analysis and Recommendations

2. Market Overview

    2.1. Market Coverage / Taxonomy

    2.2. Market Definition / Scope / Limitations

    2.3. Inclusions and Exclusions

3. Key Market Trends

    3.1. Key Trends Impacting the Market

    3.2. Innovation / Development Trends

4. Key Success Factors

    4.1. Product Adoption Analysis

    4.2. Regulatory Landscape

    4.3. Reimbursement Scenario

    4.4. PESTEL Analysis

    4.5. Porter’s Analysis

    4.6. Value Chain Analysis

5. Market Background

    5.1. Macro-Economic Factors

        5.1.1. Global GDP Growth Outlook

        5.1.2. Global Healthcare Outlook

        5.1.3. Global Market Overview

    5.2. Forecast Factors - Relevance & Impact

        5.2.1. Increasing Prevalence of Chronic and Infectious Diseases

        5.2.2. Growing Elderly Population

        5.2.3. Growing Efforts on Stem Cell Research

        5.2.4. Increasing Demand for Gene Therapies

        5.2.5. Rising Biopharmaceutical Production

        5.2.6. Growing Investments in R&D

        5.2.7. Rising Adoption of Automated Systems for Bulk Manufacturing

        5.2.8. Increasing Focus on New Drug Discovery and Development

    5.3. Market Dynamics

        5.3.1. Drivers

        5.3.2. Restraints

        5.3.3. Opportunity Analysis

6. COVID-19 Crisis Analysis

    6.1. COVID-19 and Impact Analysis

        6.1.1. By Product

        6.1.2. By Application

        6.1.3. By Cell Culture

        6.1.4. By End User

        6.1.5. By Country

    6.2. 2021 Market Scenario

7. Global Market Volume (Units) Analysis 2015 to 2021 and Forecast, 2022 to 2032

    7.1. Historical Market Volume (Units) Analysis, 2015 to 2021

    7.2. Current and Future Market Volume (Units) Projections, 2022 to 2032

        7.2.1. Y-o-Y Growth Trend Analysis

8. Global Market - Pricing Analysis

    8.1. Regional Pricing Analysis By Product

    8.2. Pricing Break-up

        8.2.1. Manufacturer-Level Pricing

        8.2.2. Distributor Level Pricing

    8.3. Global Average Pricing Analysis Benchmark

    8.4. Pricing Assumptions

9. Global Market Demand (in Value or Size in US$ Million) Analysis 2015 to 2021 and Forecast, 2022 to 2032

    9.1. Historical Market Value (US$ Million) Analysis, 2015 to 2021

    9.2. Current and Future Market Value (US$ Million) Projections, 2022 to 2032

        9.2.1. Y-o-Y Growth Trend Analysis

        9.2.2. Absolute $ Opportunity Analysis

10. Global Market Analysis, By Product

    10.1. Introduction / Key Findings

    10.2. Historical Market Size (US$ Million) and Volume (Units) Analysis By Product, 2015 to 2021

    10.3. Current and Future Market Size (US$ Million) and Volume (Units) Analysis and Forecast By Product, 2022 to 2032

        10.3.1. Cell Culture Process Automatization Instrument or Robot (Multiple Function)

        10.3.2. Automated Bioreactor (Single or Multiple Function)

        10.3.3. Automated Cell Culture Media Exchange System (Single Function)

        10.3.4. Automated Culture Media Analyzer (Single Function)

        10.3.5. Automated Cell Wash-and-Concentrate System (Single Function)

        10.3.6. Automated Cell Counter (Single Function)

        10.3.7. Automated Fill and Finish System (Single Function)

        10.3.8. Automated Cell Storage Equipment (Single Function)

        10.3.9. Management Software

    10.4. Market Attractiveness Analysis By Product

11. Global Market Analysis, By Cell Culture 

    11.1. Introduction / Key Findings

    11.2. Historical Market Size (US$ Million) Analysis By Cell Culture, 2015 to 2021

    11.3. Current and Future Market Size (US$ Million) Analysis and Forecast By Cell Culture, 2022 to 2032

        11.3.1. Finite Cell Line Cultures

        11.3.2. Infinite Cell Line Cultures

    11.4. Market Attractiveness Analysis By Cell Culture

12. Global Market Analysis, By Application

    12.1. Introduction / Key Findings

    12.2. Historical Market Size (US$ Million) Analysis, By Application, 2015 to 2021

    12.3. Current and Future Market Size (US$ Million) Analysis and Forecast By Application, 2022 to 2032

        12.3.1. Cell Therapy

        12.3.2. Drug Development

        12.3.3. Stem Cell Research

        12.3.4. Regenerative Medicine

    12.4. Market Attractiveness Analysis By Application

13. Global Market Analysis, By End User 

    13.1. Introduction / Key Findings

    13.2. Historical Market Size (US$ Million) Analysis, By End User, 2015 to 2021

    13.3. Current and Future Market Size (US$ Million) Analysis and Forecast By End User, 2022 to 2032

        13.3.1. Mega Pharmaceutical companies

        13.3.2. Biopharmaceutical companies

        13.3.3. CDMOs/CMOs

        13.3.4. Research organizations

        13.3.5. Academic institutes

    13.4. Market Attractiveness Analysis By End User

14. Global Market Analysis, By Region

    14.1. Introduction

    14.2. Historical Market Size (US$ Million) and Volume (Units) Analysis By Region, 2015 to 2021

    14.3. Current and Future Market Value (US$ Million) and Volume (Units) Analysis and Forecast, 2022 to 2032

        14.3.1. North America

        14.3.2. Latin America

        14.3.3. Europe

        14.3.4. East Asia

        14.3.5. South Asia

        14.3.6. Oceania

        14.3.7. Middle East and Africa (MEA)

    14.4. Market Attractiveness Analysis By Region

15. North America Market Analysis

    15.1. Introduction

    15.2. Historical Market Size (US$ Million) Trend and Volume (Units) Analysis By Market Taxonomy, 2015 to 2021

    15.3. Current and Future Market Value (US$ Million) and Volume (Units) Analysis and Forecast, 2022 to 2032

        15.3.1. By Country

            15.3.1.1. USA

            15.3.1.2. Canada

        15.3.2. By Product

        15.3.3. By Application

        15.3.4. By Cell Culture

        15.3.5. By End User

    15.4. Market Attractiveness Analysis

        15.4.1. By Country

        15.4.2. By Product

        15.4.3. By Cell Culture

        15.4.4. By Application

        15.4.5. By End User

    15.5. Market Trends

    15.6. Drivers and Restraints - Impact Analysis

    15.7. Country-Level Analysis & Forecast

        15.7.1. USA Market Analysis

            15.7.1.1. Introduction

            15.7.1.2. Market Analysis and Forecast by Market Taxonomy

                15.7.1.2.1. By Product

                15.7.1.2.2. By Cell Culture

                15.7.1.2.3. By Application

                15.7.1.2.4. By End User

        15.7.2. Canada Market Analysis

            15.7.2.1. Introduction

            15.7.2.2. Market Analysis and Forecast by Market Taxonomy

                15.7.2.2.1. By Product

                15.7.2.2.2. By Cell Culture

                15.7.2.2.3. By Application

                15.7.2.2.4. By End User

16. Latin America Market Analysis

    16.1. Introduction

    16.2. Historical Market Size (US$ Million) Trend and Volume (Units) Analysis By Market Taxonomy, 2015 to 2021

    16.3. Current and Future Market Value (US$ Million) and Volume (Units) Analysis and Forecast, 2022 to 2032

        16.3.1. By Country

            16.3.1.1. Mexico

            16.3.1.2. Brazil

            16.3.1.3. Argentina

            16.3.1.4. Rest of Latin America

        16.3.2. By Product

        16.3.3. By Cell Culture

        16.3.4. By Application

        16.3.5. By End User

    16.4. Market Attractiveness Analysis

        16.4.1. By Country

        16.4.2. By Product

        16.4.3. By Cell Culture

        16.4.4. By Application

        16.4.5. By End User

    16.5. Market Trends

    16.6. Drivers and Restraints - Impact Analysis

    16.7. Country-Level Analysis & Forecast

        16.7.1. Mexico Market Analysis

            16.7.1.1. Introduction

            16.7.1.2. Market Analysis and Forecast by Market Taxonomy

                16.7.1.2.1. By Product

                16.7.1.2.2. By Cell Culture

                16.7.1.2.3. By Application

                16.7.1.2.4. By End User

        16.7.2. Brazil Market Analysis

            16.7.2.1. Introduction

            16.7.2.2. Market Analysis and Forecast by Market Taxonomy

                16.7.2.2.1. By Product

                16.7.2.2.2. By Cell Culture

                16.7.2.2.3. By Application

                16.7.2.2.4. By End User

        16.7.3. Argentina Market Analysis

            16.7.3.1. Introduction

            16.7.3.2. Market Analysis and Forecast by Market Taxonomy

                16.7.3.2.1. By Product

                16.7.3.2.2. By Cell Culture

                16.7.3.2.3. By Application

                16.7.3.2.4. By End User

17. Europe Market Analysis

    17.1. Introduction

    17.2. Historical Market Size (US$ Million) Trend and Volume (Units) Analysis By Market Taxonomy, 2015 to 2021

    17.3. Current and Future Market Value (US$ Million) and Volume (Units) Analysis and Forecast, 2022 to 2032

        17.3.1. By Country

            17.3.1.1. Germany

            17.3.1.2. Italy

            17.3.1.3. France

            17.3.1.4. United Kingdom

            17.3.1.5. Spain

            17.3.1.6. BENELUX

            17.3.1.7. Russia

            17.3.1.8. Rest of Europe

        17.3.2. By Product

        17.3.3. By Cell Culture

        17.3.4. By Application

        17.3.5. By End User

    17.4. Market Attractiveness Analysis

        17.4.1. By Country

        17.4.2. By Product

        17.4.3. By Cell Culture

        17.4.4. By Application

        17.4.5. By End User

    17.5. Market Trends

    17.6. Drivers and Restraints - Impact Analysis

    17.7. Country-Level Analysis & Forecast

        17.7.1. Germany Market Analysis

            17.7.1.1. Introduction

            17.7.1.2. Market Analysis and Forecast by Market Taxonomy

                17.7.1.2.1. By Product

                17.7.1.2.2. By Cell Culture

                17.7.1.2.3. By Application

                17.7.1.2.4. By End User

        17.7.2. Italy Market Analysis

            17.7.2.1. Introduction

            17.7.2.2. Market Analysis and Forecast by Market Taxonomy

                17.7.2.2.1. By Product

                17.7.2.2.2. By Cell Culture

                17.7.2.2.3. By Application

                17.7.2.2.4. By End User

        17.7.3. France Market Analysis

            17.7.3.1. Introduction

            17.7.3.2. Market Analysis and Forecast by Market Taxonomy

                17.7.3.2.1. By Product

                17.7.3.2.2. By Cell Culture

                17.7.3.2.3. By Application

                17.7.3.2.4. By End User

        17.7.4. United Kingdom Market Analysis

            17.7.4.1. Introduction

            17.7.4.2. Market Analysis and Forecast by Market Taxonomy

                17.7.4.2.1. By Product

                17.7.4.2.2. By Cell Culture

                17.7.4.2.3. By Application

                17.7.4.2.4. By End User

        17.7.5. Spain Market Analysis

            17.7.5.1. Introduction

            17.7.5.2. Market Analysis and Forecast by Market Taxonomy

                17.7.5.2.1. By Product

                17.7.5.2.2. By Cell Culture

                17.7.5.2.3. By Application

                17.7.5.2.4. By End User

        17.7.6. BENELUX Market Analysis

            17.7.6.1. Introduction

            17.7.6.2. Market Analysis and Forecast by Market Taxonomy

                17.7.6.2.1. By Product

                17.7.6.2.2. By Cell Culture

                17.7.6.2.3. By Application

                17.7.6.2.4. By End User

        17.7.7. Russia Market Analysis

            17.7.7.1. Introduction

            17.7.7.2. Market Analysis and Forecast by Market Taxonomy

                17.7.7.2.1. By Product

                17.7.7.2.2. By Cell Culture

                17.7.7.2.3. By Application

                17.7.7.2.4. By End User

18. East Asia Market Analysis

    18.1. Introduction

    18.2. Historical Market Size (US$ Million) Trend and Volume (Units) Analysis By Market Taxonomy, 2015 to 2021

    18.3. Current and Future Market Value (US$ Million) and Volume (Units) Analysis and Forecast, 2022 to 2032

        18.3.1. By Country

            18.3.1.1. China

            18.3.1.2. Japan

            18.3.1.3. South Korea

        18.3.2. By Product

        18.3.3. By Cell Culture

        18.3.4. By Application

        18.3.5. By End User

    18.4. Market Attractiveness Analysis

        18.4.1. By Country

        18.4.2. By Cell Culture

        18.4.3. By Product

        18.4.4. By Application

        18.4.5. By End User

    18.5. Market Trends

    18.6. Drivers and Restraints - Impact Analysis

    18.7. Country-Level Analysis & Forecast

        18.7.1. China Market Analysis

            18.7.1.1. Introduction

            18.7.1.2. Market Analysis and Forecast by Market Taxonomy

                18.7.1.2.1. By Product

                18.7.1.2.2. By Cell Culture

                18.7.1.2.3. By Application

                18.7.1.2.4. By End User

        18.7.2. Japan Market Analysis

            18.7.2.1. Introduction

            18.7.2.2. Market Analysis and Forecast by Market Taxonomy

                18.7.2.2.1. By Product

                18.7.2.2.2. By Cell Culture

                18.7.2.2.3. By Application

                18.7.2.2.4. By End User

        18.7.3. South Korea Market Analysis

            18.7.3.1. Introduction

            18.7.3.2. Market Analysis and Forecast by Market Taxonomy

                18.7.3.2.1. By Product

                18.7.3.2.2. By Cell Culture

                18.7.3.2.3. By Application

                18.7.3.2.4. By End User

19. South Asia Market Analysis

    19.1. Introduction

    19.2. Historical Market Size (US$ Million) Trend and Volume (Units) Analysis By Market Taxonomy, 2015 to 2021

    19.3. Current and Future Market Value (US$ Million) and Volume (Units) Analysis and Forecast, 2022 to 2032

        19.3.1. By Country

            19.3.1.1. India

            19.3.1.2. Indonesia

            19.3.1.3. Malaysia

            19.3.1.4. Thailand

            19.3.1.5. Rest of South Asia

        19.3.2. By Product

        19.3.3. By Cell Culture

        19.3.4. By Application

        19.3.5. By End User

    19.4. Market Attractiveness Analysis

        19.4.1. By Country

        19.4.2. By Cell Culture

        19.4.3. By Product

        19.4.4. By Application

        19.4.5. By End User

    19.5. Market Trends

    19.6. Drivers and Restraints - Impact Analysis

    19.7. Country-Level Analysis & Forecast

        19.7.1. India Market Analysis

            19.7.1.1. Introduction

            19.7.1.2. Market Analysis and Forecast by Market Taxonomy

                19.7.1.2.1. By Product

                19.7.1.2.2. By Cell Culture

                19.7.1.2.3. By Application

                19.7.1.2.4. By End User

        19.7.2. Indonesia Market Analysis

            19.7.2.1. Introduction

            19.7.2.2. Market Analysis and Forecast by Market Taxonomy

                19.7.2.2.1. By Product

                19.7.2.2.2. By Cell Culture

                19.7.2.2.3. By Application

                19.7.2.2.4. By End User

        19.7.3. Malaysia Market Analysis

            19.7.3.1. Introduction

            19.7.3.2. Market Analysis and Forecast by Market Taxonomy

                19.7.3.2.1. By Product

                19.7.3.2.2. By Cell Culture

                19.7.3.2.3. By Application

                19.7.3.2.4. By End User

        19.7.4. Thailand Market Analysis

            19.7.4.1. Introduction

            19.7.4.2. Market Analysis and Forecast by Market Taxonomy

                19.7.4.2.1. By Product

                19.7.4.2.2. By Cell Culture

                19.7.4.2.3. By Application

                19.7.4.2.4. By End User

20. Oceania Market Analysis

    20.1. Introduction

    20.2. Historical Market Size (US$ Million) Trend and Volume (Units) Analysis By Market Taxonomy, 2015 to 2021

    20.3. Current and Future Market Value (US$ Million) and Volume (Units) Analysis and Forecast, 2022 to 2032

        20.3.1. By Country

            20.3.1.1. Australia

            20.3.1.2. New Zealand

        20.3.2. By Product

        20.3.3. By Cell Culture

        20.3.4. By Application

        20.3.5. By End User

    20.4. Market Attractiveness Analysis

        20.4.1. By Country

        20.4.2. By Product

        20.4.3. By Cell Culture

        20.4.4. By Application

        20.4.5. By End User

    20.5. Key Market Participants - Intensity Mapping

    20.6. Drivers and Restraints - Impact Analysis

    20.7. Country-Level Analysis & Forecast

        20.7.1. Australia Market Analysis

            20.7.1.1. Introduction

            20.7.1.2. Market Analysis and Forecast by Market Taxonomy

                20.7.1.2.1. By Product

                20.7.1.2.2. By Cell Culture

                20.7.1.2.3. By Application

                20.7.1.2.4. By End User

        20.7.2. New Zealand Market Analysis

            20.7.2.1. Introduction

            20.7.2.2. Market Analysis and Forecast by Market Taxonomy

                20.7.2.2.1. By Product

                20.7.2.2.2. By Cell Culture

                20.7.2.2.3. By Application

                20.7.2.2.4. By End User

21. Middle East and Africa (MEA) Market Analysis

    21.1. Introduction

    21.2. Historical Market Size (US$ Million) Trend and Volume (Units) Analysis By Market Taxonomy, 2015 to 2021

    21.3. Current and Future Market Value (US$ Million) and Volume (Units) Analysis and Forecast, 2022 to 2032

        21.3.1. By Country

            21.3.1.1. GCC Countries

            21.3.1.2. Turkey

            21.3.1.3. North Africa

            21.3.1.4. South Africa

            21.3.1.5. Rest of Middle East and Africa

        21.3.2. By Product

        21.3.3. By Cell Culture

        21.3.4. By Application

        21.3.5. By End User

    21.4. Market Attractiveness Analysis

        21.4.1. By Country

        21.4.2. By Product

        21.4.3. By Cell Culture

        21.4.4. By Application

        21.4.5. By End User

    21.5. Market Trends

    21.6. Drivers and Restraints - Impact Analysis

    21.7. Country-Level Analysis & Forecast

        21.7.1. GCC Countries Market Analysis

            21.7.1.1. Introduction

            21.7.1.2. Market Analysis and Forecast by Market Taxonomy

                21.7.1.2.1. By Product

                21.7.1.2.2. By Cell Culture

                21.7.1.2.3. By Application

                21.7.1.2.4. By End User

        21.7.2. Turkey Market Analysis

            21.7.2.1. Introduction

            21.7.2.2. Market Analysis and Forecast by Market Taxonomy

                21.7.2.2.1. By Product

                21.7.2.2.2. By Cell Culture

                21.7.2.2.3. By Application

                21.7.2.2.4. By End User

        21.7.3. South Africa Market Analysis

            21.7.3.1. Introduction

            21.7.3.2. Market Analysis and Forecast by Market Taxonomy

                21.7.3.2.1. By Product

                21.7.3.2.2. By Cell Culture

                21.7.3.2.3. By Application

                21.7.3.2.4. By End User

        21.7.4. North Africa Market Analysis

            21.7.4.1. Introduction

            21.7.4.2. Market Analysis and Forecast by Market Taxonomy

                21.7.4.2.1. By Product

                21.7.4.2.2. By Cell Culture

                21.7.4.2.3. By Application

                21.7.4.2.4. By End User

22. Market Structure Analysis

    22.1. Market Analysis by Tier of Companies

    22.2. Market Share Analysis of Top Players

    22.3. Market Presence Analysis

23. Competition Analysis

    23.1. Competition Dashboard

    23.2. Competition Benchmarking

    23.3. Competition Deep Dive

        23.3.1. Thermo Fisher Scientific

            23.3.1.1. Overview

            23.3.1.2. Product Portfolio

            23.3.1.3. Sales Footprint

            23.3.1.4. Key Financials

            23.3.1.5. SWOT Analysis

            23.3.1.6. Strategy Overview

                23.3.1.6.1. Marketing Strategy

                23.3.1.6.2. Product Strategy

                23.3.1.6.3. Channel Strategy

        23.3.2. Corning Incorporated

            23.3.2.1. Overview

            23.3.2.2. Product Portfolio

            23.3.2.3. Sales Footprint

            23.3.2.4. Key Financials

            23.3.2.5. SWOT Analysis

            23.3.2.6. Strategy Overview

                23.3.2.6.1. Marketing Strategy

                23.3.2.6.2. Product Strategy

                23.3.2.6.3. Channel Strategy

        23.3.3. Merck KGaA

            23.3.3.1. Overview

            23.3.3.2. Product Portfolio

            23.3.3.3. Sales Footprint

            23.3.3.4. Key Financials

            23.3.3.5. SWOT Analysis

            23.3.3.6. Strategy Overview

                23.3.3.6.1. Marketing Strategy

                23.3.3.6.2. Product Strategy

                23.3.3.6.3. Channel Strategy

        23.3.4. Lonza

            23.3.4.1. Overview

            23.3.4.2. Product Portfolio

            23.3.4.3. Sales Footprint

            23.3.4.4. Key Financials

            23.3.4.5. SWOT Analysis

            23.3.4.6. Strategy Overview

                23.3.4.6.1. Marketing Strategy

                23.3.4.6.2. Product Strategy

                23.3.4.6.3. Channel Strategy

        23.3.5. Sartorius AG

            23.3.5.1. Overview

            23.3.5.2. Product Portfolio

            23.3.5.3. Sales Footprint

            23.3.5.4. Key Financials

            23.3.5.5. SWOT Analysis

            23.3.5.6. Strategy Overview

                23.3.5.6.1. Marketing Strategy

                23.3.5.6.2. Product Strategy

                23.3.5.6.3. Channel Strategy

        23.3.6. Hitachi. Ltd

            23.3.6.1. Overview

            23.3.6.2. Product Portfolio

            23.3.6.3. Sales Footprint

            23.3.6.4. Key Financials

            23.3.6.5. SWOT Analysis

            23.3.6.6. Strategy Overview

                23.3.6.6.1. Marketing Strategy

                23.3.6.6.2. Product Strategy

                23.3.6.6.3. Channel Strategy

        23.3.7. Nanoentek

            23.3.7.1. Overview

            23.3.7.2. Product Portfolio

            23.3.7.3. Sales Footprint

            23.3.7.4. Key Financials

            23.3.7.5. SWOT Analysis

            23.3.7.6. Strategy Overview

                23.3.7.6.1. Marketing Strategy

                23.3.7.6.2. Product Strategy

                23.3.7.6.3. Channel Strategy

        23.3.8. ChemoMetec

            23.3.8.1. Overview

            23.3.8.2. Product Portfolio

            23.3.8.3. Sales Footprint

            23.3.8.4. Key Financials

            23.3.8.5. SWOT Analysis

            23.3.8.6. Strategy Overview

                23.3.8.6.1. Marketing Strategy

                23.3.8.6.2. Product Strategy

                23.3.8.6.3. Channel Strategy

        23.3.9. Danaher corporation

            23.3.9.1. Overview

            23.3.9.2. Product Portfolio

            23.3.9.3. Sales Footprint

            23.3.9.4. Key Financials

            23.3.9.5. SWOT Analysis

            23.3.9.6. Strategy Overview

                23.3.9.6.1. Marketing Strategy

                23.3.9.6.2. Product Strategy

                23.3.9.6.3. Channel Strategy

        23.3.10. Agilent Technologies

            23.3.10.1. Overview

            23.3.10.2. Product Portfolio

            23.3.10.3. Sales Footprint

            23.3.10.4. Key Financials

            23.3.10.5. SWOT Analysis

            23.3.10.6. Strategy Overview

                23.3.10.6.1. Marketing Strategy

                23.3.10.6.2. Product Strategy

                23.3.10.6.3. Channel Strategy

        23.3.11. Perkin Elmer (Nexcelom Bioscience LLC.)

            23.3.11.1. Overview

            23.3.11.2. Product Portfolio

            23.3.11.3. Sales Footprint

            23.3.11.4. Key Financials

            23.3.11.5. SWOT Analysis

            23.3.11.6. Strategy Overview

                23.3.11.6.1. Marketing Strategy

                23.3.11.6.2. Product Strategy

                23.3.11.6.3. Channel Strategy

        23.3.12. F. Hoffmann-La Roche AG

            23.3.12.1. Overview

            23.3.12.2. Product Portfolio

            23.3.12.3. Sales Footprint

            23.3.12.4. Key Financials

            23.3.12.5. SWOT Analysis

            23.3.12.6. Strategy Overview

                23.3.12.6.1. Marketing Strategy

                23.3.12.6.2. Product Strategy

                23.3.12.6.3. Channel Strategy

        23.3.13. SHIMADZU CORPORATION

            23.3.13.1. Overview

            23.3.13.2. Product Portfolio

            23.3.13.3. Sales Footprint

            23.3.13.4. Key Financials

            23.3.13.5. SWOT Analysis

            23.3.13.6. Strategy Overview

                23.3.13.6.1. Marketing Strategy

                23.3.13.6.2. Product Strategy

                23.3.13.6.3. Channel Strategy

        23.3.14. Bio-Rad Laboratories

            23.3.14.1. Overview

            23.3.14.2. Product Portfolio

            23.3.14.3. Sales Footprint

            23.3.14.4. Key Financials

            23.3.14.5. SWOT Analysis

            23.3.14.6. Strategy Overview

                23.3.14.6.1. Marketing Strategy

                23.3.14.6.2. Product Strategy

                23.3.14.6.3. Channel Strategy

        23.3.15. Miltenyi Biotec

            23.3.15.1. Overview

            23.3.15.2. Product Portfolio

            23.3.15.3. Sales Footprint

            23.3.15.4. Key Financials

            23.3.15.5. SWOT Analysis

            23.3.15.6. Strategy Overview

                23.3.15.6.1. Marketing Strategy

                23.3.15.6.2. Product Strategy

                23.3.15.6.3. Channel Strategy

        23.3.16. Sinfonia Technology

            23.3.16.1. Overview

            23.3.16.2. Product Portfolio

            23.3.16.3. Sales Footprint

            23.3.16.4. Key Financials

            23.3.16.5. SWOT Analysis

            23.3.16.6. Strategy Overview

                23.3.16.6.1. Marketing Strategy

                23.3.16.6.2. Product Strategy

                23.3.16.6.3. Channel Strategy

        23.3.17. SHIBUYA CORPORATION

            23.3.17.1. Overview

            23.3.17.2. Product Portfolio

            23.3.17.3. Sales Footprint

            23.3.17.4. Key Financials

            23.3.17.5. SWOT Analysis

            23.3.17.6. Strategy Overview

                23.3.17.6.1. Marketing Strategy

                23.3.17.6.2. Product Strategy

                23.3.17.6.3. Channel Strategy

        23.3.18. Advanced Instruments

            23.3.18.1. Overview

            23.3.18.2. Product Portfolio

            23.3.18.3. Sales Footprint

            23.3.18.4. Key Financials

            23.3.18.5. SWOT Analysis

            23.3.18.6. Strategy Overview

                23.3.18.6.1. Marketing Strategy

                23.3.18.6.2. Product Strategy

                23.3.18.6.3. Channel Strategy

        23.3.19. Cell Culture Company, LLC

            23.3.19.1. Overview

            23.3.19.2. Product Portfolio

            23.3.19.3. Sales Footprint

            23.3.19.4. Key Financials

            23.3.19.5. SWOT Analysis

            23.3.19.6. Strategy Overview

                23.3.19.6.1. Marketing Strategy

                23.3.19.6.2. Product Strategy

                23.3.19.6.3. Channel Strategy

        23.3.20. BD

            23.3.20.1. Overview

            23.3.20.2. Product Portfolio

            23.3.20.3. Sales Footprint

            23.3.20.4. Key Financials

            23.3.20.5. SWOT Analysis

            23.3.20.6. Strategy Overview

                23.3.20.6.1. Marketing Strategy

                23.3.20.6.2. Product Strategy

                23.3.20.6.3. Channel Strategy

        23.3.21. Hamilton Company

            23.3.21.1. Overview

            23.3.21.2. Product Portfolio

            23.3.21.3. Sales Footprint

            23.3.21.4. Key Financials

            23.3.21.5. SWOT Analysis

            23.3.21.6. Strategy Overview

                23.3.21.6.1. Marketing Strategy

                23.3.21.6.2. Product Strategy

                23.3.21.6.3. Channel Strategy

24. Assumptions and Acronyms Used

25. Research Methodology

Recommendations

Packaging

Biodegradable Packaging Market

December 2024

REP-GB-323

250 pages

Packaging

FMCG Packaging Market

May 2023

REP-GB-110

324 pages

Packaging

Biodegradable Food Packaging Market

March 2023

REP-GB-12941

250 pages

Packaging

Intelligent Packaging Market

February 2023

REP-GB-13604

240 pages

Explore Healthcare Insights

View Reports
Future Market Insights

Automated Cell Biology Systems Market

Schedule a Call