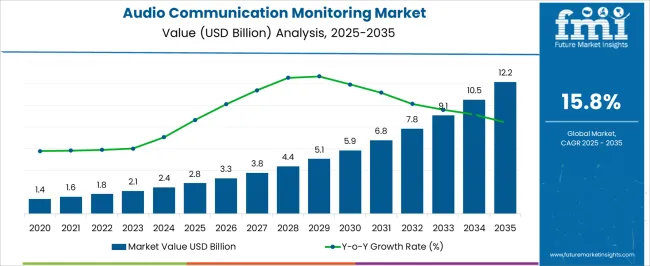
The Audio Communication Monitoring Market is estimated to be valued at USD 2.8 billion in 2025 and is projected to reach USD 12.2 billion by 2035, registering a compound annual growth rate (CAGR) of 15.8% over the forecast period.
| Metric | Value |
|---|---|
| Audio Communication Monitoring Market Estimated Value in (2025 E) | USD 2.8 billion |
| Audio Communication Monitoring Market Forecast Value in (2035 F) | USD 12.2 billion |
| Forecast CAGR (2025 to 2035) | 15.8% |
The audio communication monitoring market is expanding due to rising compliance requirements, risk management priorities, and the growing need for quality assurance across multiple industries. Organizations are increasingly focusing on monitoring and analyzing communication streams to ensure regulatory adherence, safeguard sensitive data, and improve customer experience.
The integration of artificial intelligence, speech analytics, and real time monitoring capabilities has transformed the operational value of these solutions. Financial institutions, healthcare providers, and enterprises are actively investing in advanced platforms to strengthen security frameworks and minimize fraud risks.
Additionally, the adoption of cloud based solutions and remote working models has accelerated demand for scalable and flexible monitoring tools. The market outlook remains strong as enterprises continue to emphasize compliance driven transparency, customer centric service delivery, and data protection in a digitally connected environment.
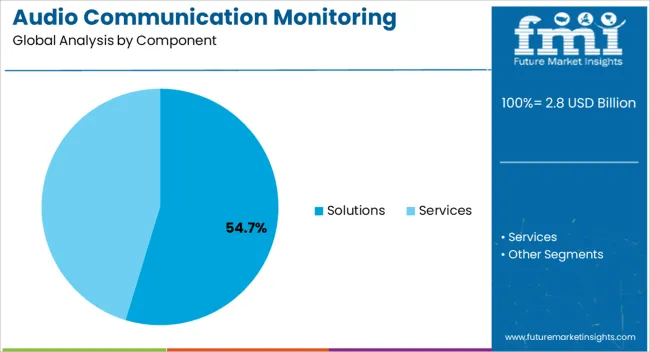
The solutions segment is expected to account for 54.70% of the total market revenue by 2025 within the component category, making it the leading segment. This growth is being driven by the need for real time monitoring, enhanced risk detection, and integration of AI powered analytics in communication streams.
Enterprises are adopting comprehensive solutions to ensure compliance, protect sensitive information, and maintain operational efficiency. The ability of these solutions to deliver actionable insights, reduce fraud incidents, and improve service quality has strengthened their demand.
As communication channels diversify across industries, solutions continue to dominate due to their scalability, accuracy, and capacity to align with evolving regulatory frameworks.
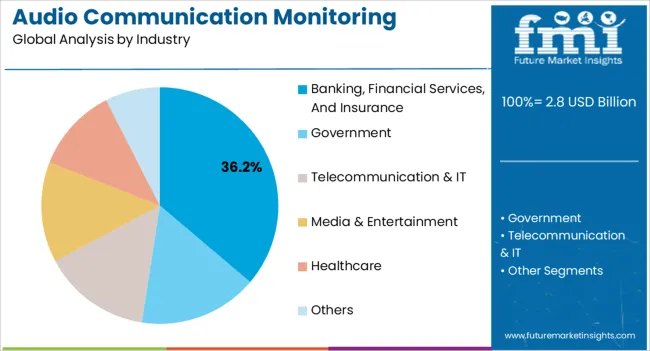
The banking financial services and insurance segment is projected to contribute 36.20% of the market revenue by 2025 within the industry category, positioning it as the most prominent industry. This is attributed to strict regulatory requirements, the rising threat of fraudulent activities, and the necessity for transparent customer interactions.
The BFSI sector relies heavily on audio monitoring to meet compliance standards, enhance dispute resolution, and protect against reputational risks. Investments in advanced monitoring systems have increased as institutions aim to secure communication channels and improve client trust.
With heightened scrutiny from regulators and expanding customer bases, the BFSI industry remains at the forefront of adopting audio communication monitoring solutions.
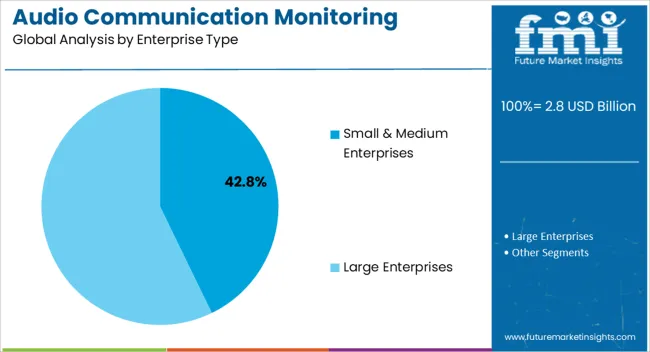
The small and medium enterprises segment is anticipated to hold 42.80% of the total market revenue by 2025 within the enterprise type category, making it the leading segment. Growth in this segment is supported by the increasing affordability of cloud based monitoring tools, growing security concerns, and the need for cost effective compliance solutions.
SMEs are leveraging audio monitoring not only for regulatory adherence but also to enhance customer engagement and service delivery. The ability to access scalable solutions without significant upfront investment has encouraged adoption among resource constrained businesses.
As SMEs continue to digitize operations and expand globally, the demand for audio communication monitoring systems is set to remain robust, reinforcing their leadership in this category.
Audio Communication - A Significant Technology for Companies to Remain Competitive
The market value of audio communication monitoring systems registered around 14.5% CAGR historically from 2020 to 2025. Businesses are slowly discovering the need of being able to monitor and maintain audio monitoring capability centrally as audio communication technology becomes increasingly coupled with network management and IT infrastructure.
Audio communication monitoring systems analyze conversations and find structures in interactions, and provide insights to clients. Audio communication technology is used to extract important business intelligence data to relate it to the strategy for making strategic decisions for the company.
Audio communication monitoring solutions generally revolve around the call recording feature. The recording, processing, and then analysis are all part of the audio communication monitoring system market. Companies are also requesting audio communication monitoring as a result of the introduction of enhanced governance, risk, and compliance frameworks that they must adhere to.
Growing requirement for real-time analytics from call logs and communication data as well as the conversion of that data into proper formats across the business is fueling the expansion of the audio communication monitoring system market. Additionally, these solutions lower early acquisition and maintenance costs, resulting in increased demand from SMBs, which is fueling global market expansion.
Listening to live calls takes time and necessitates additional time for supervision and administration; hence, the growing adoption of communications monitors in network management software is another key reason influencing the market growth.
Moreover, as more high-tech options become available, the risk of cybercrime, telemarketing fraud, and phone hacking has increased significantly.
Audio communication monitoring devices have become increasingly popular in recent years as a means of monitoring and controlling such crimes. Implementation by law enforcement agencies has accelerated the market growth.
The main customers of audio communication monitoring platforms are BPOs and call centers. The global audio communication monitoring market is forecast to expand rapidly at a CAGR of around 16.6% over the forecast period of 2025 to 2035.
Rising Adoption of Network Management Software Driving Market Growth in North America
The North America audio communication monitoring market is expected to witness the highest growth in the global market owing to efficient network management and the increasing number of operating BPOs in the region.
The presence of a high number of businesses, an increase in ICT spending, and increased usage of advanced analytical solutions to improve customer service are expected to boost the market expansion of audio communication monitoring systems and services. North America accounted for a market share of 28.1% in 2025.
End Users in the United States Prefer Advanced Audio Communication Technologies
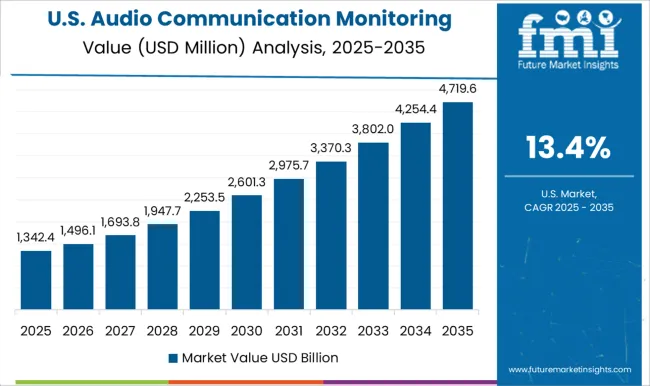
The United States audio communication monitoring market is considered a leading market due to increased expenditure, rising use of audio communication technologies, and rapid expansion of companies researching the use of AI and NLP technologies for diverse applications.
In its commercial institutions and other verticals, United States businesses have widely used AI and NLP technology, enabling them to better cater to consumers and continue to accelerate corporate operations. The country has adequate systems, inventions, and activities needed to turn audio communication monitoring solutions into reliable solutions with novel features.
Development of advanced technologies for capable individuals and operational processes as well as network management across numerous industrial verticals is influencing the adoption of audio communication monitoring systems in the country. United States accounted for a market share of 18.2% in 2025.
Growing Need for Audio Communication Monitoring Devices from Customer Support Vendors
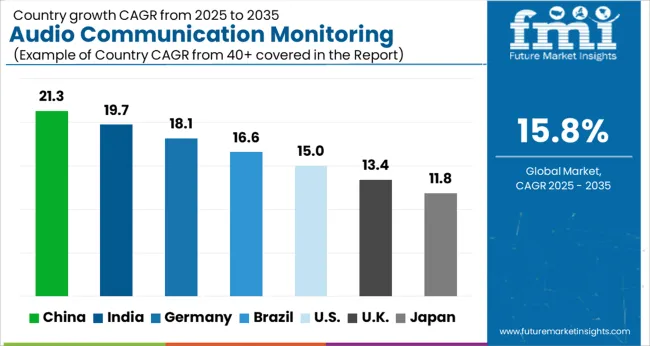
Demand for audio communication monitoring solutions in China is projected to expand due to increased competition among customer support vendors. In addition, massive target groups resulting from the large population in China are boosting the need for audio communication monitoring solutions to keep adequate records.
Because of its developing e-commerce sector, the market in China is expected to drive the need for audio communication monitoring devices. The market in China is anticipated to grow at a CAGR of 18.8%.
Call Recording Solutions to Hold the Highest Market Share
On the basis of component, the market for audio communication monitoring equipment is segmented into solutions and services. The solutions segment is further divided into quality analysis, audio loudness, metering and monitoring call recording, and others.
Call recording and analysis are important procedures in BPO companies, and an increase in the number of working BPOs is expected to fuel the consumption of communications monitors.
Rise in Tele Fraudulent Activities Driving Demand from Law Enforcement Agencies
The necessity for government and law enforcement agencies to detect and monitor illegal activities such as trafficking in human beings, drug smuggling, terrorist acts, piracy, pornography, scams, and other risks to physical safety and national defense is credited to the growth of the communications monitor market.
Mobile phones, smartphones, mics, and RF interfaces are among the gadgets used by law enforcement organizations to listen in on criminals. Multichannel tracking entails using an audio connection surveillance portfolio to continually supply features like loudness logging, Dolby decoding, and touchscreens, as well as meeting the needs of a variety of different timecodes.
Companies have become capable of capturing every call using telephony and VoIP recording thanks to network management software solutions. These systems enable a clearer view of all forms of attacks and occurrences to the Public Safety Answering Point (PSAP), the automotive industry, and other public authorities.
Audio communication monitoring has made police prosecutions easier since law enforcement officers can utilize the internet and manage their PCs with their voices, resulting in content receiving commands much faster via speech over the internet, enhancing the efficiency of police officers in a crisis situation.
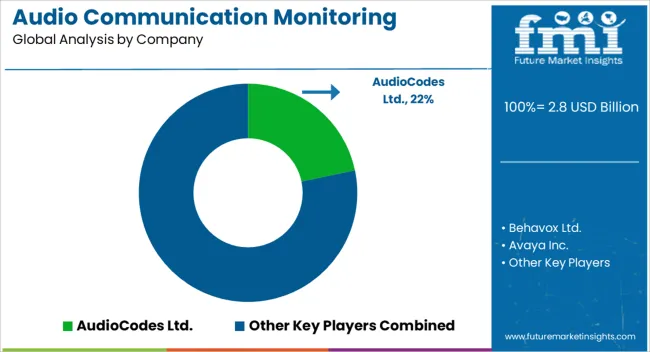
Growing strategic partnerships and collaborations between audio communication monitoring solution providers and organizations are expected to increase market growth potential. Similarly, audio communication monitoring service providers are concentrating on integrating modern technology and network management software into real-time communication analysis.
| Attribute | Details |
|---|---|
| Forecast Period | 2025 to 2035 |
| Historical Data Available for | 2020 to 2025 |
| Market Analysis | Value in USD million |
| Key Regions Covered | North America; Latin America; Europe; East Asia; South Asia & Pacific; Middle East & Africa |
| Key Countries Covered | United States, Canada, Brazil, Mexico, Germany, United Kingdom, France, Spain, Italy, Poland, Russia, Czech Republic, Romania, India, Bangladesh, Australia, New Zealand, China, Japan, South Korea, GCC Countries, South Africa, Israel |
| Key Market Segments Covered | Component, Industry, Enterprise Type, Application, Region |
| Key Companies Profiled | AudioCodes Ltd.; Behavox Ltd.; Avaya Inc.; Cisco Systems, Inc.; Enghouse Interactive Inc.; NICE Systems Ltd.; Nuance Communication, Inc.; Tata Communications Ltd.; Intelligent Voice; Nectar Services Corporation; Fonetic; Ameyo |
| Customization & Pricing | Available upon Request |
The global audio communication monitoring market is estimated to be valued at USD 2.8 billion in 2025.
The market size for the audio communication monitoring market is projected to reach USD 12.2 billion by 2035.
The audio communication monitoring market is expected to grow at a 15.8% CAGR between 2025 and 2035.
The key product types in audio communication monitoring market are solutions, _quality analysis, _audio loudness, _metering & monitoring, _call recording, _others, services, _maintenance and support services and _professional services.
In terms of industry, banking, financial services, and insurance segment to command 36.2% share in the audio communication monitoring market in 2025.


Full Research Suite comprises of:
Market outlook & trends analysis
Interviews & case studies
Strategic recommendations
Vendor profiles & capabilities analysis
5-year forecasts
8 regions and 60+ country-level data splits
Market segment data splits
12 months of continuous data updates
DELIVERED AS:
PDF EXCEL ONLINE
Audiology Services Market Size and Share Forecast Outlook 2025 to 2035
Audio Processor Market Size and Share Forecast Outlook 2025 to 2035
Audio Power Amplifier IC Market Size and Share Forecast Outlook 2025 to 2035
Audio Conferencing Services Market Outlook 2025 to 2035
Audio Kits Market
Audio Transistors Market
Audio Power Amplifier Market
Audio Codec Market
3D Audio Market Size and Share Forecast Outlook 2025 to 2035
Car Audio Market Size and Share Forecast Outlook 2025 to 2035
Home Audio Equipment Market Analysis & Forecast 2025 to 2035
Class D Audio Amplifiers Market is Segmented by Type, End Use and Region through 2025 to 2035
Wireless Audio Devices Market Size and Share Forecast Outlook 2025 to 2035
Wireless Audio Products Market Growth & Demand 2025 to 2035
Europe Home High End Audio System Market – Trends & Forecast 2025 to 2035
Communication Test and Measurement Market Size and Share Forecast Outlook 2025 to 2035
Communication Platform as a Service (CPaaS) Market Analysis - Size, Share & Forecast 2025 to 2035
Communications Platform as a Service (CPaaS) Market in Korea Growth – Trends & Forecast 2025 to 2035
V2X Communication Module Market Size and Share Forecast Outlook 2025 to 2035
IoT Communication Protocol Market - Insights & Industry Trends 2025 to 2035

Thank you!
You will receive an email from our Business Development Manager. Please be sure to check your SPAM/JUNK folder too.
Chat With
MaRIA