The global atomic clock market is valued at USD 609 million in 2025. It is slated to reach USD 1,200 million by 2035, recording an absolute increase of USD 591 million over the forecast period. This translates into a total growth of 97%, with the market forecast to expand at a compound annual growth rate (CAGR) of 7% between 2025 and 2035. The overall market size is expected to grow by nearly 2X during the same period, supported by increasing adoption in satellite navigation systems, growing defense modernization programs requiring GPS-independent timing solutions, rising demand for 6G network synchronization and telecom infrastructure, and expanding applications in quantum computing and deep-space missions.
Between 2025 and 2030, the atomic clock market is projected to expand from USD 609 million to USD 850 million, resulting in a value increase of USD 241 million, which represents 40.8% of the total forecast growth for the decade. This phase of development will be shaped by increasing deployment of GNSS systems including Galileo and Beidou, rising defense sector investments in GPS-independent timing capabilities, expanding 5G-to-6G network synchronization requirements, and growing demand for chip-scale atomic clocks in portable and military platforms. Aerospace manufacturers and telecommunications operators are expanding their atomic clock integration capabilities to address the growing demand for precise timing solutions that ensure operational excellence and strategic independence.
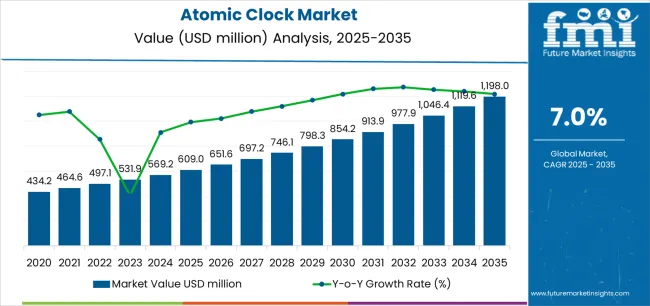
| Metric | Value |
|---|---|
| Estimated Value in (2025E) | USD 609 million |
| Forecast Value in (2035F) | USD 1,200 million |
| Forecast CAGR (2025 to 2035) | 7% |
From 2030 to 2035, the market is forecast to grow from USD 850 million to USD 1,200 million, adding another USD 350 million, which constitutes 59.2% of the overall ten-year expansion. This period is expected to be characterized by the expansion of quantum computing applications and optical lattice clock technologies, the development of miniaturized atomic clocks for commercial and consumer applications, and the growth of specialized timing solutions for deep-space exploration missions and next-generation satellite constellations. The growing adoption of hybrid quartz-atomic oscillator systems and advanced metrology standards will drive demand for atomic clocks with enhanced stability and reduced power consumption features.
Between 2020 and 2025, the atomic clock market experienced steady growth, driven by increasing satellite navigation system deployments and growing recognition of atomic clocks as essential components for enhancing timing precision and operational reliability in defense, aerospace, telecommunications, and scientific research applications. The market developed as aerospace engineers and telecommunications specialists recognized the potential for atomic clock technology to provide GPS-independent timing capabilities, improve network synchronization accuracy, and support critical infrastructure resilience while meeting stringent performance requirements. Technological advancement in chip-scale atomic clock miniaturization and low-power designs began emphasizing the critical importance of maintaining frequency stability and environmental robustness in challenging operational environments.
Market expansion is being supported by the increasing global demand for resilient timing solutions driven by defense modernization programs and strategic independence from GNSS vulnerability, alongside the corresponding need for advanced precision timing systems that can enable network synchronization, support scientific research, and maintain operational continuity across telecommunications, aerospace, defense, and metrology applications. Modern telecommunications operators and defense organizations are increasingly focused on implementing atomic clock solutions that can provide sub-nanosecond timing accuracy, enhance electronic warfare capabilities, and ensure consistent performance in demanding operational conditions.
The growing emphasis on 6G network development and next-generation telecommunications infrastructure is driving demand for atomic clocks that can support ultra-precise network synchronization, enable advanced communications protocols, and ensure comprehensive timing accuracy across distributed network architectures. Telecommunications providers' preference for timing solutions that combine exceptional frequency stability with energy efficiency and compact form factors is creating opportunities for innovative chip-scale atomic clock implementations. The rising influence of quantum computing research and deep-space exploration programs is also contributing to increased adoption of atomic clocks that can provide superior long-term stability without compromising operational reliability or environmental resilience.
The market is segmented by product type, application, and region. By product type, the market is divided into rubidium & chip-scale atomic clocks, cesium atomic clocks, and hydrogen maser atomic clocks. Based on application, the market is categorized into space & military/aerospace, scientific & metrology research, telecom & broadcasting, and others. Regionally, the market is divided into North America, Europe, East Asia, South Asia, Latin America, Oceania, and Middle East & Africa.
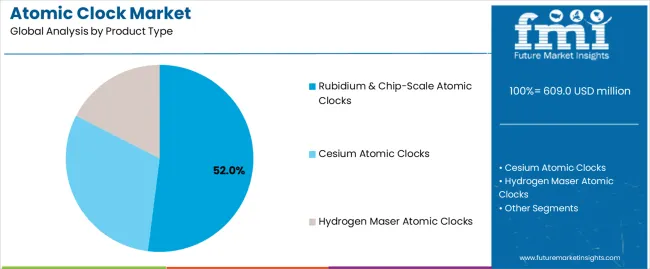
The rubidium & chip-scale atomic clocks segment is projected to maintain its leading position in the atomic clock market in 2025 with a 52% market share, reaffirming its role as the preferred product category for portable timing applications and military platform integration. Defense contractors and telecommunications operators increasingly utilize rubidium-based atomic clocks for their superior portability characteristics, low power consumption profiles, and proven effectiveness in providing GPS-independent timing capabilities while maintaining operational reliability. Chip-scale atomic clock technology's proven effectiveness and application versatility directly address the industry requirements for miniaturized timing solutions and resilient positioning systems across diverse military platforms and telecommunications infrastructure.
This product segment forms the foundation of modern portable timing systems, as it represents the technology with the greatest contribution to size-weight-power optimization and established performance record across multiple defense applications and telecommunications deployment scenarios. Defense industry investments in GPS-resilient technologies continue to strengthen adoption among military system integrators and aerospace contractors. With strategic pressures requiring enhanced electronic warfare capabilities and operational independence, rubidium & chip-scale atomic clocks align with both tactical objectives and performance requirements, making them the central component of comprehensive timing resilience strategies.
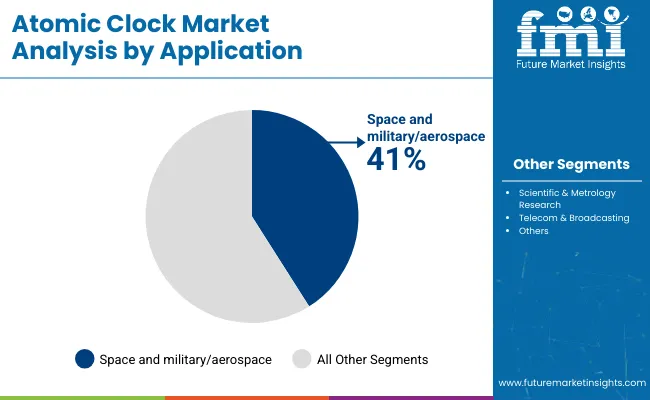
The space & military/aerospace application segment is projected to represent the largest share of atomic clock demand in 2025 with a 41% market share, underscoring its critical role as the primary driver for atomic clock adoption across satellite navigation systems, missile guidance platforms, and spacecraft mission operations. Defense organizations and space agencies prefer atomic clocks for mission-critical timing due to their exceptional frequency stability, GPS-independent operation capabilities, and ability to maintain timing precision in extreme environments while supporting strategic operational requirements and mission success objectives. Positioned as essential components for modern space and defense systems, atomic clocks offer both performance advantages and strategic independence benefits.
The segment is supported by continuous innovation in space exploration programs and the growing availability of radiation-hardened atomic clock designs that enable superior mission performance with enhanced reliability and extended operational lifetimes. Additionally, defense organizations are investing in comprehensive atomic clock integration programs to support increasingly complex electronic warfare scenarios and satellite constellation deployment requirements. As space exploration accelerates and defense modernization intensifies, the space & military/aerospace application will continue to dominate the market while supporting advanced timing capabilities and mission assurance strategies.
The atomic clock market is advancing steadily due to increasing demand for GPS-independent timing solutions driven by defense modernization programs and growing adoption of next-generation telecommunications systems that require ultra-precise synchronization technologies providing enhanced network performance and strategic resilience across space, defense, telecommunications, and scientific research applications. However, the market faces challenges, including high research and development costs for advanced timing technologies, semiconductor supply chain constraints affecting critical component availability, and export restrictions limiting international technology transfer and market access opportunities. Innovation in miniaturization technologies and quantum clock research continues to influence product development and market expansion patterns.
The growing development of 6G telecommunications infrastructure is driving demand for atomic clock solutions that address unprecedented synchronization requirements including sub-nanosecond timing accuracy, distributed network coherence for massive MIMO systems, and ultra-reliable low-latency communication support. Next-generation telecommunications networks require advanced atomic clock deployments that deliver superior frequency stability across multiple operational parameters while maintaining cost-effectiveness and energy efficiency. Telecommunications operators are increasingly recognizing the competitive advantages of atomic clock integration for 6G network architecture and service differentiation, creating opportunities for innovative chip-scale atomic clock designs specifically optimized for telecommunications infrastructure applications.
Modern research institutions and technology companies are incorporating atomic clock technologies into quantum computing systems and advanced metrology laboratories to enhance computational precision, support quantum state coherence, and enable breakthrough scientific discoveries through optimized timing accuracy and environmental stability control. Leading organizations are developing optical lattice clocks for next-generation time standards, implementing cryogenic atomic clock systems for quantum computing platforms, and advancing clock technologies that provide unprecedented frequency stability for fundamental physics research. These technologies improve scientific capabilities while enabling new application opportunities, including quantum communication networks, gravitational wave detection systems, and ultra-precise fundamental constant measurements. Advanced atomic clock integration also allows researchers to support comprehensive experimental objectives and scientific advancement beyond traditional timekeeping applications.
The expansion of portable electronics, autonomous vehicle navigation, and commercial space activities is driving demand for ultra-compact chip-scale atomic clocks with drastically reduced size-weight-power profiles and accessible price points compared to traditional atomic clock systems. These emerging commercial applications require miniaturized atomic clock designs with relaxed performance specifications that balance timing precision against cost constraints and power budget limitations, creating mainstream market segments with differentiated value propositions. Manufacturers are investing in high-volume production capabilities and design simplification initiatives to serve emerging commercial applications while supporting innovation in consumer electronics, automotive systems, and commercial satellite industries.
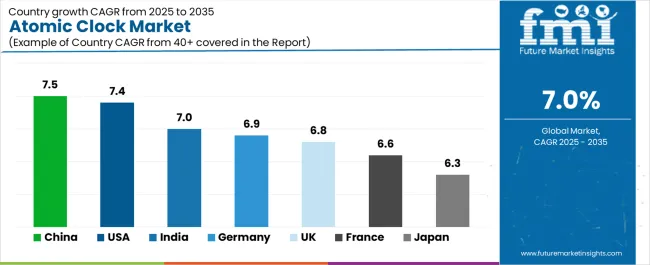
| Country | CAGR (2025-2035) |
|---|---|
| China | 7.5% |
| United States | 7.4% |
| India | 7% |
| Germany | 6.9% |
| United Kingdom | 6.8% |
| France | 6.6% |
| Japan | 6.3% |
The atomic clock market is experiencing solid growth globally, with China leading at a 7.5% CAGR through 2035, driven by expanding Beidou navigation system deployment, growing defense electronics modernization programs, and increasing investment in quantum computing research and space exploration initiatives. The United States follows at 7.4%, supported by extensive defense sector procurement, NASA deep-space mission requirements, and growing adoption in commercial telecommunications infrastructure. India shows growth at 7%, emphasizing NavIC satellite navigation system expansion, defense modernization programs, and space research organization initiatives. Germany demonstrates 6.9% growth, supported by aerospace industry requirements, Industry 4.0 automation timing needs, and Galileo satellite program participation. The United Kingdom records 6.8%, focusing on National Timing Centre development, financial sector timestamping applications, and defense procurement programs. France exhibits 6.6% growth, emphasizing aerospace leadership through Airbus and Thales programs, Galileo constellation operations, and telecommunications infrastructure modernization. Japan shows 6.3% growth, supported by satellite system development, precision metrology research, and defense technology advancement.
The report covers an in-depth analysis of 40+ countries, the top-performing countries are highlighted below.
Revenue from atomic clocks in China is projected to exhibit exceptional growth with a CAGR of 7.5% through 2035, driven by expanding Beidou satellite navigation system constellation and rapidly growing defense electronics sector supported by military modernization programs and strategic technology independence initiatives. The country's massive investment in space infrastructure and increasing commitment to quantum technology research are creating substantial demand for atomic clock solutions. Major aerospace manufacturers and defense electronics companies are establishing comprehensive atomic clock development capabilities to serve both domestic strategic requirements and export opportunities.
Revenue from atomic clocks in the United States is expanding at a CAGR of 7.4%, supported by the country's position as the global leader in defense technology development, extensive space exploration programs through NASA, and increasing demand for GPS-resilient timing solutions in military and critical infrastructure applications. The nation's comprehensive defense industrial base and technological innovation leadership are driving sophisticated atomic clock capabilities throughout military and civilian sectors. Leading aerospace contractors and telecommunications equipment manufacturers are establishing extensive research and production facilities to address growing domestic and allied nation demand.
Revenue from atomic clocks in India is expanding at a CAGR of 7%, supported by the country's NavIC regional navigation satellite system expansion, growing Indian Space Research Organisation mission portfolio, and defense sector modernization programs emphasizing indigenous technology development. The nation's strategic emphasis on space capabilities and defense independence is driving sophisticated atomic clock adoption throughout government research organizations and defense contractors. Leading space research centers and defense laboratories are investing extensively in atomic clock technologies and precision timing applications.
Revenue from atomic clocks in Germany is expanding at a CAGR of 6.9%, driven by the country's aerospace industry leadership through participation in Galileo satellite program, advanced manufacturing sector requirements for Industry 4.0 synchronization, and precision engineering capabilities supporting atomic clock development for specialized applications. Germany's technological excellence and industrial sophistication are driving demand for atomic clock solutions throughout aerospace and advanced manufacturing sectors. Leading aerospace companies and precision instrument manufacturers are establishing comprehensive development programs for next-generation atomic clock technologies.
Revenue from atomic clocks in the United Kingdom is expanding at a CAGR of 6.8%, supported by the country's National Timing Centre initiative for resilient timing infrastructure, extensive financial services sector requiring precise transaction timestamping, and defense procurement programs emphasizing GPS-independent capabilities. The nation's strategic emphasis on timing resilience and financial market leadership is driving demand for atomic clock technologies. Leading defense contractors and telecommunications infrastructure providers are investing in atomic clock deployment capabilities.
Revenue from atomic clocks in France is growing at a CAGR of 6.6%, driven by the country's aerospace industry leadership through Airbus and Thales programs, operational responsibility for Galileo satellite constellation management, and advanced telecommunications infrastructure modernization initiatives. France's aerospace excellence and telecommunications sophistication are supporting investment in advanced atomic clock technologies. Major aerospace manufacturers and telecommunications operators are establishing comprehensive atomic clock integration programs incorporating cutting-edge timing solutions.
Revenue from atomic clocks in Japan is growing at a CAGR of 6.3%, supported by the country's leadership in precision metrology standards, satellite system development programs through JAXA, and advanced electronics manufacturing requiring ultra-precise timing references. Japan's technological sophistication and quality excellence are driving demand for ultra-high-stability atomic clock products. Leading electronics manufacturers and space research organizations are investing in specialized capabilities for advanced atomic clock applications.
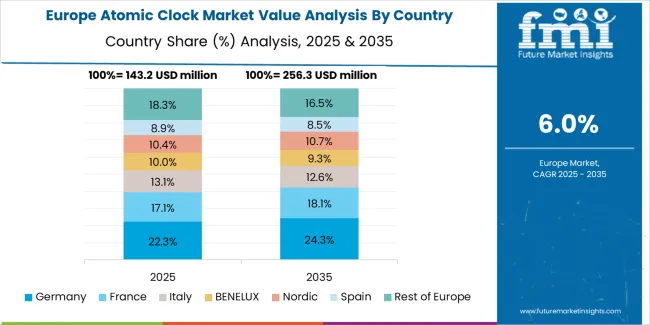
The atomic clock market in Europe is projected to grow from USD 170 million in 2025 to USD 339 million by 2035, registering a CAGR of 7.1% over the forecast period. Germany is expected to maintain leadership with a 27.5% market share in 2025, moderating to 26.8% by 2035, supported by aerospace industry participation in Galileo satellite program, Industry 4.0 manufacturing synchronization requirements, and precision engineering excellence.
France follows with 23% in 2025, projected at 23.5% by 2035, driven by aerospace leadership through Airbus and Thales programs, Galileo constellation operational management responsibilities, and telecommunications infrastructure modernization. The United Kingdom holds 21% in 2025, declining to 20.2% by 2035 due to post-Brexit defense procurement adjustments, while maintaining strength in National Timing Centre development and financial sector applications. Italy commands 14.5% in 2025, rising slightly to 14.8% by 2035, supported by European Space Agency participation and Ministry of Defence telecommunications mandates. Spain accounts for 7% in 2025, reaching 7.5% by 2035 aided by space research programs and telecommunications network modernization. The Rest of Europe region, including Nordic countries, Central & Eastern Europe, and other markets, is anticipated to hold 7% in 2025 and 7.2% by 2035, reflecting steady growth in quantum research initiatives and telecommunications infrastructure investments.
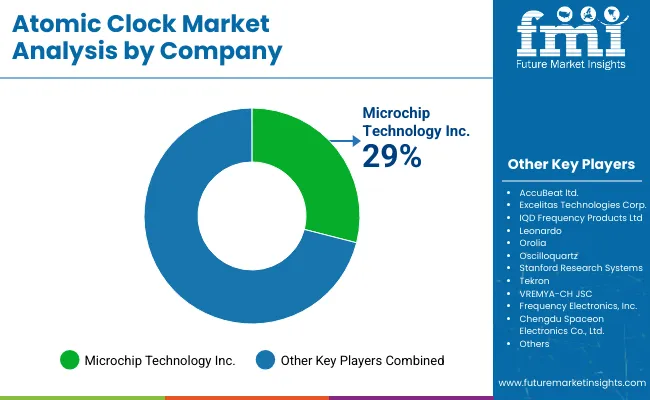
The atomic clock market is characterized by competition among established precision timing manufacturers, defense electronics specialists, and advanced research institutions commercializing breakthrough technologies. Companies are investing in miniaturization technology development, quantum clock research programs, product portfolio expansion, and application-specific design optimization to deliver high-performance, reliable, and cost-effective atomic clock solutions. Innovation in chip-scale atomic clock manufacturing, optical lattice clock development, and hybrid timing system architectures is central to strengthening market position and competitive advantage.
Microchip Technology Inc. leads the market with comprehensive atomic clock solutions including its Symmetricom and Microsemi product lines, offering rubidium and cesium atomic clocks with a focus on telecommunications synchronization, defense applications, and commercial timing systems across diverse operational environments. The company has established extensive manufacturing capabilities and continues investing in chip-scale atomic clock miniaturization programs. Orolia, a Safran Electronics & Defense company, provides innovative atomic clock solutions with emphasis on GPS-resilient timing systems, having advanced its Spectratime product portfolio with radiation-hardened designs for space applications and portable rubidium clocks for defense platforms.
Oscilloquartz, part of ADVA Optical Networking SE, delivers high-performance cesium atomic clocks with focus on telecommunications infrastructure and critical timing applications. AccuBeat Ltd. offers advanced rubidium atomic clock products with emphasis on compact designs and military applications. Leonardo SpA provides aerospace and defense timing solutions with comprehensive atomic clock offerings for satellite and aircraft systems. Stanford Research Systems specializes in scientific and research-grade atomic clocks for laboratory applications. T4Science SA focuses on space-qualified atomic clock development. IQD Frequency Products Ltd. offers timing components and compact atomic clock modules. VREMYA-CH JSC emphasizes Russian-designed atomic clock systems. CETC Navigation Techniques Co., Ltd. provides Beidou-compatible atomic timing solutions. Excelitas Technologies Corp. delivers precision timing products for defense and aerospace. Frequency Electronics, Inc. offers space and defense atomic clocks. Chengdu Spaceon Electronics Co., Ltd. specializes in satellite atomic clock systems.
Atomic clocks represent a critical precision timing technology segment within defense, aerospace, telecommunications, and scientific applications, projected to grow from USD 609 million in 2025 to USD 1,200 million by 2035 at a 7% CAGR. These ultra-precise timing devices—primarily rubidium, cesium, and hydrogen maser configurations—serve as essential timing references in satellite navigation systems, military platforms, telecommunications networks, and scientific research facilities where exceptional frequency stability, GPS-independent operation, and long-term timing accuracy are essential. Market expansion is driven by increasing defense modernization requirements, growing telecommunications synchronization demands, expanding space exploration programs, and rising adoption of quantum computing technologies across defense, aerospace, telecommunications, and scientific research sectors.
| Items | Values |
|---|---|
| Quantitative Units (2025) | USD 609 million |
| Product Type | Rubidium & Chip-Scale Atomic Clocks, Cesium Atomic Clocks, Hydrogen Maser Atomic Clocks |
| Application | Space & Military/Aerospace, Scientific & Metrology Research, Telecom & Broadcasting, Others |
| Regions Covered | North America, Europe, East Asia, South Asia, Latin America, Oceania, Middle East & Africa |
| Countries Covered | United States, China, India, Germany, United Kingdom, France, Japan, and 40+ countries |
| Key Companies Profiled | Microchip Technology Inc., Orolia, Oscilloquartz, AccuBeat Ltd., Leonardo SpA, Stanford Research Systems |
| Additional Attributes | Dollar sales by product type and application category, regional demand trends, competitive landscape, technological advancements in atomic clock development, miniaturization innovation, quantum clock research, and timing system integration optimization |
The global atomic clock market is estimated to be valued at USD 609.0 million in 2025.
The market size for the atomic clock market is projected to reach USD 1,198.0 million by 2035.
The atomic clock market is expected to grow at a 7.0% CAGR between 2025 and 2035.
The key product types in atomic clock market are rubidium & chip-scale atomic clocks, cesium atomic clocks and hydrogen maser atomic clocks.
In terms of application, space & military/aerospace segment to command 41.0% share in the atomic clock market in 2025.


Full Research Suite comprises of:
Market outlook & trends analysis
Interviews & case studies
Strategic recommendations
Vendor profiles & capabilities analysis
5-year forecasts
8 regions and 60+ country-level data splits
Market segment data splits
12 months of continuous data updates
DELIVERED AS:
PDF EXCEL ONLINE
Atomic Clock Oscillators Market Forecast and Outlook 2025 to 2035
Atomic System Clocks Market Forecast and Outlook 2025 to 2035
Atomic Absorption Spectroscopy Market Size and Share Forecast Outlook 2025 to 2035
Atomic Spectroscopy Market Size and Share Forecast Outlook 2025 to 2035
Atomic Layer Deposition (ALD) Equipment Market Growth - Trends & Forecast 2025 to 2035
Atomic Absorption Spectrometer Market Growth - Trends & Forecast 2025 to 2035
Anatomic Pathology Track and Trace Solution Market Size and Share Forecast Outlook 2025 to 2035
Anatomic Pathology Market Size and Share Forecast Outlook 2025 to 2035
Human Anatomical Models Market
PLL Clock Generator Market Size and Share Forecast Outlook 2025 to 2035
Optical Lattice Clock Market Size and Share Forecast Outlook 2025 to 2035
Wireless Synchronized Clocks Market Trends - Growth & Forecast 2025 to 2035
Strontium Optical Lattice Clock Market Size and Share Forecast Outlook 2025 to 2035

Thank you!
You will receive an email from our Business Development Manager. Please be sure to check your SPAM/JUNK folder too.
Chat With
MaRIA