Asia Pacific & Europe Tarpaulin Sheets Market Outlook (2023 to 2031)

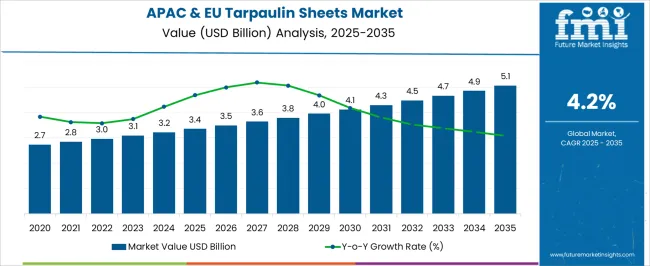
Asia Pacific & Europe tarpaulin sheets market size is expected to surge at a CAGR of 4.4% and 2.7% respectively in the next ten years. Asia Pacific is set to expand from US$ 3,079.5 million in 2023 to US$ 4,354.5 million by 2031.

Europe is anticipated to elevate from US$ 2,078.7 million in 2023 to US$ 2,571.3 million by 2031. Asia Pacific was valued at US$ 2,953.5 million at the end of 2022, and is set to exhibit y-o-y growth of 4.3% in 2023. Europe stood at US$ 2,026.0 million in 2022, and is predicted to showcase Y-o-Y growth of 2.6% in 2023.

Usage of tarpaulin sheets is widespread across various sectors, as they provide a cost-effective and efficient solution for protecting cargo from external elements during transportation & storage. Any expansion in sectors that rely on the use of tarpaulin sheets will undoubtedly result in a proportional increase in tarpaulin sheet sales over the projection period.

Asia Pacific market is projected to create an extraordinary incremental growth opportunity of US$ 1,401.0 million through 2031. It is predicted to expand 1.5 times its current value during the forecast period.

Europe market is likely to create an absolute dollar growth opportunity of US$ 545.3 million in the assessment period. It is anticipated to expand 1.3 times the current market value in the same time frame.

A few other factors pushing tarpaulin sheet demand in Asia Pacific and Europe:

  • Increasing construction activities and infrastructure projects in Asia Pacific and Europe are set to drive demand.
  • Growing need for temporary shelters and coverings in disaster-prone areas would push sales by 2031.
  • Expansion of the agriculture sector and demand for protective covers for crops & machinery are projected to drive the market.
  • Rising popularity of outdoor events and exhibitions, requiring temporary roofing and flooring solutions would support the market.
  • Demand for tarpaulin sheets in transportation and logistics for cargo protection is likely to propel demand.
  • Utilization in the manufacturing and industrial sector for covering & protecting raw materials and equipment would help the market to expand.
  • Rising use in camping, outdoor recreation, and DIY projects is anticipated to push sales.
Attributes Key Insights
Asia Pacific Tarpaulin Sheets Market Estimated Size (2031E) US$ 4,354.5 million
Europe Estimated Size (2031E) US$ 2,571.3 million
Asia Pacific Value-based CAGR (2023 to 2031) 4.4%
Europe Value-based CAGR (2023 to 2031) 2.7%
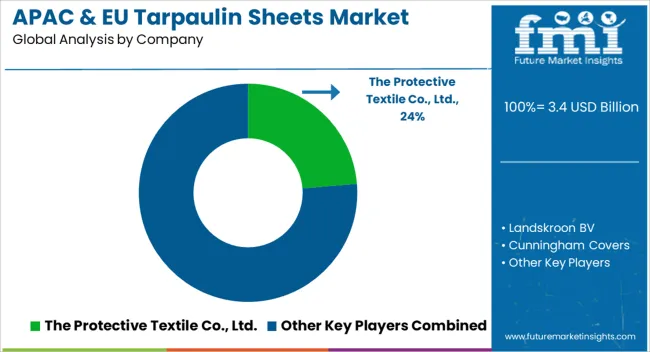
Collective Value Share: Top 5 Companies (2022A) 10% to 15%

Don't pay for what you don't need

Customize your report by selecting specific countries or regions and save 30%!

2015 to 2022 Tarpaulin Sheets Sales Outlook in Asia Pacific and Europe Compared to Demand Forecast from 2023 to 2031

Asia Pacific tarpaulin sheets market witnessed a CAGR of 3.3% during the historical period. It stood at a market value of US$ 2,953.5 million in 2022 from US$ 2,358.6 million in 2015.

Europe market showcased a CAGR of 1.6% from 2015 to 2022. It reached a market value of US$ 2,026.0 million in 2022 from US$ 1,817.2 million in 2015.

Growing populations in countries such as China, India, and Japan have led to a significant increase in demand for infrastructure development, housing, and commercial buildings. Rapid growth of the construction sector in these countries has led to a corresponding increase in the demand for tarpaulin sheets. Tarpaulin sheets are used in construction for covering scaffolding, creating temporary shelters, and protecting construction materials during transit & storage.

Expanding agriculture sector in Asia Pacific has also contributed to growth in the tarpaulin sheets industry. Increasing adoption of advanced farming techniques such as greenhouse farming, vertical farming, and hydroponics has led to a higher demand for tarpaulin sheets. Tarpaulin sheets are used in agriculture for covering crops, protecting them from external elements such as rain & sunlight, and creating temporary shelters for livestock.

Surging transportation and logistics sector in Europe has also contributed to growth. Tarpaulin sheets are widely used in this sector for covering goods during transit and storage, as well as protecting them from external elements such as rain and sunlight.

Adoption of advanced manufacturing processes has enabled manufacturers to produce high-quality tarpaulin sheets that meet specific needs of various sectors. A few of these processes include computer-aided design (CAD) and computer-aided manufacturing (CAM). This is a crucial factor that would push demand in the market.

Latest Asia Pacific & Europe Tarpaulin Sheets Market Trends Listed by Future Market Insights (FMI)

  • Rising Demand for Waterproof and Durable Materials in Transportation Sector to Propel Growth

Tarpaulin sheets are set to be widely used in the transportation sector to cover goods being transported by various modes of transport such as trucks, trains, cargo, and ships. As they provide protection from weather elements such as rain, snow, and wind, and prevent damage to the goods being transported, demand would rise.

Use of tarpaulin sheets ensures that the goods being transported arrive at their destination in good condition, thereby reducing the risk of damage and loss. Transportation in Europe is a crucial sector that plays a significant role in the economy by transporting goods across the continent and beyond. With increasing demand for efficient and secure transportation of goods, the region is set to showcase high growth.

Tarpaulin sheets are essential in protecting goods from harsh weather conditions, especially during transportation over long distances. In Europe, where there are frequent rain and snowstorms, tarpaulin sheets made of durable materials are highly preferred.

Sheets made of polyethylene, polypropylene, and PVC would gain momentum due to their resistance to water and chemicals. They also offer protection against theft and damage to goods during transportation. By covering the goods with tarpaulin sheets, the cargo is less visible to potential thieves, further reducing the chances of theft.

  • Expanding Construction Sector to Create Lucrative Growth Outlook

Tarpaulin sheets are used in various applications in the construction sector due to their ability to provide protection against weather elements, debris, and other hazards. Their ability to provide protection from weather elements would drive demand.

Tarpaulin sheets are widely used to cover building materials, machinery, and tools on construction sites, protecting them from rain, wind, and snow. This helps prevent damage to the materials and reduces the need for replacements and repairs, saving construction companies time and money.

Construction sites can be dangerous places for workers, and debris and dust can pose significant hazards to their health and safety. Tarpaulin sheets can be used to cover construction sites and protect workers and materials from debris, dust, and other hazards.

As per the International Trade Administration, China’s urbanization rate is among the highest in the world. Data from the American Institute of Architects (AIA) Shanghai reports that by 2025, China will have constructed the equivalent of 10 New York-sized cities.

China's infrastructure & construction development investment from 2021 to 2025 is estimated at US$ 4.2 trillion. It is projecting a significant growth outlook for the construction sector.

Construction sector is one of the largest consumers of tarpaulin sheets. Increasing demand for these sheets in the construction sector is boosting growth in the tarpaulin sheets industry.

Ismail Sutaria
Ismail Sutaria

Principal Consultant

Talk to Analyst

Find your sweet spots for generating winning opportunities in this market.

Country-wise Insights

Country China
Market Share (2023) 37.3%
Market Share (2031) 36.1%
BPS Analysis -120
Country India
Market Share (2023) 27.1%
Market Share (2031) 28.5%
BPS Analysis 150
Country Japan
Market Share (2023) 14.9%
Market Share (2031) 15.5%
BPS Analysis 60
Country South Korea
Market Share (2023) 5.0%
Market Share (2031) 4.2%
BPS Analysis -80
Country Association of Southeast Asian Nations Countries
Market Share (2023) 8.9%
Market Share (2031) 9.6%
BPS Analysis 70
Country Australia & New Zealand
Market Share (2023) 2.7%
Market Share (2031) 2.4%
BPS Analysis -30
Country Germany
Market Share (2023) 16.5%
Market Share (2031) 15.8%
BPS Analysis -70
Country Italy
Market Share (2023) 11.8%
Market Share (2031) 13.1%
BPS Analysis 130
Country France
Market Share (2023) 13.5%
Market Share (2031) 12.7%
BPS Analysis -80
Country United Kingdom
Market Share (2023) 10.9%
Market Share (2031) 12.1%
BPS Analysis 120
Country Spain
Market Share (2023) 7.6%
Market Share (2031) 7.1%
BPS Analysis -50
Country BENELUX
Market Share (2023) 5.5%
Market Share (2031) 6.1%
BPS Analysis 60
Country Nordics
Market Share (2023) 4.6%
Market Share (2031) 4.8%
BPS Analysis 30
Country Russia
Market Share (2023) 20.9%
Market Share (2031) 19.7%
BPS Analysis -120
Country Poland
Market Share (2023) 5.1%
Market Share (2031) 4.8%
BPS Analysis -30

Why is Tarpaulin Sheet Demand Rising Steadily in Germany?

Plastic Tarpaulin Sheets to Showcase High Demand in Construction Sector in Germany

According to the Federal Ministry of the Interior and Community, construction sector is one of the key sectors of the German economy. It generated an output of around US$ 500 billion in 2019, and is currently employing about 2 million people.

It is a crucial sector in terms of economic and employment policy, as it is closely interconnected with numerous other sectors such as manufacturing, energy, and transportation. Germany is expected to hold 15.8% of the tarpaulin sheets market share by the end of 2031.

Government of Germany works closely with the construction sector to promote innovation and modernization in the sector. The government also provides funding and support for research & development projects. These are aimed at improving the quality, efficiency, and sustainability of construction practices & materials.

With growth of the construction sector, there is a rising demand for tarpaulin sheets to protect construction materials, equipment, and other goods from weather elements. A few of these include rain, snow, and wind. Tarpaulin sheets are also widely used in the transportation of construction materials, as they provide protection and prevent damage during transit.

Would India Become a Prominent Hub for Tarpaulin Sheets Vendors?

Farmers across India to Adopt PE Tarpaulin Sheets by 2032

Demand for tarpaulin sheets in the agricultural sector is growing with the need to increase crop yields and reduce losses due to weather-related incidents. Tarpaulin sheets provide an affordable and effective solution to protect crops and livestock. It translates to increased productivity and profitability for farmers.

As per Press Information Bureau-Government of India, in 2022, India witnessed a remarkable milestone in its agricultural sector as exports reached an unprecedented record of US$ 50 billion. This historic achievement was primarily driven by exceptional performance in staple crops such as rice, wheat, sugar, other cereals, and meat, which experienced the highest levels of exportation ever recorded.

Agricultural sector of India is a significant contributor to the country's economy, accounting for around 16% of its GDP and employing around 50% of the country's workforce. The sector has been experiencing steady growth over the past few years.

It is mainly driven by factors such as rising demand for food, increasing population, and favorable government policies. Tarpaulin sheets are also used in the storage of agricultural produce such as fruits, vegetables, and grains.

Tarpaulin sheets help to keep the produce dry and protect it from pests & other contaminants. They ensure that the produce remains fresh and of high quality.

Category-wise Insights

Which is the Highly Preferred Material for Manufacturing Tarpaulin Sheets?

HDPE to Be Extensively Utilized for the Production of Waterproof Tarpaulin Sheets

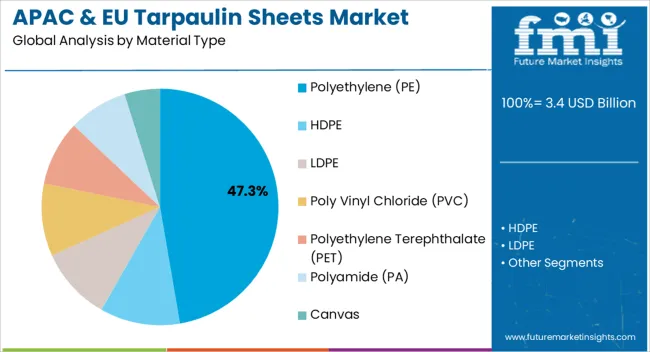
HDPE material is estimated to account for around 78.6% of the Europe tarpaulin sheets market by 2031. This material segment is expected to reach a valuation of US$ 848.2 million by 2031 in Asia Pacific.

Tarpaulin sheets made from high-density polyethylene (HDPE) have resistance to UV radiation. They are highly resistant to degradation caused by prolonged exposure to sunlight, making them ideal for outdoor use.

HDPE tarpaulin sheets are also lightweight, making them easy to handle and transport. It has excellent chemical resistance, which makes it resistant to several chemicals, including acids, alkalis, and solvents.

Its property makes tarpaulin sheets made up of high-density polyethylene (HDPE) suitable for use in harsh chemical environments such as agriculture and chemical sectors. Due to its excellent properties such as high tensile strength, resistance to tearing, and puncture, it is set to be an ideal choice for use in tarpaulin sheets manufacturing.

Who is the Leading End-user of Tarpaulin Sheets?

Tarpaulin Sheets to be Demanded from Agricultural Sector in Europe and Asia Pacific

By end use, the agriculture segment is projected to dominate the Asia Pacific & Europe tarpaulin sheets market. Asia Pacific and Europe are set to capture around 22.8% and 26.8% of share in 2031, respectively.

Tarpaulin sheets play a crucial role in crop protection across the agricultural sector. They serve as a versatile solution for shielding crops against pests, soil erosion, and adverse weather conditions.

Such protective sheets effectively safeguard crops from the detrimental effects of heavy rain and strong winds, preventing potential damage. Tarpaulin sheets find application in the establishment of greenhouses and shade houses, creating optimal environments for crop cultivation.

In the realm of agriculture storage, these sheets are utilized to cover hay and other agricultural products, safeguarding them against moisture and pests. Additionally, tarpaulin sheets are essential for covering silage pits, preserving the nutritional value of the silage and preventing spoilage.
Get the data you need at a Fraction of the cost

Personalize your report by choosing insights you need
and save 40%!

Competitive Landscape

Key companies in the Asia Pacific & Europe tarpaulin sheets market are concentrating on developing sustainable solutions and innovations. They are also seeking to execute the merger and acquisition strategy. In order to accommodate increasing demand, a few other firms are creating different products.

For instance:

  • Sintex Industries Limited is a prominent manufacturer and supplier of tarpaulin sheets in Asia Pacific. With a strong presence in the region, the company has established itself as a trusted provider of high-quality and durable tarpaulin products. The company's tarpaulin sheets are known for their excellent weather resistance, tear strength, and UV protection.
  • Sioen Industries is a leading manufacturer and supplier of tarpaulin sheets in Europe. It offers a wide range of tarpaulin sheets designed to meet the diverse needs of sectors such as construction, transportation, agriculture, and outdoor events.

Scope of the Report

Attribute Details
Asia Pacific Estimated Market Size (2023) US$ 3,079.5 million
Europe Estimated Market Size (2023) US$ 2,078.9 million
Asia Pacific Projected Market Valuation (2031) US$ 4,354.5 million
Europe Projected Market Valuation (2031) US$ 2,571.3 million
Asia Pacific Value-based CAGR (2023 to 2031) 4.4%
Europe Value-based CAGR (2023 to 2031) 2.7%
Historical Data 2015 to 2022
Forecast Period 2023 to 2031
Quantitative Units Value (US$ million)
Segments Covered Material Type, Product Type, Product Weight, Lamination Type, End-use, Country
Key Countries Covered China, India, Japan, South Korea, Association of Southeast Asian Nation Countries, Australia & New Zealand, Rest of Asia Pacific, Germany, Italy, France, United Kingdom, Spain, BENLUX, Nordics (Scandinavia), Russia, Poland, Rest of Europe
Key Companies Profiled The Protective Textile Co., Ltd.; Landskroon BV; Cunningham Covers; J Clemishaw 1870 Ltd; Harsh UK; Puyoung Industrial Corporation, Ltd.; Rhino Textile Products; Del Tarpaulins Ltd; TELFORD TARPAULINS; Schreiber S.A.; Schleswiger Tauwerkfabrik Oellerking GmbH & Co. KG; THRACE PLASTICS Co. S.A.; Tom Morrow Tarpaulins Ltd.; John Attwooll & Co (Tents) Ltd; Ponyvamester Ltd.; Baches de France; Hacom Trading B.V.; Mehler Texnologies (Freudenberg Performance Materials); Icopal (Monarflex); P + Z Planen und Zelte GmbH; Transcover; Verseidag-Indutex GmbH; Narmada Polyfab; Korea Tarpia Co., Ltd.; POLIPLAS GROUP
Report Coverage Revenue Forecast, Volume Forecast, Company Ranking, Competitive Landscape, Growth Factors, Trends and Pricing Analysis

Asia Pacific & Europe Tarpaulin Sheets Market Outlook by Category

By Material Type:

  • Polyethylene (PE)
  • HDPE
  • LDPE
  • Poly Vinyl Chloride (PVC)
  • Polyethylene Terephthalate (PET)
  • Polyamide (PA)
  • Canvas

By Product Type:

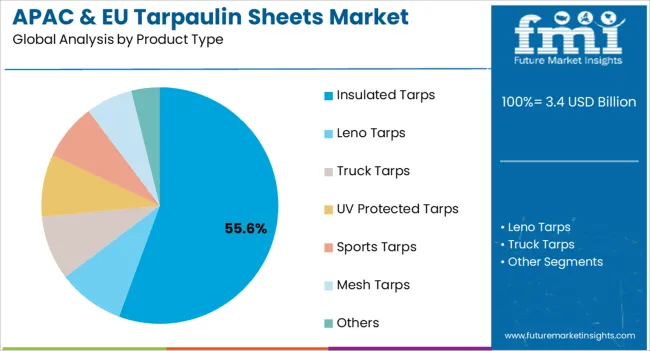
  • Insulated Tarps
  • Leno Tarps
  • Truck Tarps
  • UV Protected Tarps
  • Sports Tarps
  • Mesh Tarps
  • Others

By Product Weight:

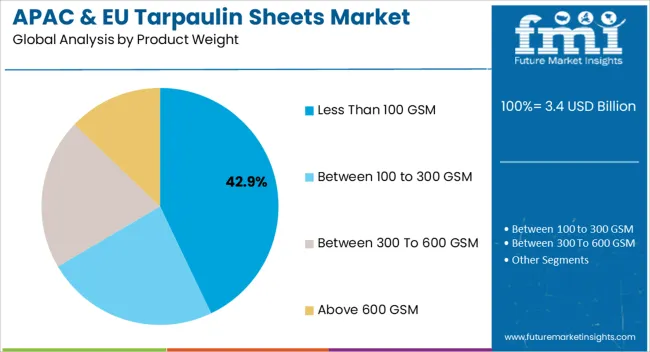
  • Less than 100 GSM
  • Between 100 to 300 GSM
  • Between 300 to 600 GSM
  • Above 600 GSM

By Lamination Type:

  • Up to 2 Layers
  • 3 Layers Laminate
  • 4 Layers Laminate
  • Above 4 Layers

By End-use:

  • Agriculture
  • Building and Construction
  • Scaffolding Industry
  • Automobiles
  • Storage, Warehousing, & Logistics
  • Transport
  • Consumer Goods
  • Others

By Country:

  • Asia Pacific
    • China
    • India
    • Japan
    • South Korea
    • Association of Southeast Asian Nations Countries
    • Australia & New Zealand
    • Rest of Asia Pacific
  • Europe
    • Germany
    • Italy
    • France
    • United Kingdom
    • Spain
    • BENLUX
    • Nordics (Scandinavia)
    • Russia
    • Poland
    • Rest of Europe

Frequently Asked Questions

What was the Asia Pacific & Europe tarpaulin sheets market size reported for 2022?

In 2022, the Asia Pacific & Europe tarpaulin sheets market was valued at US$ 2,953.5 million and US$ 2,026.0 million respectively.

What value is the Asia Pacific & Europe tarpaulin sheets industry estimated to reach in 2023?

Asia Pacific & Europe tarpaulin sheets industry is anticipated to reach a valuation of US$ 3,079.5 million and US$ 2,078.7 million respectively in 2023.

What is the Asia Pacific & Europe tarpaulin sheets industry valuation expected for 2031?

Asia Pacific & Europe tarpaulin sheets market valuation is expected to cross a valuation of US$ 4,354.5 million and US$ 2,571.3 million respectively in 2031.

What CAGR did the Asia Pacific & Europe tarpaulin sheets industry exhibit over the last 4 years?

Asia Pacific & Europe tarpaulin sheets industry exhibited 3.4% and 1.7% CAGR respectively over the last 4 years.

What is the projected CAGR for the Asia Pacific & Europe tarpaulin sheets industry from 2023 to 2031?

The projected CAGR for Asia Pacific & Europe tarpaulin sheets industry from 2023 to 2031 is 4.4% and 2.7% respectively.

Which material will garner significant value share by 2023?

The HDPE segment of Asia Pacific & Europe tarpaulin sheets industry is expected to garner significant value share by 2023.

Table of Content
1. Executive Summary
    1.1. Market Outlook
    1.2. Demand Side Trends
    1.3. Supply Side Trends
    1.4. Analysis and Recommendations
2. Market Overview
    2.1. Market Coverage
    2.2. Market Definition
3. Key Market Trends
    3.1. Key Trends Impacting the Market
    3.2. Product Innovation
4. Key Success Factors
    4.1. Product Adoption
    4.2. Product USPs
    4.3. Promotional Strategies
5. Market - Pricing Analysis
    5.1. Pricing Analysis By Material Type,
    5.2. Pricing Break-up
    5.3. Average Pricing Analysis Benchmark
6. Market Demand (Volume in Tons and Value in US$ Million) Analysis 2015 to 2022 and Forecast, 2023 to 2031
    6.1. Historical Market Value (US$ Million) & Volume (Tons) Analysis, 2015 to 2022
    6.2. Current and Future Market Value (US$ Million) & Volume (Tons) Projections, 2023 to 2031
        6.2.1. Y-o-Y Growth Trend Analysis
        6.2.2. Absolute $ Opportunity Analysis
7. Market Background
    7.1. Packaging Market Outlook
    7.2. Rigid Packaging Market Outlook
    7.3. Cost Tear Down Analysis
    7.4. Macro-Economic Factors
        7.4.1. GDP Growth Outlook
        7.4.2. Manufacture Value Added (MVA)
        7.4.3. Industrial Production
    7.5. Forecast Factors - Relevance & Impact
        7.5.1. Automotive Industry Growth
        7.5.2. Building & Construction Industry Growth
        7.5.3. Regional Manufacturing Value Added Growth
        7.5.4. Segmental Revenue Growth of Key Players
        7.5.5. Top Companies Historical Revenue Growth
    7.6. Value Chain
        7.6.1. Key Participants
            7.6.1.1. Raw Material Suppliers
            7.6.1.2. Manufacturers
            7.6.1.3. End-use Industry
        7.6.2. Profitability Margin
    7.7. Market Dynamics
        7.7.1. Drivers
        7.7.2. Restraints
        7.7.3. Opportunity Analysis
8. Covid-19 Impact Analysis
    8.1. Current Statistics and Probable Future Impact
    8.2. Impact of COVID-19 on Market
9. Market Analysis 2015 to 2022 and Forecast 2023 to 2031, by Product Type,
    9.1. Historical Market Size (US$ Million) and Volume (Tons) Analysis By Product Type, 2015 to 2022
    9.2. Current and Future Market Size (US$ Million) and Volume (Tons) Analysis and Forecast By Product Type, 2023 to 2031
        9.2.1. Insulated Tarps
        9.2.2. Leno Tarps
        9.2.3. Truck Tarps
        9.2.4. UV Protected Tarps
        9.2.5. Sports Tarps
        9.2.6. Mesh Tarps
        9.2.7. Others
    9.3. Market Attractiveness Analysis By Product Type,
10. Market Analysis 2015 to 2022 and Forecast 2023 to 2031, by Material Type,
    10.1. Historical Market Size (US$ Million) and Volume (Tons) Analysis By Packaging Material Type, 2015 to 2022
    10.2. Current and Future Market Size (US$ Million) and Volume (Tons) Analysis and Forecast By Material Type, 2023 to 2031
        10.2.1. Polyethylene (PE)
            10.2.1.1. HDPE
            10.2.1.2. LDPE
        10.2.2. Poly Vinyl Chloride (PVC)
        10.2.3. Polyethylene Terephthalate (PET)
        10.2.4. Polyamide (PA)
        10.2.5. Canvas
    10.3. Market Attractiveness Analysis By Material Type,
11. Market Analysis 2015 to 2022 and Forecast 2023 to 2031, by Product Type,
    11.1. Historical Market Size (US$ Million) and Volume (Tons) Analysis By Product Type, 2015 to 2022
    11.2. Current and Future Market Size (US$ Million) and Volume (Tons) Analysis and Forecast By Product Type, 2023 to 2031
        11.2.1. Insulated Tarps
        11.2.2. Leno Tarps
        11.2.3. Truck Tarps
        11.2.4. UV Protected Tarps
        11.2.5. Sports Tarps
        11.2.6. Mesh Tarps
        11.2.7. Others
    11.3. Market Attractiveness Analysis By Product Type,
12. Market Analysis 2015 to 2022 and Forecast 2023 to 2031, by Product Weight
    12.1. Historical Market Size (US$ Million) and Volume (Tons) Analysis By Product Weight, 2015 to 2022
    12.2. Current and Future Market Size (US$ Million) and Volume (Tons) Analysis and Forecast By Product Weight, 2023 to 2031
        12.2.1. Less than 100 GSM
        12.2.2. Between 100 to 300 GSM
        12.2.3. Between 300 to 600 GSM
        12.2.4. Above 600 GSM
    12.3. Market Attractiveness Analysis By Product Weight
13. Market Analysis 2015 to 2022 and Forecast 2023 to 2031, by Lamination Type,
    13.1. Historical Market Size (US$ Million) and Volume (Tons) Analysis By Lamination Type, 2015 to 2022
    13.2. Current Market Size (US$ Million) and Volume (Tons) Analysis and Forecast By Lamination Type, 2023 to 2031
        13.2.1. Upto 2 Layers
        13.2.2. 3 Layers Laminate
        13.2.3. 4 Layers Laminate
        13.2.4. Above 4 Layers
    13.3. Market Attractiveness Analysis By Lamination Type,
14. Market Analysis 2015 to 2022 and Forecast 2023 to 2031, by End-use
    14.1. Historical Market Size (US$ Million) and Volume (Tons) Analysis By End-use, 2015 to 2022
    14.2. Current Market Size (US$ Million) and Volume (Tons) Analysis and Forecast By End-use, 2023 to 2031
        14.2.1. Agriculture
        14.2.2. Building & Construction
        14.2.3. Scaffolding Industry
        14.2.4. Automobiles
        14.2.5. Storage, Warehousing & Logistics
        14.2.6. Transport
        14.2.7. Consumer Goods
        14.2.8. Others
    14.3. Market Attractiveness Analysis By End-use
15. Market Analysis 2015 to 2022 and Forecast 2023 to 2031, by Country
    15.1. Historical Market Size (US$ Million) and Volume (Tons) Analysis By Country, 2015 to 2022
    15.2. Current Market Size (US$ Million) and Volume (Tons) Analysis and Forecast By Country, 2023 to 2031
        15.2.1. Germany
        15.2.2. Italy
        15.2.3. France
        15.2.4. United Kingdom
        15.2.5. Spain
        15.2.6. BENLUX
        15.2.7. Nordics (Scandinavia)
        15.2.8. Russia
        15.2.9. Poland
        15.2.10. Rest of Europe
    15.3. Market Attractiveness Analysis By Country
16. Market Analysis 2015 to 2022 and Forecast 2023 to 2031, by Material Type,
    16.1. Historical Market Size (US$ Million) and Volume (Tons) Analysis By Packaging Material Type, 2015 to 2022
    16.2. Current and Future Market Size (US$ Million) and Volume (Tons) Analysis and Forecast By Material Type, 2023 to 2031
        16.2.1. Polyethylene (PE)
            16.2.1.1. HDPE
            16.2.1.2. LDPE
        16.2.2. Poly Vinyl Chloride (PVC)
        16.2.3. Polyethylene Terephthalate (PET)
        16.2.4. Polyamide (PA)
        16.2.5. Canvas
    16.3. Market Attractiveness Analysis By Material Type,
17. Market Analysis 2015 to 2022 and Forecast 2023 to 2031, by Product Type,
    17.1. Historical Market Size (US$ Million) and Volume (Tons) Analysis By Product Type, 2015 to 2022
    17.2. Current and Future Market Size (US$ Million) and Volume (Tons) Analysis and Forecast By Product Type, 2023 to 2031
        17.2.1. Insulated Tarps
        17.2.2. Leno Tarps
        17.2.3. Truck Tarps
        17.2.4. UV Protected Tarps
        17.2.5. Sports Tarps
        17.2.6. Mesh Tarps
        17.2.7. Others
    17.3. Market Attractiveness Analysis By Product Type,
18. Market Analysis 2015 to 2022 and Forecast 2023 to 2031, by Product Weight
    18.1. Historical Market Size (US$ Million) and Volume (Tons) Analysis By Product Weight, 2015 to 2022
    18.2. Current and Future Market Size (US$ Million) and Volume (Tons) Analysis and Forecast By Product Weight, 2023 to 2031
        18.2.1. Less than 100 GSM
        18.2.2. Between 100 to 300 GSM
        18.2.3. Between 300 to 600 GSM
        18.2.4. Above 600 GSM
    18.3. Market Attractiveness Analysis By Product Weight
19. Market Analysis 2015 to 2022 and Forecast 2023 to 2031, by Lamination Type,
    19.1. Historical Market Size (US$ Million) and Volume (Tons) Analysis By Lamination Type, 2015 to 2022
    19.2. Current Market Size (US$ Million) and Volume (Tons) Analysis and Forecast By Lamination Type, 2023 to 2031
        19.2.1. Upto 2 Layers
        19.2.2. 3 Layers Laminate
        19.2.3. 4 Layers Laminate
        19.2.4. Above 4 Layers
    19.3. Market Attractiveness Analysis By Lamination Type,
20. Market Analysis 2015 to 2022 and Forecast 2023 to 2031, by End-use
    20.1. Historical Market Size (US$ Million) and Volume (Tons) Analysis By End-use, 2015 to 2022
    20.2. Current Market Size (US$ Million) and Volume (Tons) Analysis and Forecast By End-use, 2023 to 2031
        20.2.1. Agriculture
        20.2.2. Building & Construction
        20.2.3. Scaffolding Industry
        20.2.4. Automobiles
        20.2.5. Storage, Warehousing & Logistics
        20.2.6. Transport
        20.2.7. Consumer Goods
        20.2.8. Others
    20.3. Market Attractiveness Analysis By End-use
21. Market Analysis 2015 to 2022 and Forecast 2023 to 2031, by Country
    21.1. Historical Market Size (US$ Million) and Volume (Tons) Analysis By Country, 2015 to 2022
    21.2. Current Market Size (US$ Million) and Volume (Tons) Analysis and Forecast By Country, 2023 to 2031
        21.2.1. China
        21.2.2. India
        21.2.3. Japan
        21.2.4. South Korea
        21.2.5. Association of Southeast Asian Nations Countries
        21.2.6. Australia & New Zealand
        21.2.7. Rest of Asia Pacific
    21.3. Market Attractiveness Analysis By Country
22. Market Country wise Analysis 2023 & 2031
    22.1. Germany MillionMarket Analysis
        22.1.1. Market Volume (Tons) and Value (US$ Million) Analysis and Forecast, by Market Taxonomy
            22.1.1.1. By Material Type,
            22.1.1.2. By Product Type,
            22.1.1.3. By Product Weight
            22.1.1.4. By Lamination Type,
            22.1.1.5. By End-use
    22.2. Italy MillionMarket Analysis
        22.2.1. Market Volume (Tons) and Value (US$ Million) Analysis and Forecast, by Market Taxonomy
            22.2.1.1. By Material Type,
            22.2.1.2. By Product Type,
            22.2.1.3. By Product Weight
            22.2.1.4. By Lamination Type,
            22.2.1.5. By End-use
    22.3. France MillionMarket Analysis
        22.3.1. Market Volume (Tons) and Value (US$ Million) Analysis and Forecast, by Market Taxonomy
            22.3.1.1. By Material Type,
            22.3.1.2. By Product Type,
            22.3.1.3. By Product Weight
            22.3.1.4. By Lamination Type,
            22.3.1.5. By End-use
    22.4. United Kingdom MillionMarket Analysis
        22.4.1. Market Volume (Tons) and Value (US$ Million) Analysis and Forecast, by Market Taxonomy
            22.4.1.1. By Material Type,
            22.4.1.2. By Product Type,
            22.4.1.3. By Product Weight
            22.4.1.4. By Lamination Type,
            22.4.1.5. By End-use
    22.5. Spain MillionMarket Analysis
        22.5.1. Market Volume (Tons) and Value (US$ Million) Analysis and Forecast, by Market Taxonomy
            22.5.1.1. By Material Type,
            22.5.1.2. By Product Type,
            22.5.1.3. By Product Weight
            22.5.1.4. By Lamination Type,
            22.5.1.5. By End-use
    22.6. Russia MillionMarket Analysis
        22.6.1. Market Volume (Tons) and Value (US$ Million) Analysis and Forecast, by Market Taxonomy
            22.6.1.1. By Material Type,
            22.6.1.2. By Product Type,
            22.6.1.3. By Product Weight
            22.6.1.4. By Lamination Type,
            22.6.1.5. By End-use
    22.7. Poland MillionMarket Analysis
        22.7.1. Market Volume (Tons) and Value (US$ Million) Analysis and Forecast, by Market Taxonomy
            22.7.1.1. By Material Type,
            22.7.1.2. By Product Type,
            22.7.1.3. By Product Weight
            22.7.1.4. By Lamination Type,
            22.7.1.5. By End-use
    22.8. Nordic MillionMarket Analysis
        22.8.1. Market Volume (Tons) and Value (US$ Million) Analysis and Forecast, by Market Taxonomy
            22.8.1.1. By Material Type,
            22.8.1.2. By Product Type,
            22.8.1.3. By Product Weight
            22.8.1.4. By Lamination Type,
            22.8.1.5. By End-use
    22.9. Benelux MillionMarket Analysis
        22.9.1. Market Volume (Tons) and Value (US$ Million) Analysis and Forecast, by Market Taxonomy
            22.9.1.1. By Material Type,
            22.9.1.2. By Product Type,
            22.9.1.3. By Product Weight
            22.9.1.4. By Lamination Type,
            22.9.1.5. By End-use
    22.10. China MillionMarket Analysis
        22.10.1. Market Volume (Tons) and Value (US$ Million) Analysis and Forecast, by Market Taxonomy
            22.10.1.1. By Material Type,
            22.10.1.2. By Product Type,
            22.10.1.3. By Product Weight
            22.10.1.4. By Lamination Type,
            22.10.1.5. By End-use
    22.11. India MillionMarket Analysis
        22.11.1. Market Volume (Tons) and Value (US$ Million) Analysis and Forecast, by Market Taxonomy
            22.11.1.1. By Material Type,
            22.11.1.2. By Product Type,
            22.11.1.3. By Product Weight
            22.11.1.4. By Lamination Type,
            22.11.1.5. By End-use
    22.12. Japan MillionMarket Analysis
        22.12.1. Market Volume (Tons) and Value (US$ Million) Analysis and Forecast, by Market Taxonomy
            22.12.1.1. By Material Type,
            22.12.1.2. By Product Type,
            22.12.1.3. By Product Weight
            22.12.1.4. By Lamination Type,
            22.12.1.5. By End-use
    22.13. South Korea MillionMarket Analysis
        22.13.1. Market Volume (Tons) and Value (US$ Million) Analysis and Forecast, by Market Taxonomy
            22.13.1.1. By Material Type,
            22.13.1.2. By Product Type,
            22.13.1.3. By Product Weight
            22.13.1.4. By Lamination Type,
            22.13.1.5. By End-use
23. Market Structure Analysis
    23.1. Market Analysis by Tier of Companies (Asia Pacific & Europe Tarpaulin Sheets)
    23.2. Market Concentration
    23.3. Market Share Analysis of Top Players
24. Competition Analysis
    24.1. Competition Dashboard
    24.2. Competition Deep Dive Europe & APAC based / operating Key Market Players
        24.2.1. The Protective Textile Co., Ltd.
            24.2.1.1. Overview
            24.2.1.2. Product Portfolio
            24.2.1.3. Profitability by Market Segments
            24.2.1.4. Sales Footprint
            24.2.1.5. Strategy Overview
        24.2.2. Landskroon BV
            24.2.2.1. Overview
            24.2.2.2. Product Portfolio
            24.2.2.3. Profitability by Market Segments
            24.2.2.4. Sales Footprint
            24.2.2.5. Strategy Overview
        24.2.3. Cunningham Covers
            24.2.3.1. Overview
            24.2.3.2. Product Portfolio
            24.2.3.3. Profitability by Market Segments
            24.2.3.4. Sales Footprint
            24.2.3.5. Strategy Overview
        24.2.4. J Clemishaw 1870 Ltd
            24.2.4.1. Overview
            24.2.4.2. Product Portfolio
            24.2.4.3. Profitability by Market Segments
            24.2.4.4. Sales Footprint
            24.2.4.5. Strategy Overview
        24.2.5. Harsh UK
            24.2.5.1. Overview
            24.2.5.2. Product Portfolio
            24.2.5.3. Profitability by Market Segments
            24.2.5.4. Sales Footprint
            24.2.5.5. Strategy Overview
        24.2.6. Del Tarpaulins Ltd
            24.2.6.1. Overview
            24.2.6.2. Product Portfolio
            24.2.6.3. Profitability by Market Segments
            24.2.6.4. Sales Footprint
            24.2.6.5. Strategy Overview
        24.2.7. TELFORD TARPAULINS
            24.2.7.1. Overview
            24.2.7.2. Product Portfolio
            24.2.7.3. Profitability by Market Segments
            24.2.7.4. Sales Footprint
            24.2.7.5. Strategy Overview
        24.2.8. Schreiber S.A.
            24.2.8.1. Overview
            24.2.8.2. Product Portfolio
            24.2.8.3. Profitability by Market Segments
            24.2.8.4. Sales Footprint
            24.2.8.5. Strategy Overview
        24.2.9. Schleswiger Tauwerkfabrik Oellerking GmbH & Co. KG
            24.2.9.1. Overview
            24.2.9.2. Product Portfolio
            24.2.9.3. Profitability by Market Segments
            24.2.9.4. Sales Footprint
            24.2.9.5. Strategy Overview
        24.2.10. THRACE PLASTICS Co. S.A.
            24.2.10.1. Overview
            24.2.10.2. Product Portfolio
            24.2.10.3. Profitability by Market Segments
            24.2.10.4. Sales Footprint
            24.2.10.5. Strategy Overview
        24.2.11. Tom Morrow Tarpaulins Ltd.
            24.2.11.1. Overview
            24.2.11.2. Product Portfolio
            24.2.11.3. Profitability by Market Segments
            24.2.11.4. Sales Footprint
            24.2.11.5. Strategy Overview
        24.2.12. John Attwooll & Co (Tents) Ltd
            24.2.12.1. Overview
            24.2.12.2. Product Portfolio
            24.2.12.3. Profitability by Market Segments
            24.2.12.4. Sales Footprint
            24.2.12.5. Strategy Overview
        24.2.13. Ponyvamester Ltd.
            24.2.13.1. Overview
            24.2.13.2. Product Portfolio
            24.2.13.3. Profitability by Market Segments
            24.2.13.4. Sales Footprint
            24.2.13.5. Strategy Overview
        24.2.14. Baches de France
            24.2.14.1. Overview
            24.2.14.2. Product Portfolio
            24.2.14.3. Profitability by Market Segments
            24.2.14.4. Sales Footprint
            24.2.14.5. Strategy Overview
        24.2.15. Hacom Trading B.V.
            24.2.15.1. Overview
            24.2.15.2. Product Portfolio
            24.2.15.3. Profitability by Market Segments
            24.2.15.4. Sales Footprint
            24.2.15.5. Strategy Overview
        24.2.16. Mehler Texnologies (Freudenberg Performance Materials)
            24.2.16.1. Overview
            24.2.16.2. Product Portfolio
            24.2.16.3. Profitability by Market Segments
            24.2.16.4. Sales Footprint
            24.2.16.5. Strategy Overview
        24.2.17. Icopal (Monarflex)
            24.2.17.1. Overview
            24.2.17.2. Product Portfolio
            24.2.17.3. Profitability by Market Segments
            24.2.17.4. Sales Footprint
            24.2.17.5. Strategy Overview
        24.2.18. P + Z Planen und Zelte GmbH
            24.2.18.1. Overview
            24.2.18.2. Product Portfolio
            24.2.18.3. Profitability by Market Segments
            24.2.18.4. Sales Footprint
            24.2.18.5. Strategy Overview
        24.2.19. Transcover
            24.2.19.1. Overview
            24.2.19.2. Product Portfolio
            24.2.19.3. Profitability by Market Segments
            24.2.19.4. Sales Footprint
            24.2.19.5. Strategy Overview
        24.2.20. Verseidag-Indutex GmbH
            24.2.20.1. Overview
            24.2.20.2. Product Portfolio
            24.2.20.3. Profitability by Market Segments
            24.2.20.4. Sales Footprint
            24.2.20.5. Strategy Overview
        24.2.21. Narmada Polyfab
            24.2.21.1. Overview
            24.2.21.2. Product Portfolio
            24.2.21.3. Profitability by Market Segments
            24.2.21.4. Sales Footprint
            24.2.21.5. Strategy Overview
        24.2.22. Korea Tarpia Co., Ltd.
            24.2.22.1. Overview
            24.2.22.2. Product Portfolio
            24.2.22.3. Profitability by Market Segments
            24.2.22.4. Sales Footprint
            24.2.22.5. Strategy Overview
        24.2.23. POLIPLAS GROUP
            24.2.23.1. Overview
            24.2.23.2. Product Portfolio
            24.2.23.3. Profitability by Market Segments
            24.2.23.4. Sales Footprint
            24.2.23.5. Strategy Overview
 *The above list is indicative in nature and is subject to change during the course of research and may not be final
25. Assumptions and Acronyms Used
26. Research Methodology
Recommendations

Packaging

Plastic Corrugated Sheets Market

February 2023

REP-GB-13953

214 pages

Packaging

Tarpaulin Sheets Market

January 2023

REP-GB-5420

283 pages

Packaging

UV Protected Tarpaulin Sheets Market

July 2021

REP-GB-13576

250 pages

Explore Packaging Insights

View Reports
Future Market Insights

Asia Pacific and Europe Tarpaulin Sheets Market

Schedule a Call