Artificial Ventilation and Anaesthesia Masks Market Size and Share Forecast Outlook (2022 to 2032)

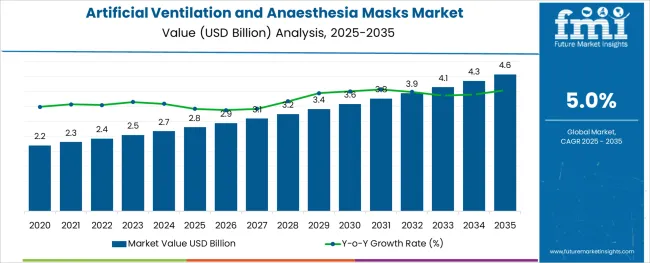
In 2021, the Global Artificial Ventilation and Anaesthesia Masks market were estimated to be worth around USD 2.3 billion. With the increasing expenditure incurred on Artificial Ventilation and Anaesthesia Masks worldwide recently, the market is expected to reach a worth of about USD 3.9 billion by the end of 2032, with a projected CAGR of 5.0% from 2022 to 2032. From 2017 to 2021, the Artificial Ventilation and Anaesthesia Masks Market experienced a growth of 5.7%.

Attributes Details
Global Artificial Ventilation and Anaesthesia Masks Market Size (2021) USD 2.3 billion
Global Artificial Ventilation and Anaesthesia Masks Market Size (2022) USD 2.4 billion
Projected Market Value (2032) USD 3.9 billion
Global Market Growth Rate (2022 to 2032) 5% CAGR
United States Growth Rate (2022 to 2032) 4.8% CAGR
Key Companies Profiled CareFusion Corporation; Air Liquide Healthcare; Koninklijke Philips N.V.; Fisher and Paykel Healthcare; ResMed; Ambu A/S; Hamilton Medical; Acutronic Medical Systems; GaleMed; HOFFRICHTER GmbH; Dragerwerk SA

More than 50% of patients admitted to an intensive care unit (ICU) receive a treatment involving Artificial Ventilation and Anaesthesia Masks. The rising geriatric population is one of the key factors boosting the artificial ventilation and anaesthesia masks market. In 2012, the United Nations projected the geriatric population to rise to over 2 billion by 2050. A rise in the geriatric population often increases chronic diseases such as sleep apnea devices, cancer, COPD, kidney failure, and coronary artery diseases. This boosts the demand for surgical procedures, and in turn, increases the artificial ventilation and anaesthesia masks.

The artificial ventilation and anaesthesia mask market is also boosted by the increasing number of COPD patients. The disease is likely to be the third leading cause of death globally as estimated by WHO. Around 12.7 million adults have been reported to have COPD in the USA alone. The growing need for long-term home care and emergency treatment for lung diseases in adults as well as children is expected to boost demand for artificial ventilation and anaesthesia masks in the near future.

The demand for Artificial Ventilators has increased due to the availability of both, invasive and non-invasive ventilators in the market. Similarly, anaesthesia masks are also available for different cases like full face masks, nasal masks, hybrid masks, oral masks, nasal pillows etc. However, the high cost of artificial ventilation in healthcare is expected to slow the growth of the market in certain developing nations.

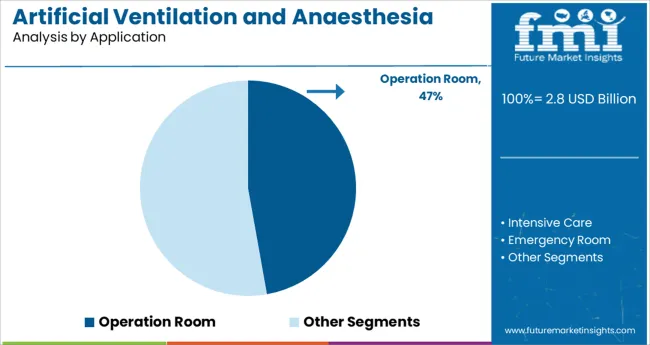
Artificial Ventilation and Anaesthesia Masks are used most in operation rooms and account for 51.7% of the market share. From 2017 to 2021, the use of Artificial Ventilation and Anaesthesia Masks in operation rooms has increased with a CAGR of 5.5% and is expected to experience a CAGR of 4.8% in the next ten years, from 2022 to 2032. This is largely due to various policies implemented by governments worldwide to make public healthcare accessible to everyone. Every year, more than 340 million operations are performed worldwide, providing huge opportunities for the Artificial Ventilation and Anaesthesia Masks Market.

Recently, the demand for Artificial Ventilation and Anaesthesia Masks are increasing due to their increasing use in-home care. Especially during the pandemic, when most patients wanted to avoid hospitals.

Artificial Ventilation and Anaesthesia Masks Industry Analysis by Top Investment Regions

Which region holds the largest market for Artificial Ventilation and Anaesthesia Masks market?

North America holds the largest market for Artificial Ventilation and Anaesthesia Masks. From 2017 to 2021, the North American Artificial Ventilation and Anaesthesia Masks market experienced a CAGR of 5.3% and is projected to see a CAGR of 4.7% in the next ten years.

According to a study an American is expected to get seven operations done on average in his or her entire lifetime and the number of the USA patients who get any kind of complication from surgery is around 1.5 million thus, increasing the demand for Artificial Ventilation and Anaesthesia Masks.

Another key driving factor in the North American Artificial Ventilation and Anaesthesia Masks Market is the increasing rates of chronic diseases and surgeries in Canada. Approximately 31 out of 100,000 Canadians die from chronic respiratory diseases, as per 2020 reports. And around 2 million surgeries are performed in Canada every year. All these factors are driving the Artificial Ventilation and Anaesthesia Masks Market in North America.
Analysis of Top Countries Producing, Formulating, Distributing, and Utilizing Artificial Ventilation and Anaesthesia Masks

The USA Artificial Ventilation and Anaesthesia Masks Market

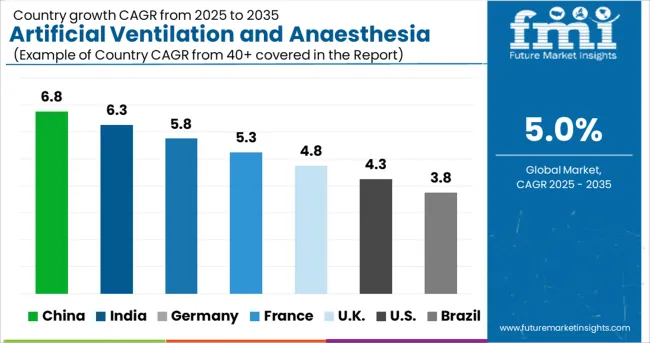
The United States has the largest market for Artificial Ventilation and Anaesthesia Masks, which is projected to reach a valuation of USD 1.4 billion by 2032. From 2017 to 2021, the market in the United States grew at a CAGR of 4.8%. Between 2022 and 2032, the United States is expected to be a market with a USD 509.3 million absolute dollar opportunity.

In the United States, every year 5 million people are admitted to ICUs. The number of Americans that were affected by chronic sleep disorders as per a report published by the National Sleep Foundation in 2012. This is expected to increase the demand for Ventilation Equipment and Anaesthesia Masks in the next ten years as these patients are more likely to visit the emergency department and intensive care unit.

Another reason which is helping in boosting the United States Artificial Ventilation and Anaesthesia masks Market is the introduction of The Affordable Care Act by The United States as more patients are now encouraged to opt for surgical treatments.

China Artificial Ventilation and Anaesthesia Masks Market

China’s market is still in the budding stage. China’s Market is projected to reach a valuation of USD 280.4 million by 2032. From 2017 to 2021, the market in China grew at a CAGR of 4.3%. Between 2022 and 2032, China is expected to be a market with a USD 96.8 million absolute dollar opportunity. In 2020, critical care artificial ventilators and anaesthesia masks made up more than 70% of the overall artificial ventilators and anaesthesia masks market in China.

A key reason for the growth of the Artificial Ventilation and Anaesthesia Masks Market in China is the growing older population in the country. The older population in China is expected to reach 198 million by the year 2025, as per the United States Census Bureau. This provides ample opportunities for players in the Artificial Ventilation and Anaesthesia Masks Market. China also exported the most number of Artificial Ventilators and Anaesthesia Masks worldwide, during the pandemic. China exported 16,000 artificial ventilators and anaesthesia masks in just one month during the pandemic.

In 2021, the leading players in China’s Artificial Ventilation and Anaesthesia Masks were Getinge AB, Dragerwerk AG & Co KGaA, Nihon Kohden Corp and Hamilton Medical AG.

Japan Artificial Ventilation and Anaesthesia Masks Market

The Market for Artificial Ventilation and Anaesthesia Market in Japan is expected to experience a CAGR of 3.4% in the next ten years with an absolute dollar opportunity of USD 64.8 million. By 2032, the Japanese market for Artificial Ventilation and Anaesthesia Market is expected to be worth USD 226.1 million.
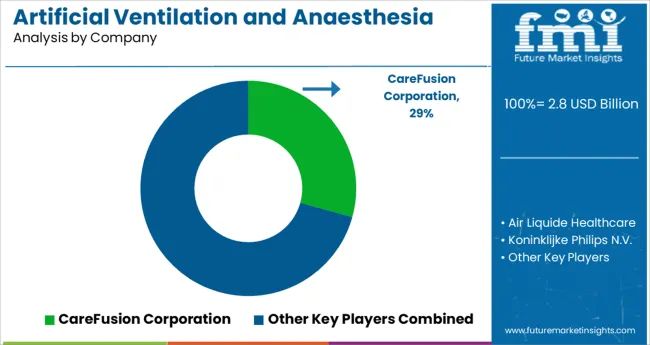
Leading Suppliers of Artificial Ventilation and Anaesthesia Masks

Artificial Ventilation and Anaesthesia Masks market is moderately competitive and has numerous players. Many key companies are now focusing on collaborating on new research and development activities.

The key companies operating in the Artificial Ventilation and Anaesthesia Masks Market are CareFusion Corporation, Air Liquide Healthcare, Koninklijke Philips N.V., Fisher and Paykel Healthcare, ResMed, Ambu A/S, Acutronic Medical Systems, GaleMed, HOFFRICHTER GmbH and Dragerwerk SA.

Some of the recent developments by the key providers of Artificial Ventilation and Anaesthesia Masks are as follows:

  • In November 2020, Besmed launched FitMax CPAP Face Mask a new anaesthetic gas mask. According to the manufacturer, this mask is for those people who cannot find adequate comfort with full-face or nasal masks.
  • In April 2020, the NKV-550 series ventilator can now be produced and sold in Japan, according to a statement from the Nihon Kohden Group. In 2019, the Nihon Kohden Group introduced the NKV-550 series ventilator, which is sold to hospitals across the world.
  • In July 2019, a novel anaesthesia mask dubbed Nuflow single-use cannulas for high-flow oxygen therapy in newborns was introduced, according to Hamilton Medical.
  • In March 2019, to combine the MedFusion 4000 wireless syringe infusion pumps, Smiths Medical announced its partnership with HCA Capital Division.

Top Segments Studied in the Artificial Ventilation and Anaesthesia Masks Market Research Report

Artificial Ventilation and Anaesthesia Masks Market by Application:

  • Operation Room
  • Intensive Care Unit
  • Emergency Room
  • Dental
  • Home Care

Artificial Ventilation and Anaesthesia Masks Market by Risk of the Procedure:

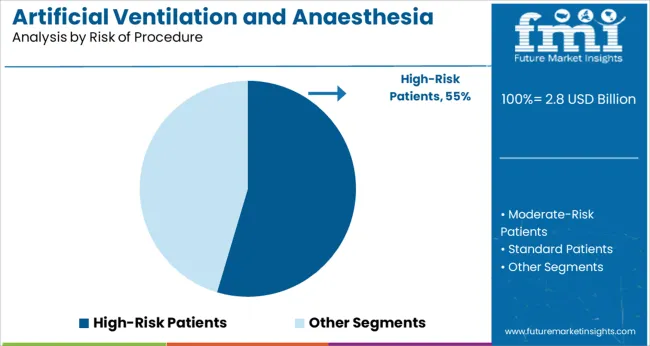
  • High Risk Patients
  • Moderate Risk
  • Standard Patients

Artificial Ventilation and Anaesthesia Masks Market by Region:

  • North America
  • Europe
  • APAC
  • Middle East and Africa (MEA)
  • Latin America

Table of Content

  • 1. Executive Summary
  • 2. Market Overview
  • 3. Market Background
  • 4. Global Market Analysis 2017 to 2021 and Forecast, 2022 to 2032
  • 5. Global Market Analysis 2017 to 2021 and Forecast 2022 to 2032, By Application
    • 5.1. Operation Room
    • 5.2. Intensive Care (Value in USD million & Volume in Units)
    • 5.3. Emergency Room
    • 5.4. Dental
    • 5.5. Home Care
  • 6. Global Market Analysis 2017 to 2021 and Forecast 2022 to 2032, By Risk of Procedure
    • 6.1. High-Risk Patients
    • 6.2. Moderate-Risk Patients
    • 6.3. Standard Patients
  • 7. Global Market Analysis 2017 to 2021 and Forecast 2022 to 2032, By Region
    • 7.1. North America
    • 7.2. Latin America
    • 7.3. Europe
    • 7.4. East Asia
    • 7.5. South Asia
    • 7.6. Oceania
    • 7.7. Middle East and Africa (MEA)
  • 8. North America Market Analysis 2017 to 2021 and Forecast 2022 to 2032, By Country
  • 9. Latin America Market Analysis 2017 to 2021 and Forecast 2022 to 2032, By Country
  • 10. Europe Market Analysis 2017 to 2021 and Forecast 2022 to 2032, By Country
  • 11. East Asia Market Analysis 2017 to 2021 and Forecast 2022 to 2032, By Country
  • 12. South Asia Market Analysis 2017 to 2021 and Forecast 2022 to 2032, By Country
  • 13. Oceania Market Analysis 2017 to 2021 and Forecast 2022 to 2032, By Country
  • 14. MEA Market Analysis 2017 to 2021 and Forecast 2022 to 2032, By Country
  • 15. Key Countries Market Analysis
  • 16. Market Structure Analysis
  • 17. Competition Analysis
    • 17.1. CareFusion Corporation
    • 17.2. Air Liquide Healthcare
    • 17.3. Koninklijke Philips N.V.
    • 17.4. Fisher and Paykel Healthcare
    • 17.5. ResMed
    • 17.6. Dragerwerk SA
    • 17.7. Hamilton Medical
    • 17.8. Acutronic Medical Systems
    • 17.9. GaleMed
    • 17.10. HOFFRICHTER GmbH
    • 17.11. Ambu A/S
  • 18. Assumptions & Acronyms Used
  • 19. Research Methodology

List of Tables

Table 1: Global Market Value (US$ million) Forecast by Region, 2017 to 2032

Table 2: Global Market Volume (Units) Forecast by Region, 2017 to 2032

Table 3: Global Market Value (US$ million) Forecast by Application, 2017 to 2032

Table 4: Global Market Volume (Units) Forecast by Application, 2017 to 2032

Table 5: Global Market Value (US$ million) Forecast by Risk of Procedure, 2017 to 2032

Table 6: Global Market Volume (Units) Forecast by Risk of Procedure, 2017 to 2032

Table 7: North America Market Value (US$ million) Forecast by Country, 2017 to 2032

Table 8: North America Market Volume (Units) Forecast by Country, 2017 to 2032

Table 9: North America Market Value (US$ million) Forecast by Application, 2017 to 2032

Table 10: North America Market Volume (Units) Forecast by Application, 2017 to 2032

Table 11: North America Market Value (US$ million) Forecast by Risk of Procedure, 2017 to 2032

Table 12: North America Market Volume (Units) Forecast by Risk of Procedure, 2017 to 2032

Table 13: Latin America Market Value (US$ million) Forecast by Country, 2017 to 2032

Table 14: Latin America Market Volume (Units) Forecast by Country, 2017 to 2032

Table 15: Latin America Market Value (US$ million) Forecast by Application, 2017 to 2032

Table 16: Latin America Market Volume (Units) Forecast by Application, 2017 to 2032

Table 17: Latin America Market Value (US$ million) Forecast by Risk of Procedure, 2017 to 2032

Table 18: Latin America Market Volume (Units) Forecast by Risk of Procedure, 2017 to 2032

Table 19: Europe Market Value (US$ million) Forecast by Country, 2017 to 2032

Table 20: Europe Market Volume (Units) Forecast by Country, 2017 to 2032

Table 21: Europe Market Value (US$ million) Forecast by Application, 2017 to 2032

Table 22: Europe Market Volume (Units) Forecast by Application, 2017 to 2032

Table 23: Europe Market Value (US$ million) Forecast by Risk of Procedure, 2017 to 2032

Table 24: Europe Market Volume (Units) Forecast by Risk of Procedure, 2017 to 2032

Table 25: East Asia Market Value (US$ million) Forecast by Country, 2017 to 2032

Table 26: East Asia Market Volume (Units) Forecast by Country, 2017 to 2032

Table 27: East Asia Market Value (US$ million) Forecast by Application, 2017 to 2032

Table 28: East Asia Market Volume (Units) Forecast by Application, 2017 to 2032

Table 29: East Asia Market Value (US$ million) Forecast by Risk of Procedure, 2017 to 2032

Table 30: East Asia Market Volume (Units) Forecast by Risk of Procedure, 2017 to 2032

Table 31: South Asia Market Value (US$ million) Forecast by Country, 2017 to 2032

Table 32: South Asia Market Volume (Units) Forecast by Country, 2017 to 2032

Table 33: South Asia Market Value (US$ million) Forecast by Application, 2017 to 2032

Table 34: South Asia Market Volume (Units) Forecast by Application, 2017 to 2032

Table 35: South Asia Market Value (US$ million) Forecast by Risk of Procedure, 2017 to 2032

Table 36: South Asia Market Volume (Units) Forecast by Risk of Procedure, 2017 to 2032

Table 37: Oceania Market Value (US$ million) Forecast by Country, 2017 to 2032

Table 38: Oceania Market Volume (Units) Forecast by Country, 2017 to 2032

Table 39: Oceania Market Value (US$ million) Forecast by Application, 2017 to 2032

Table 40: Oceania Market Volume (Units) Forecast by Application, 2017 to 2032

Table 41: Oceania Market Value (US$ million) Forecast by Risk of Procedure, 2017 to 2032

Table 42: Oceania Market Volume (Units) Forecast by Risk of Procedure, 2017 to 2032

Table 43: MEA Market Value (US$ million) Forecast by Country, 2017 to 2032

Table 44: MEA Market Volume (Units) Forecast by Country, 2017 to 2032

Table 45: MEA Market Value (US$ million) Forecast by Application, 2017 to 2032

Table 46: MEA Market Volume (Units) Forecast by Application, 2017 to 2032

Table 47: MEA Market Value (US$ million) Forecast by Risk of Procedure, 2017 to 2032

Table 48: MEA Market Volume (Units) Forecast by Risk of Procedure, 2017 to 2032

List of Figures

Figure 1: Global Market Value (US$ million) by Application, 2022 to 2032

Figure 2: Global Market Value (US$ million) by Risk of Procedure, 2022 to 2032

Figure 3: Global Market Value (US$ million) by Region, 2022 to 2032

Figure 4: Global Market Value (US$ million) Analysis by Region, 2017 to 2032

Figure 5: Global Market Volume (Units) Analysis by Region, 2017 to 2032

Figure 6: Global Market Value Share (%) and BPS Analysis by Region, 2022 to 2032

Figure 7: Global Market Y-o-Y Growth (%) Projections by Region, 2022 to 2032

Figure 8: Global Market Value (US$ million) Analysis by Application, 2017 to 2032

Figure 9: Global Market Volume (Units) Analysis by Application, 2017 to 2032

Figure 10: Global Market Value Share (%) and BPS Analysis by Application, 2022 to 2032

Figure 11: Global Market Y-o-Y Growth (%) Projections by Application, 2022 to 2032

Figure 12: Global Market Value (US$ million) Analysis by Risk of Procedure, 2017 to 2032

Figure 13: Global Market Volume (Units) Analysis by Risk of Procedure, 2017 to 2032

Figure 14: Global Market Value Share (%) and BPS Analysis by Risk of Procedure, 2022 to 2032

Figure 15: Global Market Y-o-Y Growth (%) Projections by Risk of Procedure, 2022 to 2032

Figure 16: Global Market Attractiveness by Application, 2022 to 2032

Figure 17: Global Market Attractiveness by Risk of Procedure, 2022 to 2032

Figure 18: Global Market Attractiveness by Region, 2022 to 2032

Figure 19: North America Market Value (US$ million) by Application, 2022 to 2032

Figure 20: North America Market Value (US$ million) by Risk of Procedure, 2022 to 2032

Figure 21: North America Market Value (US$ million) by Country, 2022 to 2032

Figure 22: North America Market Value (US$ million) Analysis by Country, 2017 to 2032

Figure 23: North America Market Volume (Units) Analysis by Country, 2017 to 2032

Figure 24: North America Market Value Share (%) and BPS Analysis by Country, 2022 to 2032

Figure 25: North America Market Y-o-Y Growth (%) Projections by Country, 2022 to 2032

Figure 26: North America Market Value (US$ million) Analysis by Application, 2017 to 2032

Figure 27: North America Market Volume (Units) Analysis by Application, 2017 to 2032

Figure 28: North America Market Value Share (%) and BPS Analysis by Application, 2022 to 2032

Figure 29: North America Market Y-o-Y Growth (%) Projections by Application, 2022 to 2032

Figure 30: North America Market Value (US$ million) Analysis by Risk of Procedure, 2017 to 2032

Figure 31: North America Market Volume (Units) Analysis by Risk of Procedure, 2017 to 2032

Figure 32: North America Market Value Share (%) and BPS Analysis by Risk of Procedure, 2022 to 2032

Figure 33: North America Market Y-o-Y Growth (%) Projections by Risk of Procedure, 2022 to 2032

Figure 34: North America Market Attractiveness by Application, 2022 to 2032

Figure 35: North America Market Attractiveness by Risk of Procedure, 2022 to 2032

Figure 36: North America Market Attractiveness by Country, 2022 to 2032

Figure 37: Latin America Market Value (US$ million) by Application, 2022 to 2032

Figure 38: Latin America Market Value (US$ million) by Risk of Procedure, 2022 to 2032

Figure 39: Latin America Market Value (US$ million) by Country, 2022 to 2032

Figure 40: Latin America Market Value (US$ million) Analysis by Country, 2017 to 2032

Figure 41: Latin America Market Volume (Units) Analysis by Country, 2017 to 2032

Figure 42: Latin America Market Value Share (%) and BPS Analysis by Country, 2022 to 2032

Figure 43: Latin America Market Y-o-Y Growth (%) Projections by Country, 2022 to 2032

Figure 44: Latin America Market Value (US$ million) Analysis by Application, 2017 to 2032

Figure 45: Latin America Market Volume (Units) Analysis by Application, 2017 to 2032

Figure 46: Latin America Market Value Share (%) and BPS Analysis by Application, 2022 to 2032

Figure 47: Latin America Market Y-o-Y Growth (%) Projections by Application, 2022 to 2032

Figure 48: Latin America Market Value (US$ million) Analysis by Risk of Procedure, 2017 to 2032

Figure 49: Latin America Market Volume (Units) Analysis by Risk of Procedure, 2017 to 2032

Figure 50: Latin America Market Value Share (%) and BPS Analysis by Risk of Procedure, 2022 to 2032

Figure 51: Latin America Market Y-o-Y Growth (%) Projections by Risk of Procedure, 2022 to 2032

Figure 52: Latin America Market Attractiveness by Application, 2022 to 2032

Figure 53: Latin America Market Attractiveness by Risk of Procedure, 2022 to 2032

Figure 54: Latin America Market Attractiveness by Country, 2022 to 2032

Figure 55: Europe Market Value (US$ million) by Application, 2022 to 2032

Figure 56: Europe Market Value (US$ million) by Risk of Procedure, 2022 to 2032

Figure 57: Europe Market Value (US$ million) by Country, 2022 to 2032

Figure 58: Europe Market Value (US$ million) Analysis by Country, 2017 to 2032

Figure 59: Europe Market Volume (Units) Analysis by Country, 2017 to 2032

Figure 60: Europe Market Value Share (%) and BPS Analysis by Country, 2022 to 2032

Figure 61: Europe Market Y-o-Y Growth (%) Projections by Country, 2022 to 2032

Figure 62: Europe Market Value (US$ million) Analysis by Application, 2017 to 2032

Figure 63: Europe Market Volume (Units) Analysis by Application, 2017 to 2032

Figure 64: Europe Market Value Share (%) and BPS Analysis by Application, 2022 to 2032

Figure 65: Europe Market Y-o-Y Growth (%) Projections by Application, 2022 to 2032

Figure 66: Europe Market Value (US$ million) Analysis by Risk of Procedure, 2017 to 2032

Figure 67: Europe Market Volume (Units) Analysis by Risk of Procedure, 2017 to 2032

Figure 68: Europe Market Value Share (%) and BPS Analysis by Risk of Procedure, 2022 to 2032

Figure 69: Europe Market Y-o-Y Growth (%) Projections by Risk of Procedure, 2022 to 2032

Figure 70: Europe Market Attractiveness by Application, 2022 to 2032

Figure 71: Europe Market Attractiveness by Risk of Procedure, 2022 to 2032

Figure 72: Europe Market Attractiveness by Country, 2022 to 2032

Figure 73: East Asia Market Value (US$ million) by Application, 2022 to 2032

Figure 74: East Asia Market Value (US$ million) by Risk of Procedure, 2022 to 2032

Figure 75: East Asia Market Value (US$ million) by Country, 2022 to 2032

Figure 76: East Asia Market Value (US$ million) Analysis by Country, 2017 to 2032

Figure 77: East Asia Market Volume (Units) Analysis by Country, 2017 to 2032

Figure 78: East Asia Market Value Share (%) and BPS Analysis by Country, 2022 to 2032

Figure 79: East Asia Market Y-o-Y Growth (%) Projections by Country, 2022 to 2032

Figure 80: East Asia Market Value (US$ million) Analysis by Application, 2017 to 2032

Figure 81: East Asia Market Volume (Units) Analysis by Application, 2017 to 2032

Figure 82: East Asia Market Value Share (%) and BPS Analysis by Application, 2022 to 2032

Figure 83: East Asia Market Y-o-Y Growth (%) Projections by Application, 2022 to 2032

Figure 84: East Asia Market Value (US$ million) Analysis by Risk of Procedure, 2017 to 2032

Figure 85: East Asia Market Volume (Units) Analysis by Risk of Procedure, 2017 to 2032

Figure 86: East Asia Market Value Share (%) and BPS Analysis by Risk of Procedure, 2022 to 2032

Figure 87: East Asia Market Y-o-Y Growth (%) Projections by Risk of Procedure, 2022 to 2032

Figure 88: East Asia Market Attractiveness by Application, 2022 to 2032

Figure 89: East Asia Market Attractiveness by Risk of Procedure, 2022 to 2032

Figure 90: East Asia Market Attractiveness by Country, 2022 to 2032

Figure 91: South Asia Market Value (US$ million) by Application, 2022 to 2032

Figure 92: South Asia Market Value (US$ million) by Risk of Procedure, 2022 to 2032

Figure 93: South Asia Market Value (US$ million) by Country, 2022 to 2032

Figure 94: South Asia Market Value (US$ million) Analysis by Country, 2017 to 2032

Figure 95: South Asia Market Volume (Units) Analysis by Country, 2017 to 2032

Figure 96: South Asia Market Value Share (%) and BPS Analysis by Country, 2022 to 2032

Figure 97: South Asia Market Y-o-Y Growth (%) Projections by Country, 2022 to 2032

Figure 98: South Asia Market Value (US$ million) Analysis by Application, 2017 to 2032

Figure 99: South Asia Market Volume (Units) Analysis by Application, 2017 to 2032

Figure 100: South Asia Market Value Share (%) and BPS Analysis by Application, 2022 to 2032

Figure 101: South Asia Market Y-o-Y Growth (%) Projections by Application, 2022 to 2032

Figure 102: South Asia Market Value (US$ million) Analysis by Risk of Procedure, 2017 to 2032

Figure 103: South Asia Market Volume (Units) Analysis by Risk of Procedure, 2017 to 2032

Figure 104: South Asia Market Value Share (%) and BPS Analysis by Risk of Procedure, 2022 to 2032

Figure 105: South Asia Market Y-o-Y Growth (%) Projections by Risk of Procedure, 2022 to 2032

Figure 106: South Asia Market Attractiveness by Application, 2022 to 2032

Figure 107: South Asia Market Attractiveness by Risk of Procedure, 2022 to 2032

Figure 108: South Asia Market Attractiveness by Country, 2022 to 2032

Figure 109: Oceania Market Value (US$ million) by Application, 2022 to 2032

Figure 110: Oceania Market Value (US$ million) by Risk of Procedure, 2022 to 2032

Figure 111: Oceania Market Value (US$ million) by Country, 2022 to 2032

Figure 112: Oceania Market Value (US$ million) Analysis by Country, 2017 to 2032

Figure 113: Oceania Market Volume (Units) Analysis by Country, 2017 to 2032

Figure 114: Oceania Market Value Share (%) and BPS Analysis by Country, 2022 to 2032

Figure 115: Oceania Market Y-o-Y Growth (%) Projections by Country, 2022 to 2032

Figure 116: Oceania Market Value (US$ million) Analysis by Application, 2017 to 2032

Figure 117: Oceania Market Volume (Units) Analysis by Application, 2017 to 2032

Figure 118: Oceania Market Value Share (%) and BPS Analysis by Application, 2022 to 2032

Figure 119: Oceania Market Y-o-Y Growth (%) Projections by Application, 2022 to 2032

Figure 120: Oceania Market Value (US$ million) Analysis by Risk of Procedure, 2017 to 2032

Figure 121: Oceania Market Volume (Units) Analysis by Risk of Procedure, 2017 to 2032

Figure 122: Oceania Market Value Share (%) and BPS Analysis by Risk of Procedure, 2022 to 2032

Figure 123: Oceania Market Y-o-Y Growth (%) Projections by Risk of Procedure, 2022 to 2032

Figure 124: Oceania Market Attractiveness by Application, 2022 to 2032

Figure 125: Oceania Market Attractiveness by Risk of Procedure, 2022 to 2032

Figure 126: Oceania Market Attractiveness by Country, 2022 to 2032

Figure 127: MEA Market Value (US$ million) by Application, 2022 to 2032

Figure 128: MEA Market Value (US$ million) by Risk of Procedure, 2022 to 2032

Figure 129: MEA Market Value (US$ million) by Country, 2022 to 2032

Figure 130: MEA Market Value (US$ million) Analysis by Country, 2017 to 2032

Figure 131: MEA Market Volume (Units) Analysis by Country, 2017 to 2032

Figure 132: MEA Market Value Share (%) and BPS Analysis by Country, 2022 to 2032

Figure 133: MEA Market Y-o-Y Growth (%) Projections by Country, 2022 to 2032

Figure 134: MEA Market Value (US$ million) Analysis by Application, 2017 to 2032

Figure 135: MEA Market Volume (Units) Analysis by Application, 2017 to 2032

Figure 136: MEA Market Value Share (%) and BPS Analysis by Application, 2022 to 2032

Figure 137: MEA Market Y-o-Y Growth (%) Projections by Application, 2022 to 2032

Figure 138: MEA Market Value (US$ million) Analysis by Risk of Procedure, 2017 to 2032

Figure 139: MEA Market Volume (Units) Analysis by Risk of Procedure, 2017 to 2032

Figure 140: MEA Market Value Share (%) and BPS Analysis by Risk of Procedure, 2022 to 2032

Figure 141: MEA Market Y-o-Y Growth (%) Projections by Risk of Procedure, 2022 to 2032

Figure 142: MEA Market Attractiveness by Application, 2022 to 2032

Figure 143: MEA Market Attractiveness by Risk of Procedure, 2022 to 2032

Figure 144: MEA Market Attractiveness by Country, 2022 to 2032

Frequently Asked Questions

How much is the global Artificial Ventilation and Anaesthesia Masks Market currently worth?

The global Artificial Ventilation and Anaesthesia Masks Market were valued at USD 2.3 billion in 2021.

What is the Artificial Ventilation and Anaesthesia Masks Market Forecast through 2032?

Over the projected period, the Artificial Ventilation and Anaesthesia Masks Market are expected to increase at a rate of 5%, reaching a value of USD 3.9 billion by 2032.

What is a key trend in the Artificial Ventilation and Anaesthesia Masks Market?

The involvement of technology in Artificial Ventilation and Anaesthesia Masks and the growing geriatric population has been adding significant revenues to the market.

At what rate did demand Artificial Ventilation and Anaesthesia Masks increase over the past 6 years?

The Artificial Ventilation and Anaesthesia Masks Market expanded at 5.7% from 2017 through 2021.

Where are Artificial Ventilation and Anaesthesia Masks used the most?

Artificial Ventilation and Anaesthesia Masks are used the most in Operation Rooms. Revenue through this category expanded at a CAGR of 5.5% from 2017 to 2021, and is projected to grow at a CAGR of 4.8% by 2032.

Who are the key players shaping the Artificial Ventilation and Anaesthesia Masks Industry?

CareFusion Corporation, Air Liquide Healthcare, Koninklijke Philips N.V., ResMed, Ambu A/S, Acutronic Medical Systems, GaleMed, are some of the key players in the Artificial Ventilation and Anaesthesia Masks Industry.

Who are the top 5 countries driving the highest Artificial Ventilation and Anaesthesia Masks?

The United States, The United Kingdom, China, Japan and South Korea are expected to drive the most Artificial Ventilation and Anaesthesia Masks.

Which country has the largest market for Artificial Ventilation and Anaesthesia Masks?

The United States has the largest market for Artificial Ventilation and Anaesthesia Masks.

Explore Similar Insights

Future Market Insights

Artificial Ventilation and Anaesthesia Masks Market