The artificial intelligence in retail market is estimated to be valued at USD 0.2 billion in 2025 and is projected to reach USD 2.5 billion by 2035, registering a compound annual growth rate (CAGR) of 28.0% over the forecast period.
Retail executives evaluate artificial intelligence solutions based on customer lifetime value improvement, conversion rate optimization, and operational efficiency enhancement when implementing personalized product recommendations, chatbot customer service, and predictive demand forecasting systems.
Technology selection involves analyzing machine learning model accuracy, real-time processing capabilities, and integration complexity while considering data privacy compliance, scalability requirements, and return on investment measurement necessary for justifying technology expenditures. Strategic decisions balance implementation costs against competitive advantages including increased basket sizes, improved customer satisfaction scores, and reduced inventory carrying costs that drive sustainable business growth.
Deployment processes require extensive data preparation, algorithm training protocols, and A/B testing frameworks that ensure accurate performance while maintaining customer experience consistency throughout diverse touchpoint interactions and seasonal demand fluctuations. System integration involves coordinating customer data platforms, point-of-sale systems, and inventory management databases while maintaining data synchronization and privacy protection across multiple channels and customer interfaces.
Validation procedures address model performance monitoring, bias detection protocols, and accuracy verification that ensure reliable artificial intelligence operation while supporting continuous learning and optimization throughout evolving market conditions.
Implementation coordination involves data scientists, marketing teams, and IT operations specialists working together to optimize artificial intelligence applications that balance personalization effectiveness with operational feasibility while addressing specific customer segment behaviors and business objective priorities.
Rollout strategies encompass pilot program execution, performance metric establishment, and gradual expansion while managing change resistance from traditional retail practices and ensuring staff adaptation to artificial intelligence-enhanced workflows. Success measurement includes customer engagement improvement, sales conversion enhancement, and operational cost reduction that validate artificial intelligence investment effectiveness.
Vertical specialization addresses fashion retail trend prediction requiring style analysis algorithms, grocery chain demand forecasting needing perishable inventory optimization, and luxury brand customer experience enhancement demanding sophisticated personalization that leverage artificial intelligence advantages for specific retail challenges.
Solution providers collaborate with retail consultants, system integrators, and technology vendors to develop comprehensive artificial intelligence ecosystems that address industry-specific requirements while maintaining implementation efficiency and cost-effectiveness. Custom applications encompass visual search capabilities, price optimization engines, and customer churn prevention systems that require specialized development and retail expertise.
Vendor partnerships involve coordination between artificial intelligence platform providers, retail technology integrators, and consulting services to establish comprehensive implementation programs that address data strategy development, model training, and performance optimization throughout retail transformation initiatives.
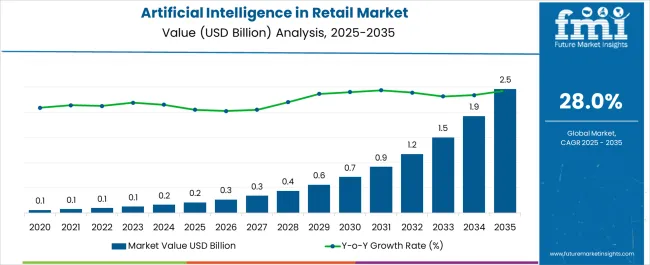
| Metric | Value |
|---|---|
| Artificial Intelligence in Retail Market Estimated Value in (2025 E) | USD 0.2 billion |
| Artificial Intelligence in Retail Market Forecast Value in (2035 F) | USD 2.5 billion |
| Forecast CAGR (2025 to 2035) | 28.0% |
The artificial intelligence in retail market is expanding rapidly as retailers increasingly leverage AI to enhance customer experience, optimize inventory, and streamline operational processes. The shift toward data driven decision making is reshaping the retail landscape, with AI tools being integrated into areas such as personalized recommendations, demand forecasting, and fraud prevention.
Advancements in natural language processing, computer vision, and predictive analytics are enabling retailers to analyze large volumes of structured and unstructured data in real time. Growing adoption of omnichannel retail strategies and the need for improved supply chain visibility are also fueling investment in AI driven solutions.
As competitive pressures intensify, AI is becoming central to delivering efficiency, customer loyalty, and revenue growth. The outlook remains strong as retailers continue to adopt AI technologies to respond to evolving consumer behavior and dynamic market demands.
The market is segmented by Component, Technology, and Application and region. By Component, the market is divided into Solution and Services. In terms of Technology, the market is classified into Machine Learning, Natural Language Processing (NLP), Computer Vision, and Others. Based on Application, the market is segmented into Automated Merchandising, Programmatic Advertising, Market Forecasting, In-Store AI & Location Optimization, Data Science, and Others. Regionally, the market is classified into North America, Latin America, Western Europe, Eastern Europe, Balkan & Baltic Countries, Russia & Belarus, Central Asia, East Asia, South Asia & Pacific, and the Middle East & Africa.
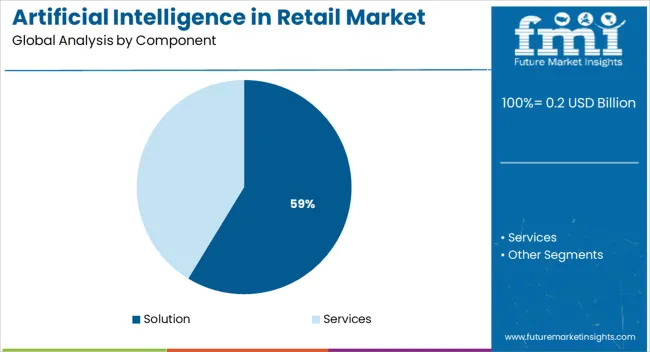
The solution segment is projected to hold 58.70% of the total revenue share by 2025, positioning it as the most significant component in the market. This dominance is being driven by the growing reliance on AI powered software platforms that enable retailers to automate processes, generate customer insights, and personalize shopping experiences.
Solutions are increasingly integrated across customer relationship management, recommendation systems, and predictive analytics, all of which are critical for revenue optimization. Retailers have prioritized solutions that improve decision making, reduce operational inefficiencies, and enhance real time responsiveness.
The scalability and adaptability of AI solutions across both physical and digital retail environments have further reinforced their widespread adoption, making this component the leader in the segment.
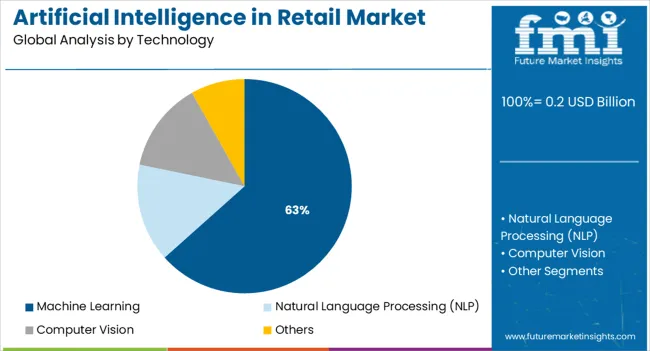
The machine learning technology segment is expected to account for 63.40% of the total market revenue by 2025, establishing it as the most dominant technology. Its leadership is attributed to its capability to analyze vast datasets, uncover consumer behavior patterns, and deliver predictive insights that drive targeted marketing and inventory optimization.
Retailers are leveraging machine learning to improve demand forecasting accuracy, prevent stockouts, and reduce overstocking, thereby enhancing operational efficiency. Furthermore, the use of algorithms to personalize product recommendations and enhance search results has strengthened customer engagement and retention.
As retailers continue to adopt advanced models for price optimization, fraud detection, and dynamic promotions, machine learning remains the cornerstone technology underpinning AI adoption in the retail market.
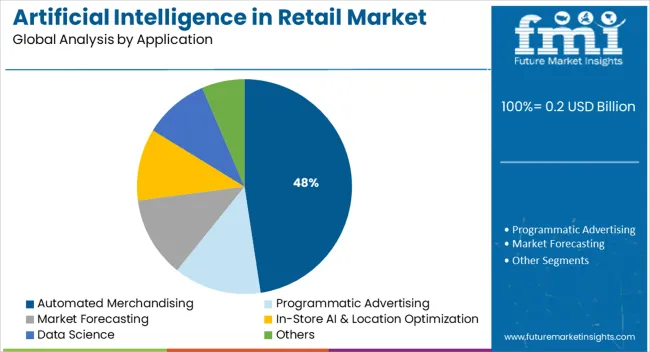
The automated merchandising application segment is projected to represent 47.60% of the market revenue by 2025, making it the leading application area. This growth is being fueled by the increasing demand for intelligent product placement, assortment optimization, and dynamic planogram management in both physical stores and online platforms.
Retailers are turning to automated merchandising to respond quickly to consumer preferences, optimize shelf space, and increase conversion rates. By integrating AI driven tools, retailers can dynamically adjust product displays, enhance promotional effectiveness, and reduce manual intervention.
The capacity to combine real time sales data with predictive analytics has enabled better inventory alignment and improved profit margins. Automated merchandising is therefore emerging as the most influential application, helping retailers deliver consistent value to customers while maintaining operational efficiency.
Artificial intelligence (AI) has become a game-changer for various industries, including healthcare, automotive, and manufacturing. As Gen Z takes over as the dominant consumer base, their strong preference for online shopping has made AI a must-have tool in the retail market. With cashier-less checkouts powered by computer vision and big data analytics, retailers are revolutionizing the shopping experience.
The growing popularity of online shopping trends, driven by the tech-savvy and mobile-friendly Gen Z population, has created a huge demand for AI solutions and services in the retail market. AI is not only transforming the shopping experience with cashier-less checkouts, but it's also making retail operations more efficient and intelligent. The future of retail is looking brighter with the integration of AI.
Despite the continued investment in AI technology by leading retail companies, there are still numerous barriers to the widespread adoption of AI in the retail sector. Small and medium-sized businesses and start-ups may face challenges in terms of infrastructure and technological know-how, while high implementation costs present a significant challenge for small retailers. However, the potential benefits of AI in the retail market cannot be ignored, particularly with the increasing usage of IoT, Big Data analytics, and e-commerce marketing.
The retail industry is anticipated to experience a wave of growth thanks to the increasing popularity of AI. Advancements in computer vision and other technologies are paving the way for new retail opportunities in areas such as customer experience, demand forecasting, and inventory management. With AI focusing on planning and product recommendations, the growth of AI products and services across various industrial domains and verticals is fueled by big data analytics.
| Artificial Intelligence in Retail Market Estimated Year Value (2025) | USD 10.76 billion |
|---|---|
| Artificial Intelligence in Retail Market Projected Year Value (2035) | USD 127.09 billion |
| Value CAGR (2025 to 2035) | 28% |
The retail industry is undergoing a promising transformation with the adoption of artificial intelligence. This new technology is changing the way companies track their operations, improve their strategies, and engage with customers in the digital world.
The growth of the global AI in retail market is driven by factors such as the increasing number of internet users and smart devices, rising awareness about AI and big data & analytics, and government initiatives towards digitization. The adoption of multichannel or omnichannel retailing strategy, untapped opportunities to boost sales efficiency, and enterprises' need to streamline their processes. In addition, the growing desire to enhance the end-user experience and take advantage of market dynamics is also contributing to the growth of global AI in retail market.
During the forecast period, the market is projected to experience substantial growth compared to the period of 2020 to 2025. Artificial intelligence in retail market is likely to record a 28% CAGR from 2025 to 2035, in comparison to the 19% CAGR registered from 2020 to 2025.
| Year | Market Growth during 2025 to 2035 |
|---|---|
| 2025 | 17.64 USD billion |
| 2035 | 36.99 USD billion |
| 2035 | 99.29 USD billion |
Short term (2025 to 2025): With the growing number of internet users and the widespread adoption of smart devices, there is a growing demand for AI in retail. This is because AI-powered applications can provide enhanced customer experiences through personalized recommendations, product searches, and intelligent pricing algorithms.
Medium term (2025 to 2035): The increasing awareness about the benefits of AI and big data & analytics is driving growth in the global artificial intelligence in retail market. Retailers are recognizing the potential of AI to streamline their operations, improve customer engagement, and drive business growth.
Long term (2035 to 2035): Governments around the world are investing in digitization initiatives to promote the adoption of AI in retail. This includes providing financial incentives and subsidies, setting up innovation centers, and promoting digital literacy. These initiatives are creating a supportive environment for the growth of AI in the retail sector, thereby contributing to the overall growth of global artificial intelligence in retail market.
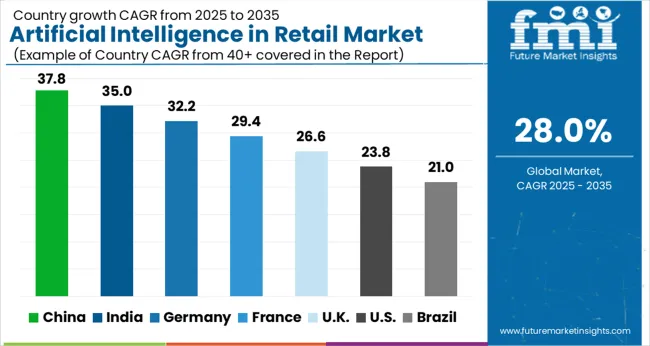
North America is poised to lead the AI retail market, with the United States expected to grow at a CAGR of 5.8% during the forecast period and reach a value of USD 2.5 billion by 2035. The growth is driven by the rising number of businesses adopting AI and the presence of key players in the region, along with increased adoption of cloud services and investments in new technology.
North America is leading the way in terms of AI in retail, with the region dominating the global revenue share. Retailers in the region are leveraging customer data to improve customer service and boost efficiency. The United States is at the forefront of AI adoption, with high levels of investment in technology and the emergence of new startups and small enterprises in response to growing demand.
The Asia Pacific region is poised for rapid growth in the AI in retail market, driven by the rapidly growing digitalization of the retail industry. The region is undergoing an important transition, which is fueling demand for advanced technologies to improve operations and customer experience. For example, China has secured a 23.4% share of AI investments in the commerce and retail industry, according to SAP SE analysis. India is expected to see a leading growth due to the increasing demand for automation tools to improve decision-making and operations.
China AI in the retail industry is projected to grow at a CAGR of 5.46% and reach a value of USD 5.4 billion during the forecast period. The growth is driven by the expansion of the IT business, increasing industrial automation, and the growth of internet penetration and mobile devices.
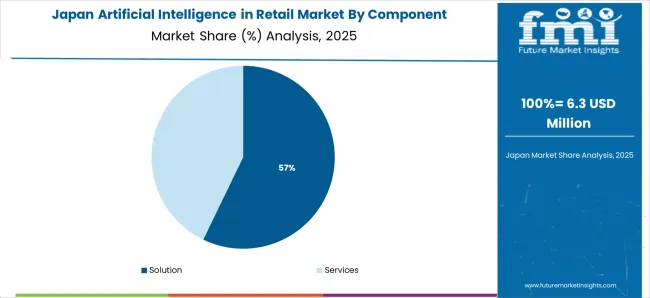
Japan AI in the retail industry is expected to grow at a CAGR of 5.6% and reach a market value of USD 6.3 billion during the forecast period, driven by increasing industrial production and the expansion of mobile technologies. South Korea is expected to see a CAGR of 4.8%, driven by the growing consumer shopping experience and the implementation of smart building infrastructures.
The United Kingdom is expected to grow at a CAGR of 4.66% during the forecast period, driven by the emergence of IoT and Machine-to-Machine technologies and the increasing demand for research and industrial capacity in the region. AI in retail has become an integral part of the growing IoT market in the United Kingdom, with the region focusing on digitization post-Covid-19 by using AI and 5G networks.
Europe is expected to rank second in terms of AI in retail market share, with key retailers in the cosmetics, fashion, and apparel sectors actively investing in advanced technologies to improve the customer experience. The European technology industry saw a 26.7% rise in the AI segment in Q1 of 2024, fueling demand for AI in the retail industry.
In terms of market share, the solutions segment is projected to hold a 73% share, accounting for a substantial portion of the global AI in retail market. Retailers are turning to automated solutions to tackle complex management challenges, streamline supply chain operations, improve logistics, and enhance the customer experience.
However, the services segment is not far behind, with a significant growth rate forecast over the next few years. The increase in demand for AI services is attributed to the increasing popularity of AI solutions and their ability to drive revenue growth, improve customer experience, reduce human error, speed up innovation, and create intelligent functions.
According to market research, machine learning (ML) has acquired a leading revenue share of over 32% among the different AI technologies, such as natural language processing, image & video analytics, chatbots, and swarm intelligence. The increased precision and flexibility of ML technology are contributing to its expanding growth. With its ability to rapidly and deeply serve data, ML is ideal for providing personalized experiences to customers. It also helps merchants streamline their supply chain strategies and demand projections to increase inventory productivity. Amazon Sage Maker, a fully managed service, enables the deployment of machine learning models for various activities ranging from customer experience to predictive analytics.
Natural language processing (NLP) is also on the rise, as the demand for data analysis and AI-powered chatbots increases. The market for NLP is expected to grow rapidly during the forecast period, with a market share estimated to be 15%. As AI technology continues to progress, NLP plays a critical role in providing more accurate and efficient communication for various applications.
The AI in the retail market is divided into various applications, including customer relationship management (CRM), inventory management, supply chain & logistics, product optimization, payment & pricing analytics, in-store navigation, virtual assistant (VA), and others. CRM dominates the revenue share and is expected to continue growing, with a pressing need to improve customer service and retention. With the use of chatbots, search engines, and other AI technologies, retailers are aiming to establish strong customer relationships and foster loyalty.
Virtual assistant technologies have enormous growth potential in the retail industry, offering solutions for streamlining the supply chain, invoicing, ordering inventory, and bookkeeping. As a result, virtual assistance is expected to see significant growth in the forecast period, solidifying its position as a key player in the AI retail market.
The global artificial intelligence in retail market is becoming increasingly competitive, with new players entering the arena and established companies investing in cutting-edge technology. Leading players such as Amazon, IBM, Microsoft, and Salesforce are dominating the market with their advanced AI solutions. These companies are making significant investments in R&D to stay ahead of the curve and maintain their dominant positions.
In addition, emerging players such as H2O.ai, Neurala, and Vicarious are disrupting the market with their innovative solutions. These start-ups are attracting investments from leading venture capital firms and making a significant impact on the industry with their ground-breaking technologies.
Established players in the retail sector, such as Walmart, Tesco, and Alibaba, are also making significant investments in AI technology to improve their customer experience and operations. These retailers are embracing AI to enhance their competitiveness and maintain their dominant positions in the market.
Overall, artificial intelligence in retail market is expected to continue its growth trajectory, with increasing competition among established and emerging players. As AI technology continues to evolve and new solutions emerge, companies must stay ahead of the curve to remain competitive in this rapidly changing market.
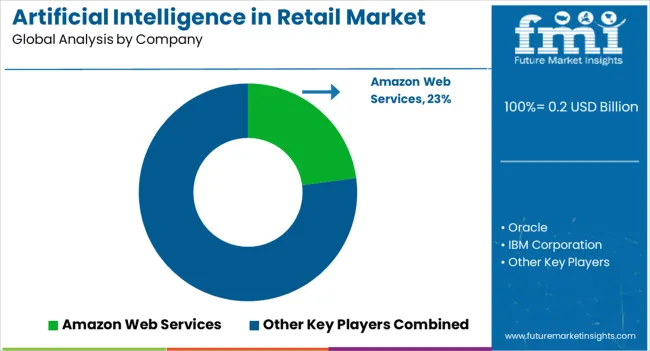
The artificial intelligence in retail market is highly competitive, with leading technology companies offering AI-driven solutions that enhance customer experiences, optimize supply chains, and boost sales performance. Amazon Web Services Inc. and Microsoft Corporation lead the market, offering AI cloud platforms and machine learning tools that enable retailers to personalize customer interactions, predict demand, and streamline inventory management. Their robust AI solutions power everything from chatbots and virtual assistants to dynamic pricing and recommendation systems.
Oracle Corporation and SAP SE provide integrated AI solutions tailored for enterprise resource planning (ERP), driving efficiencies in retail operations. Their platforms allow retailers to leverage data analytics, automate workflows, and enhance customer engagement strategies.
Salesforce Inc. focuses on AI-powered customer relationship management (CRM) systems, helping retailers deliver personalized marketing and sales strategies. NVIDIA Corporation and Intel Corporation specialize in providing advanced hardware solutions, such as GPUs and processors, that accelerate AI applications like computer vision, demand forecasting, and in-store robotics.
Google LLC leads in AI-based search and advertising solutions, helping retailers improve digital marketing campaigns and customer targeting. Sentient Technologies Holdings Ltd. and ViSenze Pte Ltd. contribute to the market with AI-powered visual search and product recommendation technologies that enhance e-commerce platforms.
| Items | Values |
|---|---|
| Quantitative Units (2025) | USD 0.2 billion |
| Component | Solution (Chatbots, CRM, Recommendation engines, Price optimization, Visual search, Inventory management, Automated merchandising, Programmatic advertising), Services (Professional, Managed) |
| Technology | Machine Learning, Natural Language Processing (NLP), Computer Vision, and Others |
| Application |
Automated Merchandising, Programmatic Advertising, Market Forecasting, In-Store AI & Location Optimization, Data Science, Others |
| Regions Covered | North America, Latin America, Western Europe, Eastern Europe, South Asia and Pacific, East Asia, Middle East and Africa |
| Key Countries Covered | United States, Canada, United Kingdom, Germany, France, China, Japan, India, South Korea, Brazil, and 40+ countries |
| Key Companies Profiled |
Amazon Web Services Inc., Oracle Corporation, IBM Corporation, Microsoft Corporation, SAP SE, Salesforce Inc., NVIDIA Corporation, Google LLC, Sentient Technologies Holdings Ltd., ViSenze Pte Ltd., Intel Corporation |
| Additional Attributes | Dollar sales by component and application; solution versus services split; regional adoption across North America, Europe, Asia Pacific; application penetration by automated merchandising, CRM, inventory; competitive landscape and startups; cloud migration trends; data privacy and compliance; AI ethics and explainability; ROI and implementation cost benchmarks; integration with omnichannel and POS systems; M&A and partnership activity. |
The global artificial intelligence in retail market is estimated to be valued at USD 0.2 billion in 2025.
The market size for the artificial intelligence in retail market is projected to reach USD 2.5 billion by 2035.
The artificial intelligence in retail market is expected to grow at a 28.0% CAGR between 2025 and 2035.
The key product types in artificial intelligence in retail market are solution, _chatbots, _customer behavior tracking, _crm, _inventory management, _price optimization, _recommendation engines, _supply chain management, _visual search & visual listen, _others, services, _professional services and _managed services.
In terms of technology, machine learning segment to command 63.4% share in the artificial intelligence in retail market in 2025.


Our Research Products

The "Full Research Suite" delivers actionable market intel, deep dives on markets or technologies, so clients act faster, cut risk, and unlock growth.

The Leaderboard benchmarks and ranks top vendors, classifying them as Established Leaders, Leading Challengers, or Disruptors & Challengers.

Locates where complements amplify value and substitutes erode it, forecasting net impact by horizon

We deliver granular, decision-grade intel: market sizing, 5-year forecasts, pricing, adoption, usage, revenue, and operational KPIs—plus competitor tracking, regulation, and value chains—across 60 countries broadly.

Spot the shifts before they hit your P&L. We track inflection points, adoption curves, pricing moves, and ecosystem plays to show where demand is heading, why it is changing, and what to do next across high-growth markets and disruptive tech

Real-time reads of user behavior. We track shifting priorities, perceptions of today’s and next-gen services, and provider experience, then pace how fast tech moves from trial to adoption, blending buyer, consumer, and channel inputs with social signals (#WhySwitch, #UX).

Partner with our analyst team to build a custom report designed around your business priorities. From analysing market trends to assessing competitors or crafting bespoke datasets, we tailor insights to your needs.
Supplier Intelligence
Discovery & Profiling
Capacity & Footprint
Performance & Risk
Compliance & Governance
Commercial Readiness
Who Supplies Whom
Scorecards & Shortlists
Playbooks & Docs
Category Intelligence
Definition & Scope
Demand & Use Cases
Cost Drivers
Market Structure
Supply Chain Map
Trade & Policy
Operating Norms
Deliverables
Buyer Intelligence
Account Basics
Spend & Scope
Procurement Model
Vendor Requirements
Terms & Policies
Entry Strategy
Pain Points & Triggers
Outputs
Pricing Analysis
Benchmarks
Trends
Should-Cost
Indexation
Landed Cost
Commercial Terms
Deliverables
Brand Analysis
Positioning & Value Prop
Share & Presence
Customer Evidence
Go-to-Market
Digital & Reputation
Compliance & Trust
KPIs & Gaps
Outputs
Full Research Suite comprises of:
Market outlook & trends analysis
Interviews & case studies
Strategic recommendations
Vendor profiles & capabilities analysis
5-year forecasts
8 regions and 60+ country-level data splits
Market segment data splits
12 months of continuous data updates
DELIVERED AS:
PDF EXCEL ONLINE
Artificial Ear Simulator Market Size and Share Forecast Outlook 2025 to 2035
Artificial Tears Market Size and Share Forecast Outlook 2025 to 2035
Artificial Lift Systems Market Size and Share Forecast Outlook 2025 to 2035
Artificial Ventilation and Anaesthesia Masks Market Size and Share Forecast Outlook 2025 to 2035
Artificial Pancreas Device Market Size and Share Forecast Outlook 2025 to 2035
Artificial Flower Market Analysis by Growth, Trends and Forecast from 2025 to 2035
Artificial Preservative Market Outlook by Product, Type, Form, End Use Application and Others Through 2035
Analysis and Growth Projections for Artificial Sweetener Business
Artificial Turf Market Growth & Trends 2024-2034
Artificial Plants Market
Artificial Wood Beams Market
Artificial Airway Holders Market
Artificial Cartilage Implant Market
Artificial Insemination Market Size and Share Forecast Outlook 2025 to 2035
Artificial Intelligent Packaging Market Size and Share Forecast Outlook 2025 to 2035
Artificial Urinary Sphincter Market Size and Share Forecast Outlook 2025 to 2035
Artificial Bowling Surface Market
Artificial Hair Integration Market Growth - Trends & Forecast 2025 to 2035
Artificial Intelligence (chipset) Market Forecast and Outlook 2025 to 2035
Artificial Intelligence in Construction Market Size and Share Forecast Outlook 2025 to 2035

Thank you!
You will receive an email from our Business Development Manager. Please be sure to check your SPAM/JUNK folder too.
Chat With
MaRIA