The AI in packaging market is gaining momentum as industries adopt intelligent technologies to optimize production efficiency, ensure quality, and enhance sustainability. Rising demand for automation in packaging operations and the growing focus on minimizing material waste are key drivers shaping the current market landscape. Manufacturers are increasingly deploying AI-driven systems for defect detection, predictive maintenance, and process optimization, resulting in improved productivity and cost efficiency.
Advancements in machine learning algorithms and computer vision technologies are enabling more accurate real-time decision-making within production lines. The future outlook remains positive as expanding industrial digitalization and integration of smart packaging systems enhance operational agility across sectors.
Growth rationale is built on the rising adoption of AI tools that streamline packaging workflows, reduce downtime, and improve traceability throughout the supply chain Continued innovation and cross-industry collaboration are expected to strengthen the market’s foundation, ensuring sustained expansion and value creation across global manufacturing ecosystems.
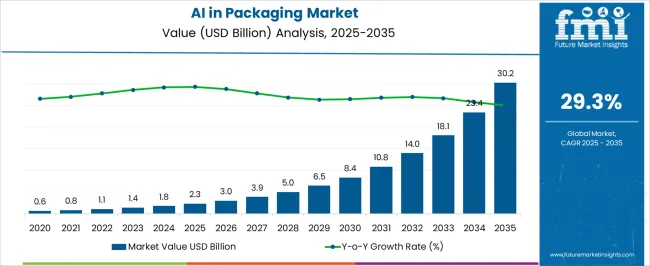
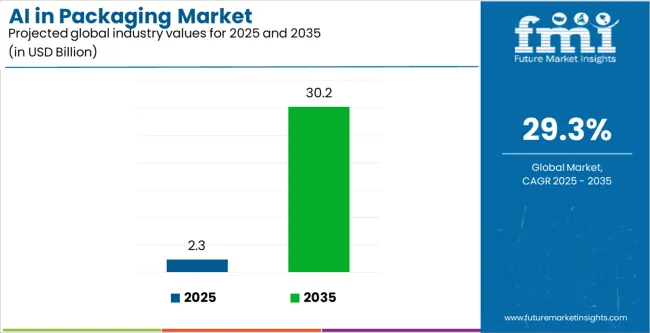
| Metric | Value |
|---|---|
| AI in Packaging Market Estimated Value in (2025 E) | USD 2.3 billion |
| AI in Packaging Market Forecast Value in (2035 F) | USD 30.2 billion |
| Forecast CAGR (2025 to 2035) | 29.3% |
The market is segmented by Technology, Application, and End Use and region. By Technology, the market is divided into Machine Learning, Computer Vision, Natural Language Processing, Predictive Analysis, and Others. In terms of Application, the market is classified into Quality Control And Inspection, Packaging Design And Customization, Supply Chain Optimization, and Smart Packaging. Based on End Use, the market is segmented into Food And Beverage, Healthcare, Personal Care & Cosmetics, Other Industrial, Consumer Goods, and E-Commerce. Regionally, the market is classified into North America, Latin America, Western Europe, Eastern Europe, Balkan & Baltic Countries, Russia & Belarus, Central Asia, East Asia, South Asia & Pacific, and the Middle East & Africa.
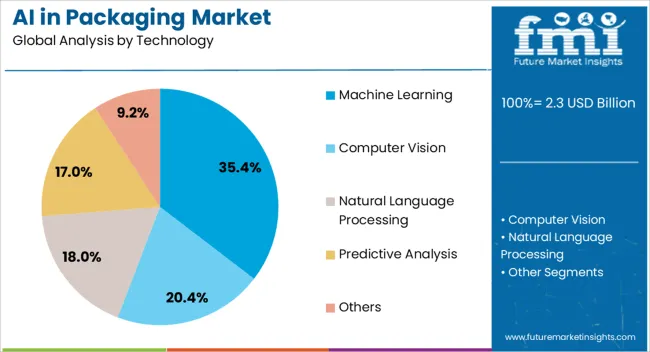
The machine learning segment, accounting for 35.40% of the technology category, has emerged as the dominant area due to its ability to process complex data sets and improve packaging precision through predictive modeling. Adoption has been driven by its application in optimizing line speeds, detecting anomalies, and forecasting equipment maintenance.
Manufacturers are leveraging machine learning models to minimize errors and achieve consistent product quality. Integration with vision systems and robotics has enhanced automation levels, reducing reliance on manual inspection.
Continuous improvements in algorithm accuracy and computing capacity have expanded its scalability across different packaging formats As digital transformation accelerates, machine learning is expected to remain the core technology underpinning AI-driven packaging innovation, enabling faster, smarter, and more efficient operations across the value chain.
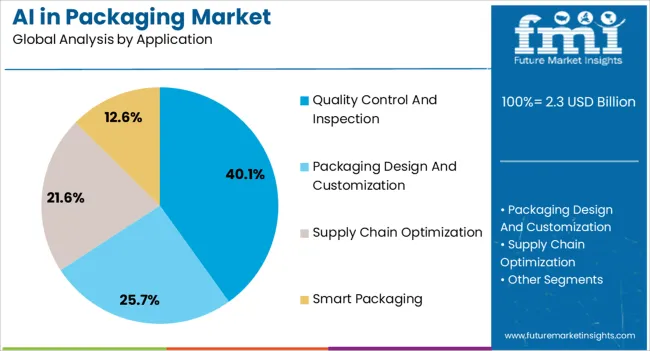
The quality control and inspection segment, holding 40.10% of the application category, has retained market leadership due to its central role in ensuring product integrity and compliance with safety standards. AI-enabled systems have been widely implemented to detect visual and structural defects with greater accuracy and speed.
Integration of automated inspection tools has significantly reduced rejection rates and improved production throughput. The shift toward zero-defect manufacturing has reinforced investment in intelligent inspection technologies.
Enhanced image processing and data analytics are allowing manufacturers to identify root causes of quality deviations and optimize process parameters This continued reliance on AI-based quality control frameworks is expected to sustain growth, driving further adoption across high-precision packaging environments.
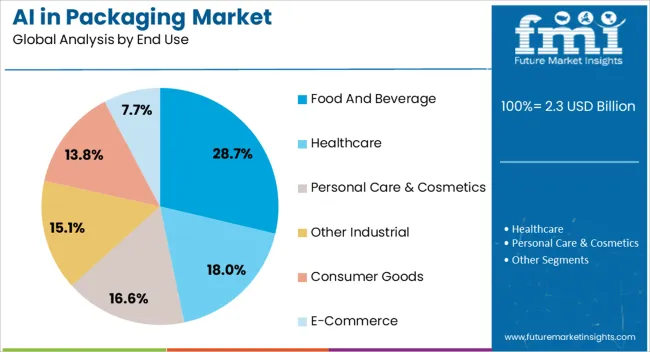
The food and beverage segment, representing 28.70% of the end use category, has been leading due to the sector’s high volume and stringent safety requirements. AI technologies are being implemented to ensure consistency in labeling, sealing, and product presentation while supporting traceability and regulatory compliance.
The segment’s growth is being fueled by demand for real-time monitoring of packaging lines and data-driven insights for process improvement. AI-driven systems have enhanced flexibility to accommodate diverse product types and rapid changeovers, improving operational efficiency.
As consumer preferences shift toward sustainable and personalized packaging, AI applications are enabling manufacturers to optimize design and material use These advancements are expected to reinforce the food and beverage industry’s position as a key adopter of AI-powered packaging solutions.
The table presents the expected CAGR for AI in packaging market over several semi-annual periods spanning from 2025 to 2035. In the first half (H1) of the decade from 2025 to 2035, the market is predicted to surge at a CAGR of 28.7%, followed by a slightly higher growth rate of 31.2% in the second half (H2) of the same decade.
Moving into the subsequent period, from H1 2025 to H2 2035, the CAGR is projected to decrease slightly to 29.3% in the first half and surge at 32.3% in the second half.
| Particular | Value CAGR |
|---|---|
| H1 | 28.7% (2025 to 2035) |
| H2 | 31.2% (2025 to 2035) |
| H1 | 29.3% (2025 to 2035) |
| H2 | 32.3% (2025 to 2035) |
The table below shows the estimated growth rates of the leading countries. India, Canada, and Japan are set to record high CAGRs of 39.6%, 32.3%, and 33.8%, respectively, through 2035.
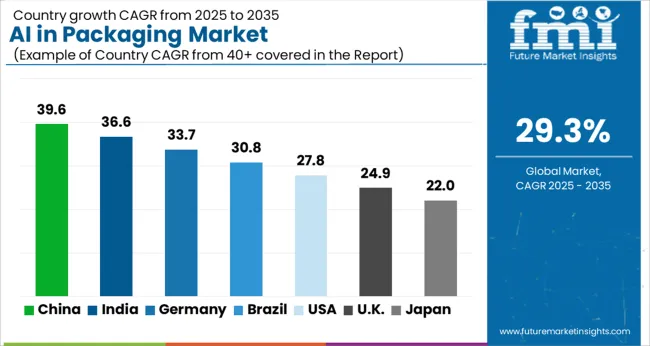
Over the forecast period, demand for AI in packaging in China is set to rise at 31.6% CAGR, driven by factors like:
Demand for AI in packaging in India is set to grow at 39.6% CAGR by 2035. The key factors supporting the market growth are:
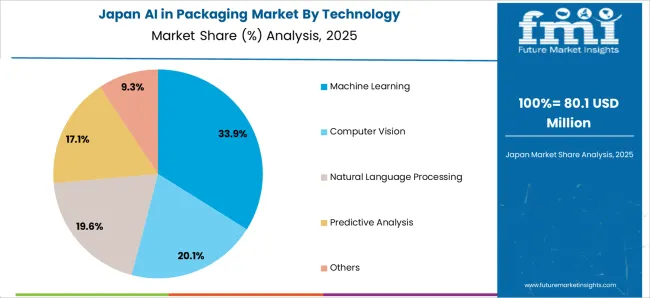
The AI in packaging market is projected to increase in Japan at a CAGR of 33.8% through 2035. The factors driving the market growth are as follows:
The section below shows the machine learning segment dominating by technology. It is predicted to surge at a CAGR of 30.0% through 2035. Based on application, the quality control and inspection segment is anticipated to generate a dominant share through 2025. The segment is expected to rise at 29.0% CAGR through 2035.
| Segment | Value-based CAGR (2025 to 2035) |
|---|---|
| Machine Learning (Technology) | 30.0% |
| Quality Control and Inspection (Application) | 29.0% |
Key AI solution providers in the packaging industry include Amazon Inc., IBM, Microsoft Corporation, GE Digital, Open AI, Midjourney Inc., Canva, Adobe, ABB Group, Cognex Corporation, and others. Leading companies actively invest in research and development to enhance their AI capabilities and offer innovative packaging solutions.
For instance
The global AI in packaging market is estimated to be valued at USD 2.3 billion in 2025.
The market size for the AI in packaging market is projected to reach USD 30.2 billion by 2035.
The AI in packaging market is expected to grow at a 29.3% CAGR between 2025 and 2035.
The key product types in AI in packaging market are machine learning, computer vision, natural language processing, predictive analysis and others.
In terms of application, quality control and inspection segment to command 40.1% share in the AI in packaging market in 2025.


Our Research Products

The "Full Research Suite" delivers actionable market intel, deep dives on markets or technologies, so clients act faster, cut risk, and unlock growth.

The Leaderboard benchmarks and ranks top vendors, classifying them as Established Leaders, Leading Challengers, or Disruptors & Challengers.

Locates where complements amplify value and substitutes erode it, forecasting net impact by horizon

We deliver granular, decision-grade intel: market sizing, 5-year forecasts, pricing, adoption, usage, revenue, and operational KPIs—plus competitor tracking, regulation, and value chains—across 60 countries broadly.

Spot the shifts before they hit your P&L. We track inflection points, adoption curves, pricing moves, and ecosystem plays to show where demand is heading, why it is changing, and what to do next across high-growth markets and disruptive tech

Real-time reads of user behavior. We track shifting priorities, perceptions of today’s and next-gen services, and provider experience, then pace how fast tech moves from trial to adoption, blending buyer, consumer, and channel inputs with social signals (#WhySwitch, #UX).

Partner with our analyst team to build a custom report designed around your business priorities. From analysing market trends to assessing competitors or crafting bespoke datasets, we tailor insights to your needs.
Supplier Intelligence
Discovery & Profiling
Capacity & Footprint
Performance & Risk
Compliance & Governance
Commercial Readiness
Who Supplies Whom
Scorecards & Shortlists
Playbooks & Docs
Category Intelligence
Definition & Scope
Demand & Use Cases
Cost Drivers
Market Structure
Supply Chain Map
Trade & Policy
Operating Norms
Deliverables
Buyer Intelligence
Account Basics
Spend & Scope
Procurement Model
Vendor Requirements
Terms & Policies
Entry Strategy
Pain Points & Triggers
Outputs
Pricing Analysis
Benchmarks
Trends
Should-Cost
Indexation
Landed Cost
Commercial Terms
Deliverables
Brand Analysis
Positioning & Value Prop
Share & Presence
Customer Evidence
Go-to-Market
Digital & Reputation
Compliance & Trust
KPIs & Gaps
Outputs
Full Research Suite comprises of:
Market outlook & trends analysis
Interviews & case studies
Strategic recommendations
Vendor profiles & capabilities analysis
5-year forecasts
8 regions and 60+ country-level data splits
Market segment data splits
12 months of continuous data updates
DELIVERED AS:
PDF EXCEL ONLINE
AI In Packaging Design Market Size and Share Forecast Outlook 2025 to 2035
Market Share Breakdown of AI in Packaging Industry
Dairy Packaging Market Size and Share Forecast Outlook 2025 to 2035
Dairy Packaging Machine Market Size and Share Forecast Outlook 2025 to 2035
Airless Packaging Market Growth - Demand & Forecast 2025 to 2035
Market Share Breakdown of Airless Packaging Industry
Mailer Packaging Market Analysis by Material and Application Through 2035
AI Powered Packaging Inspection Machine Market Size and Share Forecast Outlook 2025 to 2035
Hair Care Packaging Market Growth and Trends 2025 to 2035
Nail Polish Packaging Market Size and Share Forecast Outlook 2025 to 2035
Dairy Product Packaging Market Size and Share Forecast Outlook 2025 to 2035
Market Share Breakdown of Dairy Product Packaging Companies
Retail Glass Packaging Market Size and Share Forecast Outlook 2025 to 2035
Sustainable Packaging Market Size, Share & Forecast 2025 to 2035
Retail Glass Packaging Industry Analysis in Europe and the Middle East and Africa - Size, Share, and Forecast 2025 to 2035
Market Share Distribution Among Sustainable Packaging Providers
Market Share Distribution Among Retail Glass Packaging Companies
GCC Retail Glass Packaging Market Insights – Growth & Forecast 2023-2033
Cold Chain Packaging Market Size and Share Forecast Outlook 2025 to 2035
Braille Cartons Packaging Market Size and Share Forecast Outlook 2025 to 2035

Thank you!
You will receive an email from our Business Development Manager. Please be sure to check your SPAM/JUNK folder too.
Chat With
MaRIA