
- Market Size (2026)
- USD 18.0 Bn
- Forecast (2036)
- USD 80.7 Bn
- CAGR (2026 to 2036)
- 16.2%
How big is the Artificial Intelligence in Healthcare Market in 2026?
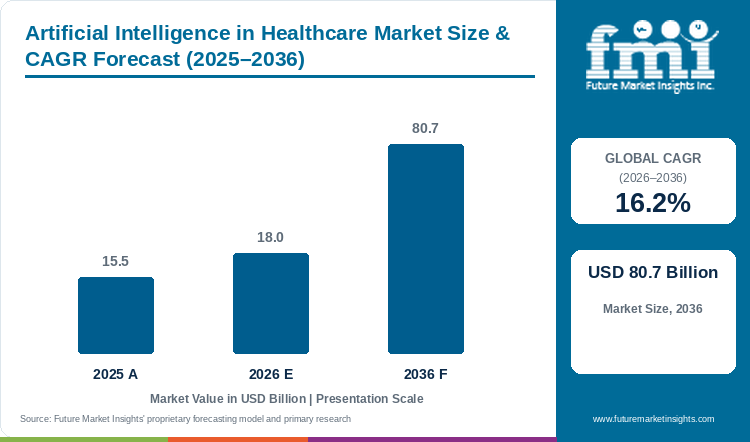
The Artificial Intelligence in Healthcare Market is forecast to reach USD 80.7 billion by 2036. FMI assesses the market at USD 18.0 billion in 2026, compared with USD 15.5 billion in 2025, and forecasts a 16.2% CAGR from 2026 to 2036. In its 2026 assessment, Hardware holds 60.2% by offering, Robot-Assisted Surgery 30.0% by application and Healthcare Providers 60.0% by end user.
Rising diagnostic workloads and shortages of clinical staff support spending on imaging AI, surgical systems and documentation software. IARC's July 2026 release estimates 20.6 million new cancer cases in 2024 and projects 34.4 million in 2050; WHO projects an 11 million health-worker shortfall by 2030, concentrated in low- and lower-middle-income countries. These pressures strengthen the commercial case for tools that demonstrate improved clinical capacity. A material restraint is the cost of local validation, integration and monitoring: workforce pressure alone does not create an affordable purchase. As a qualified example, Siemens Healthineers announced FDA clearance for six Artis interventional imaging systems in May 2026. This broadens the available equipment portfolio, while actual sales depend on clinical qualification and provider budgets.
Key Market Trends & Insights
- Health Canada's April 2026 pre-market guidance allows manufacturers to propose predetermined change control plans and sets out evidence considerations for changes to machine learning devices. FMI sees an opening for suppliers able to support controlled updates after deployment, subject to the plan and applicable licensing requirements.
- The MHRA opened phase 3 of AI Airlock in October 2026, focusing on post-market surveillance and lifecycle oversight. This shifts part of the development agenda toward monitoring products in use, creating demand for regulatory and technical support alongside initial product development.
- France's HAS includes digital-technology selection, patient information and quality control within its framework for professional-use tools. FMI finds that procurement evidence increasingly needs to cover the institution's use of a system as well as its technical performance.
Regional Highlights
- Western European suppliers face the AI Act alongside existing medical-device requirements. The current EU timetable places relevant high-risk systems embedded in regulated products on a 2 August 2028 application schedule. FMI expects preparation and documentation work to influence product programmes before that date; the rule does not classify every healthcare AI tool identically.
- East Asia's product-development opportunity includes medical robotics, advanced imaging and AI devices. China's NMPA expressly names these areas in its July 2025 lifecycle-regulation measures, including clearer review requirements and work on standards. The policy supports development activity, while purchases still depend on product-specific approval and clinical demand.
Artificial Intelligence in Healthcare Market Size and Forecast
Table 1: Artificial Intelligence in Healthcare Market Size and Forecast (USD billion and CAGR percentage), 2025 to 2036
| Market size and forecast | Value |
|---|---|
| Market size in 2025 | USD 15.5 billion |
| Estimated market size in 2026 | USD 18.0 billion |
| Projected market size by 2036 | USD 80.7 billion |
| CAGR from 2026 to 2036 | 16.2% |
Source: FMI Analysis
Analyst Perspective
“A medical AI product needs a clear route from regulatory clearance to routine clinical use. Hospital buyers will also consider reimbursement, integration with existing equipment and the support required after installation, so a clearance alone does not guarantee an order.”
- Anurag Sharma, Principal Consultant, FMI
How is the Artificial Intelligence in Healthcare Market segmented?
The Artificial Intelligence in Healthcare Market is segmented by offering, technology, application, end user and region.
- By Offering: Hardware, Software, Services
- By Technology: Machine Learning, Context-Aware Computing, Natural Language Processing, Deep Learning, Querying Method, Others
- By Application: Robot-Assisted Surgery, Virtual Nursing Assistant, Administrative Workflow Assistance, Fraud Detection, Dosage Error Reduction, Clinical Trial Participant Identifier, Preliminary Diagnosis, Others
- By End User: Healthcare Providers, Pharmaceutical and Biotechnology Companies, Patients, Others
- By Region: North America, Latin America, Western Europe, Eastern Europe, East Asia, South Asia and Pacific, Middle East and Africa
Related healthcare interoperability solutions are discussed as part of integration requirements; the market boundary includes only AI-related offerings.
Why does Hardware lead by Offering?
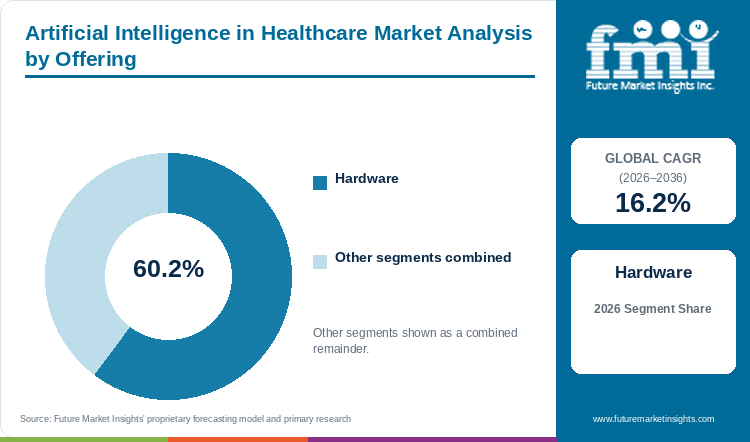
Hardware accounts for 60.2% of the Artificial Intelligence in Healthcare Market by offering in 2026, according to FMI's assessment.
Capital equipment puts AI revenue into imaging and interventional-system purchases rather than solely into separate software subscriptions. Siemens Healthineers' May 2026 clearance covers six Artis systems sharing its Optiq AI imaging chain, illustrating how one technical capability is distributed across several equipment configurations.
That example supports the presence of AI within equipment portfolios, rather than independently measuring Hardware's share. The FDA list also includes software and is expressly non-comprehensive.
Software and Services together account for the remaining 39.8% in FMI's assessment.
Equipment suppliers must still demonstrate performance and provide installation and ongoing support; a cleared configuration does not establish the timing of a hospital's replacement budget. FMI therefore reads Hardware's lead as a revenue-mix finding, with adoption subject to capital spending and clinical qualification.
Table 2: Artificial Intelligence in Healthcare Market Share by Offering
| Leading Share | 2026 market share |
|---|---|
| Hardware | 60.2% |
| All Other Segments Combined Share | 39.8% |
Source: FMI Analysis
Why does Robot-Assisted Surgery lead by Application?
Robot-Assisted Surgery accounts for 30.0% of the Artificial Intelligence in Healthcare Market by application in 2026, according to FMI's assessment.
This category combines equipment-related demand with the continuing clinical use of surgical platforms. Intuitive Surgical reported approximately 3,153,000 worldwide da Vinci procedures for 2025 in its January 2026 preliminary results. The figure demonstrates the scale of surgical-system use, although those procedures are not a measure of AI revenue or proof that each procedure used an AI function.
FMI links the category's position to this equipment and procedure base while keeping the AI boundary separate from the wider robotics market. Medical AI must be assessed for its intended use and actual capabilities. Relevant high-risk systems embedded in regulated products also face EU AI Act requirements on the current 2 August 2028 timetable. Compliance work adds a cost and development constraint; it does not itself prove adoption.
Other applications, including documentation, preliminary diagnosis and virtual nursing, together account for 70.0% of the application mix in this assessment.
Table 3: Artificial Intelligence in Healthcare Market Share by Application
| Leading Share | 2026 market share |
|---|---|
| Robot-Assisted Surgery | 30.0% |
| All Other Segments Combined Share | 70.0% |
Source: FMI Analysis
Why do Healthcare Providers lead by End User?
Healthcare Providers account for 60.0% of the Artificial Intelligence in Healthcare Market by end user in 2026, according to FMI's assessment.
Provider procurement spans imaging equipment, diagnostic software and implementation services, giving this category exposure to several revenue streams. Public screening programmes illustrate how adoption can be organised across institutions rather than through individual patient purchases.
Lunit reported use of its screening tools by Italian local health authorities serving over 8.5 million people as of June 2025, and announced selection for the Valencian Community's breast-screening programme in September 2025. Those are distinct regional deployments, rather than evidence of universal provider adoption. They support FMI's view that organised clinical programmes matter to the end-user mix.
Pharmaceutical and Biotechnology Companies, Patients and Others together hold 40.0%.
Providers' spending remains conditional on local validation, workflow integration and support after purchase; a programme announcement does not establish a supplier's realised revenue.
Table 4: Artificial Intelligence in Healthcare Market Share by End User
| Leading Share | 2026 market share |
|---|---|
| Healthcare Providers | 60.0% |
| All Other Segments Combined Share | 40.0% |
Source: FMI Analysis
What are the key drivers restraints and opportunities?
The growth case combines a wider product portfolio with the spending needed to deploy it. The following mechanisms separate product availability, adoption costs and the service opportunity.
Driver
The expanding authorised product portfolio broadens the set of clinical purchases that hospitals can evaluate. The FDA's AI-enabled list identifies products that have met applicable US premarket requirements, without measuring sales or being comprehensive. Reimbursement remains a separate commercial question: Eko states that eligible outpatient SENSORA analyses use CPT Category III code 0962T, with OPPS payment under APC 5734 finalised in December 2025. Related healthcare business intelligence tools are an adjacent purchasing category; their entire revenue is excluded from this AI market assessment.
Restraint
Local performance and continuing oversight add expense after launch. Joint FDA, Health Canada and MHRA principles call for representative data and monitoring deployed models. These are guiding principles, rather than a shared automatic marketing authorisation. Health Canada's current guidance separately addresses evidence and lifecycle information for Canadian applications. Related healthcare cybersecurity programs add another budget consideration where connected systems are deployed; only the AI-related portion falls within this report's defined scope.
Opportunity
A commercial opening lies in implementation and ongoing support for provider programmes that extend beyond a single device purchase. Suppliers with documented integration, local performance testing and controlled updates have a more complete offer for clinical buyers. Microsoft's March 2025 Dragon Copilot announcement illustrates software distribution through an existing healthcare partner ecosystem. Related healthcare mobility solutions may support these workflows, but neither the announcement nor the adjacent market establishes a separate application share in this report.
How do medical-device quality requirements affect Artificial Intelligence in Healthcare Market purchasing?
Medical-device quality requirements make clinical evidence part of supplier qualification. Health Canada's April 2026 pre-market guidance states that medical devices must meet the applicable requirements of sections 10 to 20 of the Medical Devices Regulations, with objective evidence supporting intended use, safety and effectiveness. FMI finds that a buyer therefore needs to check the product's evidence and clinical scope before selecting a supplier. Marketing authorisation, payment and procurement remain separate decisions. The FDA's public AI device list concerns US marketing authorisation and is not a comprehensive census or a revenue series. Eko's current SENSORA information states that eligible outpatient analyses have a Category III code and an OPPS payment route, while physician-fee coverage varies by carrier. FMI therefore evaluates payment setting and clinical use separately from whether a product is authorised.
In the EU, relevant high-risk AI embedded in regulated products is subject to the current 2 August 2028 timetable. Classification and applicable conformity requirements must be considered for the particular product. The UK's AI Airlock is a regulatory sandbox focused on resolving development and oversight questions, not a substitute for authorisation. Canada's April 2026 guidance adds country-specific evidence considerations despite its participation in shared international principles. Suppliers benefit from reusing well-documented evidence, but should not represent US, UK and Canadian approvals as interchangeable.
What limits reliable Artificial Intelligence in Healthcare Market performance?
Performance on development data does not establish performance in every hospital. Joint regulatory guiding principles address representative populations, clinically relevant testing and monitoring after deployment. Health Canada's current guidance also considers subgroup performance and compatibility with supported input and output devices. FMI finds that a change in patient mix, equipment or clinical workflow can therefore require more qualification work before wider adoption. Providers must allocate technical and clinical resources to that work. This limits the speed at which a successful pilot becomes a multi-site purchase, while creating an ongoing service requirement for suppliers able to document and maintain performance.
Where can suppliers win additional business in the Artificial Intelligence in Healthcare Market?
Suppliers can win additional business through controlled deployment and support across an established clinical programme. Screening contracts offer one route: Lunit's Valencian selection covers mammography and tomosynthesis tools within a regional programme. Hardware offers another: Siemens Healthineers' Artis announcement places a shared AI imaging chain across six configurations. These cases involve different buyers and budget cycles. FMI expects suppliers to compete on the relevant implementation work rather than assume that one successful configuration or hospital proves suitability elsewhere. Ongoing validation and upgrade support can extend the relationship after the initial purchase, subject to the product's authorised scope.
Artificial Intelligence in Healthcare Market by Country (2026 to 2036)
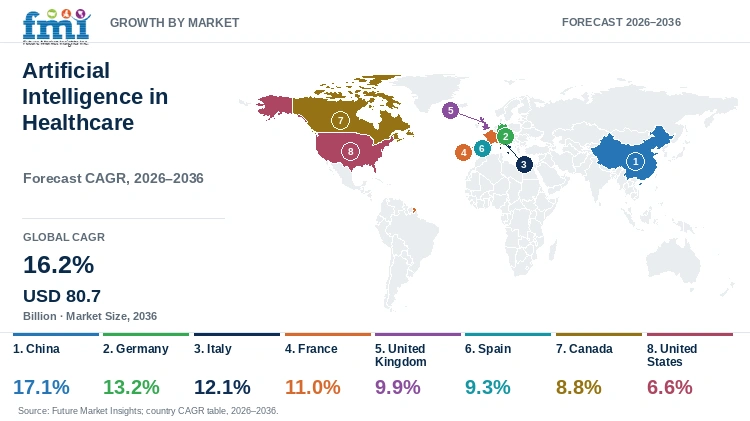
Table 5: Artificial Intelligence in Healthcare Market Country Growth Forecast
| Country | CAGR (2026 to 2036) |
|---|---|
| China | 17.1% |
| Germany | 13.2% |
| Italy | 12.1% |
| France | 11.0% |
| United Kingdom | 9.9% |
| Spain | 9.3% |
| Canada | 8.8% |
| United States | 6.6% |
Source: FMI Analysis
United States
US demand has an established product base to build on, but purchasing still depends on how a clinical service is paid for. The FDA list identifies AI-enabled devices authorised for marketing and explicitly warns that it is not comprehensive. FMI therefore treats the list as evidence of product availability, rather than a count of installations or a hardware revenue series. The distinction matters in a market where imaging equipment, standalone software and workflow tools have different budgets. FMI forecasts 6.6% annual growth for the United States from 2026 to 2036. That is the lowest rate among the eight profiled countries, although the rate alone does not establish the country's absolute market size.
Payment conditions add another selection step after authorisation. Eko's current SENSORA information describes Category III code 0962T for eligible outpatient analyses and OPPS payment under APC 5734, while noting variation in physician-fee coverage by carrier. FMI sees the commercial implication as product-specific: a payment route for cardiac analysis does not establish reimbursement for unrelated diagnostic or documentation tools. Suppliers need a clear offer for the relevant care setting and a service plan for deployment. Capital systems must fit replacement budgets; software must fit clinical workflows and the applicable payment arrangement. These are separate constraints on adoption. The US outlook rests on extending use of qualified tools, with continuing integration and monitoring expenditure, rather than assuming every authorised device produces a new order.
Canada
Canadian adoption requires evidence that addresses Canadian patients and clinical practice. Health Canada's April 2026 pre-market guidance applies to new or amended applications for Class II, III and IV machine learning medical devices and discusses transparency, validation and planned changes. FMI forecasts an 8.8% CAGR for Canada from 2026 to 2036, with commercial progress linked to the ability to support a product beyond its first licence. A manufacturer with a controlled update process has a clearer route to explaining how performance will be maintained. That strengthens the implementation offer, but does not remove the regulator's product-specific review or prove that a provider will fund deployment.
Canada also participates in the joint Good Machine Learning Practice principles with the FDA and MHRA. Common concepts can support the organisation of technical evidence, although they do not create mutual or automatic authorisation. FMI therefore rejects the assumption that US clearance alone opens the Canadian market. Providers and suppliers still need to address the intended population, clinical use and local operating conditions. The opportunity extends to validation support, transparent documentation and maintenance alongside the core AI product. The restraint is the cost of preparing and sustaining that evidence for a smaller deployment programme. A supplier that can demonstrate local suitability and explain update responsibilities has a more credible commercial position than one presenting a foreign approval as sufficient proof for Canadian use.
Germany
Germany combines a medical-equipment supplier base with a growing requirement to qualify AI inside clinical operations. Siemens Healthineers' May 2026 announcement of FDA clearance for six Artis interventional systems is evidence of a German-headquartered supplier expanding a US portfolio. It is not evidence of installations in German hospitals. FMI forecasts 13.2% annual growth for Germany from 2026 to 2036, the highest rate among the Western European countries profiled here. The commercial case includes equipment with embedded AI as well as software and implementation support. The relevant spending depends on the configuration and clinical role, rather than treating every imaging-system purchase as entirely AI revenue.
European requirements create a parallel qualification agenda. Under the current timetable, relevant high-risk AI embedded in regulated products falls on a 2 August 2028 schedule. Suppliers preparing for that framework must still meet existing device requirements and explain the intended use of each product. FMI sees an opportunity for established equipment vendors to incorporate evidence and upgrade support into an ongoing system relationship. The corresponding constraint is the work needed to maintain performance across equipment configurations and clinical environments. German clinical guidance from the Federal Medical Association also discusses the gap between technological innovation and actual use. This supports a measured outlook: supplier capability broadens the offer, while purchasing and implementation determine how quickly that offer becomes domestic demand.
France
France's market argument centres on how clinical organisations select and oversee digital tools. The Haute Autorité de Santé describes a framework covering selection, use and evaluation of professional-use digital technologies, including AI systems. Its sixth certification cycle adds criteria relevant to digital technologies for visits from September 2025. FMI forecasts an 11.0% CAGR for the French Artificial Intelligence in Healthcare Market from 2026 to 2036. The opportunity is wider than developing a diagnostic algorithm: providers also need evidence that a tool fits a clinical process and that its results can be controlled in use. That creates a commercial role for implementation and quality support.
HAS distinguishes devices with a medical purpose from other digital technologies used in care, including administrative tools. FMI considers that distinction material to the revenue mix because documentation software and diagnostic devices do not follow the same qualification path. A research result or a research-use-only product should not be presented as evidence of approved clinical deployment. Suppliers must connect the relevant product status to the intended purchasing organisation and care setting. The restraint is the time and expense of moving from technical performance to a supported institutional purchase. France's forecast therefore reflects continued development and adoption across these different routes, with the strongest commercial offers providing a specific clinical purpose, a defined implementation plan and evidence that addresses the buyer's actual use.
Italy
Public screening provides a concrete route into Italian provider demand. Lunit said that local health authorities using its mammography and chest X-ray tools served over 8.5 million people as of June 2025, across regions including Lazio, Lombardia and Veneto. This is the population served by the authorities, not a count of patients screened or an independently measured national AI adoption rate. FMI forecasts a 12.1% CAGR for Italy from 2026 to 2036. The cited deployments support a market in which specialist imaging software enters through organised public healthcare programmes, with implementation across the relevant institutions rather than through purchases by individual patients.
For suppliers, the commercial unit is therefore the authority's programme and its imaging workflow. A deployment may support a continuing relationship around software integration and maintenance, but the population in an authority's catchment does not establish licence revenue or realised clinical throughput. FMI sees room for further adoption where a supplier can show suitability for the local screening process and support the participating clinical teams. The restraint is the work required to qualify and sustain that use across sites. Relevant EU medical-device and AI obligations also remain product-specific. Italy's outlook rests on extending evidenced clinical use within those boundaries. It does not assume that a company's announced coverage target was achieved, or that one vendor's regional footprint describes the whole country's market.
United Kingdom
The United Kingdom is extending regulatory work from product development to oversight after deployment. The MHRA opened phase 3 of AI Airlock in October 2026, with the programme focusing on post-market surveillance and broader lifecycle questions. FMI forecasts a 9.9% CAGR for the UK from 2026 to 2036. This supports a commercial argument for validation, monitoring and documentation alongside the core product. A sandbox can help identify regulatory questions and test approaches, although participation does not itself confer a marketing authorisation or an NHS procurement contract. The distinction matters when a supplier presents programme participation as evidence of readiness for routine clinical use.
FMI expects the most credible offers to connect a defined clinical task with evidence and a practical plan for maintaining performance. The UK also helped develop the joint Good Machine Learning Practice principles, which address representative data and monitoring after deployment. These principles inform development rather than replace the applicable legal requirements. The commercial restraint is that monitoring and support continue after the initial installation, adding costs for both supplier and provider. That creates an opportunity for firms able to provide a clear service responsibility and controlled updates, rather than selling a pilot without an operating plan. The UK forecast does not rely on an assumption that every successful sandbox test becomes a purchase. It reflects a broader path from evidence generation to qualified deployment and continuing support in clinical services.
Spain
A regional screening programme gives Spain a distinct procurement example. In September 2025, Lunit announced selection of its mammography and tomosynthesis tools for the Valencian Community's breast-screening programme. The company described a programme objective of increasing annual participation from 250,000 to 400,000 women. That objective is not a reported achieved volume. FMI forecasts a 9.3% CAGR for Spain from 2026 to 2036. The commercial mechanism is a programme-level purchase around a specific clinical workflow, rather than an assumption that all hospitals or all applications adopt the same software. It provides a concrete route to demand for specialist screening tools and their implementation.
The example also shows why geographic scope matters. Selection by the Valencian programme is not a national Spanish contract, and exclusivity for the stated programme does not establish dominance in the country's broader healthcare AI market. FMI sees the supplier opportunity in supporting the participating sites, maintaining compatibility and demonstrating performance for the intended screening population. Expansion beyond that programme would require additional commercial and clinical work. The restraint is that targeted procurement can concentrate revenue opportunities in a small number of contracts, making implementation quality and renewal terms important. Relevant EU product requirements remain applicable. Spain's outlook therefore allows for adoption across provider programmes without converting a planned participation increase into realised revenue or treating one regional selection as evidence for every application category.
China
China's regulatory agenda explicitly includes medical robotics, advanced imaging and AI-enabled devices. The NMPA's July 2025 measures on high-end medical-device innovation address special review procedures, classification, standards and clearer technical review requirements. FMI forecasts a 17.1% CAGR for China from 2026 to 2036, the highest rate among the eight profiled countries. The growth argument is the development and qualification of a broader product offer in these categories, rather than a direct conversion of approval counts into revenue. A policy measure supports a route to development; it does not establish that a hospital has purchased a system or that a product is appropriate for every clinical use.
The measures also discuss planned work on AI-device standards and the review of changes to products. FMI sees a commercial opportunity for manufacturers able to combine product development with the evidence required for clinical entry and subsequent updates. The constraint is the need to demonstrate performance and maintain quality while the product and its intended use evolve. Approval, clinical adoption and purchasing remain separate steps. A supplier serving a particular imaging or surgical workflow cannot use that success to claim equivalent demand in administrative software or virtual nursing. China's forecast is therefore an FMI market assessment across the report's taxonomy. It is not a growth rate published by the NMPA, and the regulator's broader innovative-device statistics should not be described as an AI-only market series.
Who are the notable companies in the Artificial Intelligence in Healthcare Market?
NVIDIA, GE HealthCare, Microsoft and Siemens Healthineers illustrate four different commercial positions in this market. NVIDIA supplies computing and simulation infrastructure, while GE HealthCare brings an imaging-equipment platform to their announced development collaboration. The March 2025 Isaac for Healthcare announcement described early access and work on autonomous X-ray and ultrasound; it did not establish routine autonomous deployment. Microsoft participates through clinical workflow software and its healthcare partner ecosystem. Its March 2025 Dragon Copilot launch announcement scheduled initial US and Canadian availability for May, rather than March. Siemens Healthineers combines equipment configurations with embedded AI image processing, including the six Artis systems cleared in May 2026. These roles expose companies to different customers: development teams buy infrastructure, providers buy systems and software, and regional screening organisations commission programme deployments. Lunit's Italian and Valencian work adds a specialist screening supplier to that structure. FMI sees integration and clinical qualification as common competitive requirements, but does not infer market rankings or company shares from these examples. A development platform, a device clearance and a regional contract remain separate types of evidence.
Key Developments in the Artificial Intelligence in Healthcare Market
- May 12, 2026: Siemens Healthineers announced FDA clearance for six Artis interventional imaging systems with its Optiq AI imaging chain. Clearance expands the available portfolio but does not establish installed sales.
Key Players in the Artificial Intelligence in Healthcare Market
- NVIDIA
- Microsoft / Nuance
- Siemens Healthineers
- GE HealthCare
- Tempus AI
- Lunit
- Owkin
- Eko Health
- Intuitive Surgical
- Philips Healthcare
- Medtronic
Artificial Intelligence in Healthcare Market Report Scope
Table 6: Artificial Intelligence in Healthcare Market Report Scope
| Coverage field | Report scope |
|---|---|
| Market definition | AI-related hardware, software and services for the listed healthcare applications. General healthcare IT and equipment revenue without an AI-related offering is excluded. |
| Quantitative Units | USD billion |
| Offering | Hardware; Software; Services |
| Technology | Machine Learning; Context-Aware Computing; Natural Language Processing; Deep Learning; Querying Method; Others |
| Application | Robot-Assisted Surgery; Virtual Nursing Assistant; Administrative Workflow Assistance; Fraud Detection; Dosage Error Reduction; Clinical Trial Participant Identifier; Preliminary Diagnosis; Others |
| End User | Healthcare Providers; Pharmaceutical and Biotechnology Companies; Patients; Others |
| Regions covered | North America, Latin America, Western Europe, Eastern Europe, East Asia, South Asia and Pacific, Middle East and Africa |
| Profiled markets | China, Germany, Italy, France, United Kingdom, Spain, Canada, United States |
| Companies covered | NVIDIA; Microsoft / Nuance; Siemens Healthineers; GE HealthCare; Tempus AI; Lunit; Owkin; Eko Health; Intuitive Surgical; Philips Healthcare; Medtronic |
Source: FMI Analysis
Artificial Intelligence in Healthcare Market Research Methodology
This assessment uses secondary review of the public regulatory records and company documents cited in the bibliography. It compares their stated product, clinical, geographic and temporal scope with the FMI market framework. Market values, segment shares and country growth rates are FMI assessments; device counts, procedure volumes and company announcements provide context rather than direct measurements of those figures. The methodology relies on public secondary evidence.
Artificial Intelligence in Healthcare Market by Segments
Artificial Intelligence in Healthcare Market segmented by Offering:
- Hardware
- Software
- Services
Artificial Intelligence in Healthcare Market segmented by Technology:
- Machine Learning
- Context-Aware Computing
- Natural Language Processing
- Deep Learning
- Querying Method
- Others
Artificial Intelligence in Healthcare Market segmented by Application:
- Robot-Assisted Surgery
- Virtual Nursing Assistant
- Administrative Workflow Assistance
- Fraud Detection
- Dosage Error Reduction
- Clinical Trial Participant Identifier
- Preliminary Diagnosis
- Others
Artificial Intelligence in Healthcare Market segmented by End User:
- Healthcare Providers
- Pharmaceutical and Biotechnology Companies
- Patients
- Others
Artificial Intelligence in Healthcare Market by Region
- North America
- United States
- Canada
- Mexico
- Latin America
- Brazil
- Argentina
- Rest of Latin America
- Western Europe
- Germany
- France
- Italy
- United Kingdom
- Spain
- Netherlands
- Rest of Western Europe
- Eastern Europe
- Poland
- Russia
- Rest of Eastern Europe
- East Asia
- China
- Japan
- South Korea
- Rest of East Asia
- South Asia and Pacific
- India
- Australia
- Rest of South Asia and Pacific
- Middle East and Africa
- Saudi Arabia
- UAE
- South Africa
- Rest of Middle East and Africa
Research Sources and Bibliography
- [1] U.S. Food and Drug Administration. List of Artificial Intelligence-Enabled Medical Devices. Accessed 2 November 2026.
- [2] European Commission. Regulatory framework for AI; Guidelines for providers and deployers of AI high-risk systems. Current timetable accessed 2 November 2026. Council of the European Union, Timeline — Artificial intelligence, June 2026 update.
- [3] Medicines and Healthcare products Regulatory Agency. MHRA expands AI Airlock programme with a £3.6 million funding boost over three years. Also: AI Airlock collection and AI Airlock Phase 3 application, 6 October 2026; accessed 2 November 2026.
- [4] NVIDIA Newsroom, NVIDIA and GE HealthCare Collaborate to Advance the Development of Autonomous Diagnostic Imaging With Physical AI, March 18, 2025.
- [5] Health Canada, U.S. Food and Drug Administration, and UK Medicines and Healthcare products Regulatory Agency, Good Machine Learning Practice for Medical Device Development: Guiding Principles, canada.ca, published October 27, 2021, last modified July 29, 2024.
- [6] Microsoft Source. Microsoft Dragon Copilot provides the healthcare industry's first unified voice AI assistant. 3 March 2025. Announcement scheduled initial US and Canadian availability for May 2025.
- [7] Siemens Healthineers, Press Release: Siemens Healthineers Receives FDA Clearance for Six New Interventional Systems with Optiq AI Imaging Chain, siemens-healthineers.com, May 12, 2026.
- [8] Eko Health, Newsroom: Eko Announces New Category III CPT Code for SENSORA AI Heart Disease Detection Platform, ekohealth.com, November 14, 2024.
- [9] Eko Health. SENSORA Detection Platform, reimbursement frequently asked questions. Accessed 2 November 2026. Company states OPPS payment under APC 5734 was finalised in December 2025; carrier conditions apply.
- [10] Owkin, Newsfeed: BRCAura RUO validation results presented at ESMO 2025 (poster 327P), owkin.com, December 3, 2025.
- [11] Lunit Media. Lunit's AI Now Powers Cancer Screening for Over 8.5 Million People Across Italy's Public Health System. 26 August 2025. Company-owned newsroom, lunit.io.
- [12] Lunit, Press Release: Lunit selected as exclusive AI partner for Spain's Valencian Community breast screening program, lunit.io, September 2, 2025.
- [13] Tempus AI, Tempus Reports Second Quarter 2025 Results, tempus.com, 2025.
- [14] National Medical Products Administration, China. Measures on optimising full-lifecycle regulation to support innovation in high-end medical devices, Announcement No. 63 of 2025. 3 July 2025. nmpa.gov.cn.
- [15] Intuitive Surgical, Intuitive Announces Preliminary Fourth Quarter and Full Year 2025 Results, January 14, 2026.
- [16] Health Canada. Pre-market guidance for machine learning-enabled medical devices. 1 April 2026. canada.ca; accessed 2 November 2026.
- [17] Haute Autorité de Santé. Technologies numériques et systèmes d’IA à usage professionnel. Framework and 2025 work programme; accessed 2 November 2026. has-sante.fr.
- [18] German Medical Association (Bundesärztekammer). Künstliche Intelligenz in der Medizin. Scientific advisory statement, 2025. bundesaerztekammer.de.
- [19] International Agency for Research on Cancer. Global cancer statistics 2024: GLOBOCAN estimates of incidence and mortality worldwide for 34 cancers in 186 countries. 8 July 2026. iarc.who.int.
- [20] World Health Organization. Health workforce. Projected 2030 shortfall; accessed 2 November 2026. who.int.
Table of Content
- Key Takeaways
- Market Size and CAGR
- Top Growth Driver
- Fastest Growing Segment
- Leading Region
- Key Companies
- Emerging Opportunities
- Executive Summary
- Global Market Outlook
- Demand-side Trends
- Supply-side Trends
- Technology Roadmap Analysis
- Analysis and Recommendations
- Analyst Perspective (What is happening? Why now? What should investors know?)
- Key Questions Answered
- How large is the market?
- What is the CAGR?
- What are key trends?
- Which region dominates?
- Who are the leaders?
Read More...
- Market Overview
- Market Coverage / Taxonomy
- Market Definition / Scope / Limitations
- Research Methodology
- Chapter Orientation
- Analytical Lens and Working Hypotheses
- Market Structure, Signals, and Trend Drivers
- Benchmarking and Cross-market Comparability
- Market Sizing, Forecasting, and Opportunity Mapping
- Research Design and Evidence Framework
- Desk Research Programme (Secondary Evidence)
- Expert Input and Fieldwork (Primary Evidence)
- Tooling, Models, and Reference Databases
- Data Engineering and Model Build
- Quality Assurance and Audit Trail
- Market Background
- Market Dynamics (Drivers, Restraints, Opportunity, Trends)
- Scenario Forecast (Optimistic, Likely, Conservative)
- Impact Analysis
- AI Impact
- Sustainability Impact
- Regulatory Impact
- Technology Impact
- Consumer / Buyer Analysis
- Purchase Drivers
- Adoption Barriers
- Buyer Journey
- Opportunity Map Analysis
- Product Life Cycle Analysis
- Supply Chain Analysis
- Investment Feasibility Matrix
- Value Chain Analysis
- PESTLE and Porter's Analysis
- Regulatory Landscape
- Regional Parent Market Outlook
- Production and Consumption Statistics
- Import and Export Statistics
- Global Market Analysis and Forecast, 2021 to 2036
- Historical Market Size Value (USD Billion) Analysis, 2021 to 2025
- Current and Future Market Size Value (USD Billion) Projections, 2026 to 2036
- Y-o-Y Growth Trend Analysis
- Absolute $ Opportunity Analysis
- Global Market Pricing Analysis, 2021 to 2036
- Global Market Analysis and Forecast, By Offering, 2021 to 2036
- Introduction / Key Findings
- Historical Market Size Value (USD Billion) Analysis By Offering, 2021 to 2025
- Current and Future Market Size Value (USD Billion) Analysis and Forecast By Offering, 2026 to 2036
- Hardware
- Software
- Services
- Y-o-Y Growth Trend Analysis By Offering, 2021 to 2025
- Absolute $ Opportunity Analysis By Offering, 2026 to 2036
- Global Market Analysis and Forecast, By Technology, 2021 to 2036
- Introduction / Key Findings
- Historical Market Size Value (USD Billion) Analysis By Technology, 2021 to 2025
- Current and Future Market Size Value (USD Billion) Analysis and Forecast By Technology, 2026 to 2036
- Machine Learning
- Context-Aware Computing
- Natural Language Processing
- Deep Learning
- Querying Method
- Others
- Y-o-Y Growth Trend Analysis By Technology, 2021 to 2025
- Absolute $ Opportunity Analysis By Technology, 2026 to 2036
- Global Market Analysis and Forecast, By Application, 2021 to 2036
- Introduction / Key Findings
- Historical Market Size Value (USD Billion) Analysis By Application, 2021 to 2025
- Current and Future Market Size Value (USD Billion) Analysis and Forecast By Application, 2026 to 2036
- Robot-Assisted Surgery
- Virtual Nursing Assistant
- Administrative Workflow Assistance
- Fraud Detection
- Dosage Error Reduction
- Clinical Trial Participant Identifier
- Preliminary Diagnosis
- Others
- Y-o-Y Growth Trend Analysis By Application, 2021 to 2025
- Absolute $ Opportunity Analysis By Application, 2026 to 2036
- Global Market Analysis and Forecast, By End User, 2021 to 2036
- Introduction / Key Findings
- Historical Market Size Value (USD Billion) Analysis By End User, 2021 to 2025
- Current and Future Market Size Value (USD Billion) Analysis and Forecast By End User, 2026 to 2036
- Healthcare Providers
- Pharmaceutical and Biotechnology Companies
- Patients
- Others
- Y-o-Y Growth Trend Analysis By End User, 2021 to 2025
- Absolute $ Opportunity Analysis By End User, 2026 to 2036
- Global Market Analysis and Forecast, By Region, 2021 to 2036
- Introduction
- Historical Market Size Value (USD Billion) Analysis By Region, 2021 to 2025
- Current Market Size Value (USD Billion) Analysis and Forecast By Region, 2026 to 2036
- North America
- Latin America
- Western Europe
- Eastern Europe
- East Asia
- South Asia and Pacific
- Middle East and Africa
- Market Attractiveness Analysis By Region
- North America Market Analysis and Forecast, By Country, 2021 to 2036
- Historical Market Size Value (USD Billion) Trend Analysis By Market Taxonomy, 2021 to 2025
- Market Size Value (USD Billion) Forecast By Market Taxonomy, 2026 to 2036
- By Country
- United States
- Canada
- Mexico
- By Offering
- By Technology
- By Application
- By End User
- By Country
- Market Attractiveness Analysis
- By Country
- By Offering
- By Technology
- By Application
- By End User
- Key Takeaways
- Latin America Market Analysis and Forecast, By Country
- Historical Market Size Value (USD Billion) Trend Analysis By Market Taxonomy, 2021 to 2025
- Market Size Value (USD Billion) Forecast By Market Taxonomy, 2026 to 2036
- By Country
- Brazil
- Argentina
- Rest of Latin America
- By Offering
- By Technology
- By Application
- By End User
- By Country
- Market Attractiveness Analysis
- By Country
- By Offering
- By Technology
- By Application
- By End User
- Key Takeaways
- Western Europe Market Analysis and Forecast, By Country
- Historical Market Size Value (USD Billion) Trend Analysis By Market Taxonomy, 2021 to 2025
- Market Size Value (USD Billion) Forecast By Market Taxonomy, 2026 to 2036
- By Country
- Germany
- France
- Italy
- United Kingdom
- Spain
- Netherlands
- Rest of Western Europe
- By Offering
- By Technology
- By Application
- By End User
- By Country
- Market Attractiveness Analysis
- By Country
- By Offering
- By Technology
- By Application
- By End User
- Key Takeaways
- Eastern Europe Market Analysis and Forecast, By Country
- Historical Market Size Value (USD Billion) Trend Analysis By Market Taxonomy, 2021 to 2025
- Market Size Value (USD Billion) Forecast By Market Taxonomy, 2026 to 2036
- By Country
- Poland
- Russia
- Rest of Eastern Europe
- By Offering
- By Technology
- By Application
- By End User
- By Country
- Market Attractiveness Analysis
- By Country
- By Offering
- By Technology
- By Application
- By End User
- Key Takeaways
- East Asia Market Analysis and Forecast, By Country
- Historical Market Size Value (USD Billion) Trend Analysis By Market Taxonomy, 2021 to 2025
- Market Size Value (USD Billion) Forecast By Market Taxonomy, 2026 to 2036
- By Country
- China
- Japan
- South Korea
- Rest of East Asia
- By Offering
- By Technology
- By Application
- By End User
- By Country
- Market Attractiveness Analysis
- By Country
- By Offering
- By Technology
- By Application
- By End User
- Key Takeaways
- South Asia and Pacific Market Analysis and Forecast, By Country
- Historical Market Size Value (USD Billion) Trend Analysis By Market Taxonomy, 2021 to 2025
- Market Size Value (USD Billion) Forecast By Market Taxonomy, 2026 to 2036
- By Country
- India
- Australia
- Rest of South Asia and Pacific
- By Offering
- By Technology
- By Application
- By End User
- By Country
- Market Attractiveness Analysis
- By Country
- By Offering
- By Technology
- By Application
- By End User
- Key Takeaways
- Middle East and Africa Market Analysis and Forecast, By Country
- Historical Market Size Value (USD Billion) Trend Analysis By Market Taxonomy, 2021 to 2025
- Market Size Value (USD Billion) Forecast By Market Taxonomy, 2026 to 2036
- By Country
- Saudi Arabia
- UAE
- South Africa
- Rest of Middle East and Africa
- By Offering
- By Technology
- By Application
- By End User
- By Country
- Market Attractiveness Analysis
- By Country
- By Offering
- By Technology
- By Application
- By End User
- Key Takeaways
- Key Countries Market Analysis
- United States
- Pricing Analysis
- Market Share Analysis, 2025
- By Offering
- By Technology
- By Application
- By End User
- Canada
- Pricing Analysis
- Market Share Analysis, 2025
- By Offering
- By Technology
- By Application
- By End User
- Mexico
- Pricing Analysis
- Market Share Analysis, 2025
- By Offering
- By Technology
- By Application
- By End User
- Brazil
- Pricing Analysis
- Market Share Analysis, 2025
- By Offering
- By Technology
- By Application
- By End User
- Germany
- Pricing Analysis
- Market Share Analysis, 2025
- By Offering
- By Technology
- By Application
- By End User
- United Kingdom
- Pricing Analysis
- Market Share Analysis, 2025
- By Offering
- By Technology
- By Application
- By End User
- Italy
- Pricing Analysis
- Market Share Analysis, 2025
- By Offering
- By Technology
- By Application
- By End User
- Spain
- Pricing Analysis
- Market Share Analysis, 2025
- By Offering
- By Technology
- By Application
- By End User
- France
- Pricing Analysis
- Market Share Analysis, 2025
- By Offering
- By Technology
- By Application
- By End User
- India
- Pricing Analysis
- Market Share Analysis, 2025
- By Offering
- By Technology
- By Application
- By End User
- China
- Pricing Analysis
- Market Share Analysis, 2025
- By Offering
- By Technology
- By Application
- By End User
- Japan
- Pricing Analysis
- Market Share Analysis, 2025
- By Offering
- By Technology
- By Application
- By End User
- South Korea
- Pricing Analysis
- Market Share Analysis, 2025
- By Offering
- By Technology
- By Application
- By End User
- Russia
- Pricing Analysis
- Market Share Analysis, 2025
- By Offering
- By Technology
- By Application
- By End User
- Poland
- Pricing Analysis
- Market Share Analysis, 2025
- By Offering
- By Technology
- By Application
- By End User
- South Africa
- Pricing Analysis
- Market Share Analysis, 2025
- By Offering
- By Technology
- By Application
- By End User
- United States
- Market Structure Analysis
- Competition Dashboard
- Competition Benchmarking
- Market Share Analysis of Top Players
- By Regional
- By Offering
- By Technology
- By Application
- By End User
- Emerging Startups
- Innovation Benchmarking
- Competition Analysis
- Competition Deep Dive
- NVIDIA
- Overview
- Product Portfolio
- Profitability by Market Segments
- Sales Footprint
- Strategy Overview
- Marketing Strategy
- Product Strategy
- Channel Strategy
- Microsoft / Nuance
- Siemens Healthineers
- Tempus AI
- Lunit
- Owkin
- GE HealthCare
- Eko Health
- Intuitive Surgical
- Philips Healthcare
- Medtronic
- NVIDIA
- Case Studies
- Success Stories
- Recent Developments
- Competition Deep Dive
- Assumptions & Acronyms Used
List of Tables
- Table 1: Global Market Value (USD Billion) Forecast by Region, 2021 to 2036
- Table 2: Global Market Value (USD Billion) Forecast by Offering, 2021 to 2036
- Table 3: Global Market Value (USD Billion) Forecast by Technology, 2021 to 2036
- Table 4: Global Market Value (USD Billion) Forecast by Application, 2021 to 2036
- Table 5: Global Market Value (USD Billion) Forecast by End User, 2021 to 2036
- Table 6: North America Market Value (USD Billion) Forecast by Country, 2021 to 2036
- Table 7: North America Market Value (USD Billion) Forecast by Offering, 2021 to 2036
- Table 8: North America Market Value (USD Billion) Forecast by Technology, 2021 to 2036
- Table 9: North America Market Value (USD Billion) Forecast by Application, 2021 to 2036
- Table 10: North America Market Value (USD Billion) Forecast by End User, 2021 to 2036
- Table 11: Latin America Market Value (USD Billion) Forecast by Country, 2021 to 2036
- Table 12: Latin America Market Value (USD Billion) Forecast by Offering, 2021 to 2036
- Table 13: Latin America Market Value (USD Billion) Forecast by Technology, 2021 to 2036
- Table 14: Latin America Market Value (USD Billion) Forecast by Application, 2021 to 2036
- Table 15: Latin America Market Value (USD Billion) Forecast by End User, 2021 to 2036
- Table 16: Western Europe Market Value (USD Billion) Forecast by Country, 2021 to 2036
- Table 17: Western Europe Market Value (USD Billion) Forecast by Offering, 2021 to 2036
- Table 18: Western Europe Market Value (USD Billion) Forecast by Technology, 2021 to 2036
- Table 19: Western Europe Market Value (USD Billion) Forecast by Application, 2021 to 2036
- Table 20: Western Europe Market Value (USD Billion) Forecast by End User, 2021 to 2036
- Table 21: Eastern Europe Market Value (USD Billion) Forecast by Country, 2021 to 2036
- Table 22: Eastern Europe Market Value (USD Billion) Forecast by Offering, 2021 to 2036
- Table 23: Eastern Europe Market Value (USD Billion) Forecast by Technology, 2021 to 2036
- Table 24: Eastern Europe Market Value (USD Billion) Forecast by Application, 2021 to 2036
- Table 25: Eastern Europe Market Value (USD Billion) Forecast by End User, 2021 to 2036
- Table 26: East Asia Market Value (USD Billion) Forecast by Country, 2021 to 2036
- Table 27: East Asia Market Value (USD Billion) Forecast by Offering, 2021 to 2036
- Table 28: East Asia Market Value (USD Billion) Forecast by Technology, 2021 to 2036
- Table 29: East Asia Market Value (USD Billion) Forecast by Application, 2021 to 2036
- Table 30: East Asia Market Value (USD Billion) Forecast by End User, 2021 to 2036
- Table 31: South Asia and Pacific Market Value (USD Billion) Forecast by Country, 2021 to 2036
- Table 32: South Asia and Pacific Market Value (USD Billion) Forecast by Offering, 2021 to 2036
- Table 33: South Asia and Pacific Market Value (USD Billion) Forecast by Technology, 2021 to 2036
- Table 34: South Asia and Pacific Market Value (USD Billion) Forecast by Application, 2021 to 2036
- Table 35: South Asia and Pacific Market Value (USD Billion) Forecast by End User, 2021 to 2036
- Table 36: Middle East and Africa Market Value (USD Billion) Forecast by Country, 2021 to 2036
- Table 37: Middle East and Africa Market Value (USD Billion) Forecast by Offering, 2021 to 2036
- Table 38: Middle East and Africa Market Value (USD Billion) Forecast by Technology, 2021 to 2036
- Table 39: Middle East and Africa Market Value (USD Billion) Forecast by Application, 2021 to 2036
- Table 40: Middle East and Africa Market Value (USD Billion) Forecast by End User, 2021 to 2036
List of Figures
- Figure 1: Global Market Pricing Analysis
- Figure 2: Global Market Value (USD Billion) Forecast 2021-2036
- Figure 3: Global Market Value Share and BPS Analysis by Offering, 2026 and 2036
- Figure 4: Global Market Y-o-Y Growth Comparison by Offering, 2026-2036
- Figure 5: Global Market Attractiveness Analysis by Offering
- Figure 6: Global Market Value Share and BPS Analysis by Technology, 2026 and 2036
- Figure 7: Global Market Y-o-Y Growth Comparison by Technology, 2026-2036
- Figure 8: Global Market Attractiveness Analysis by Technology
- Figure 9: Global Market Value Share and BPS Analysis by Application, 2026 and 2036
- Figure 10: Global Market Y-o-Y Growth Comparison by Application, 2026-2036
- Figure 11: Global Market Attractiveness Analysis by Application
- Figure 12: Global Market Value Share and BPS Analysis by End User, 2026 and 2036
- Figure 13: Global Market Y-o-Y Growth Comparison by End User, 2026-2036
- Figure 14: Global Market Attractiveness Analysis by End User
- Figure 15: Global Market Value (USD Billion) Share and BPS Analysis by Region, 2026 and 2036
- Figure 16: Global Market Y-o-Y Growth Comparison by Region, 2026-2036
- Figure 17: Global Market Attractiveness Analysis by Region
- Figure 18: North America Market Incremental Dollar Opportunity, 2026-2036
- Figure 19: Latin America Market Incremental Dollar Opportunity, 2026-2036
- Figure 20: Western Europe Market Incremental Dollar Opportunity, 2026-2036
- Figure 21: Eastern Europe Market Incremental Dollar Opportunity, 2026-2036
- Figure 22: East Asia Market Incremental Dollar Opportunity, 2026-2036
- Figure 23: South Asia and Pacific Market Incremental Dollar Opportunity, 2026-2036
- Figure 24: Middle East and Africa Market Incremental Dollar Opportunity, 2026-2036
- Figure 25: North America Market Value Share and BPS Analysis by Country, 2026 and 2036
- Figure 26: North America Market Value Share and BPS Analysis by Offering, 2026 and 2036
- Figure 27: North America Market Y-o-Y Growth Comparison by Offering, 2026-2036
- Figure 28: North America Market Attractiveness Analysis by Offering
- Figure 29: North America Market Value Share and BPS Analysis by Technology, 2026 and 2036
- Figure 30: North America Market Y-o-Y Growth Comparison by Technology, 2026-2036
- Figure 31: North America Market Attractiveness Analysis by Technology
- Figure 32: North America Market Value Share and BPS Analysis by Application, 2026 and 2036
- Figure 33: North America Market Y-o-Y Growth Comparison by Application, 2026-2036
- Figure 34: North America Market Attractiveness Analysis by Application
- Figure 35: North America Market Value Share and BPS Analysis by End User, 2026 and 2036
- Figure 36: North America Market Y-o-Y Growth Comparison by End User, 2026-2036
- Figure 37: North America Market Attractiveness Analysis by End User
- Figure 38: Latin America Market Value Share and BPS Analysis by Country, 2026 and 2036
- Figure 39: Latin America Market Value Share and BPS Analysis by Offering, 2026 and 2036
- Figure 40: Latin America Market Y-o-Y Growth Comparison by Offering, 2026-2036
- Figure 41: Latin America Market Attractiveness Analysis by Offering
- Figure 42: Latin America Market Value Share and BPS Analysis by Technology, 2026 and 2036
- Figure 43: Latin America Market Y-o-Y Growth Comparison by Technology, 2026-2036
- Figure 44: Latin America Market Attractiveness Analysis by Technology
- Figure 45: Latin America Market Value Share and BPS Analysis by Application, 2026 and 2036
- Figure 46: Latin America Market Y-o-Y Growth Comparison by Application, 2026-2036
- Figure 47: Latin America Market Attractiveness Analysis by Application
- Figure 48: Latin America Market Value Share and BPS Analysis by End User, 2026 and 2036
- Figure 49: Latin America Market Y-o-Y Growth Comparison by End User, 2026-2036
- Figure 50: Latin America Market Attractiveness Analysis by End User
- Figure 51: Western Europe Market Value Share and BPS Analysis by Country, 2026 and 2036
- Figure 52: Western Europe Market Value Share and BPS Analysis by Offering, 2026 and 2036
- Figure 53: Western Europe Market Y-o-Y Growth Comparison by Offering, 2026-2036
- Figure 54: Western Europe Market Attractiveness Analysis by Offering
- Figure 55: Western Europe Market Value Share and BPS Analysis by Technology, 2026 and 2036
- Figure 56: Western Europe Market Y-o-Y Growth Comparison by Technology, 2026-2036
- Figure 57: Western Europe Market Attractiveness Analysis by Technology
- Figure 58: Western Europe Market Value Share and BPS Analysis by Application, 2026 and 2036
- Figure 59: Western Europe Market Y-o-Y Growth Comparison by Application, 2026-2036
- Figure 60: Western Europe Market Attractiveness Analysis by Application
- Figure 61: Western Europe Market Value Share and BPS Analysis by End User, 2026 and 2036
- Figure 62: Western Europe Market Y-o-Y Growth Comparison by End User, 2026-2036
- Figure 63: Western Europe Market Attractiveness Analysis by End User
- Figure 64: Eastern Europe Market Value Share and BPS Analysis by Country, 2026 and 2036
- Figure 65: Eastern Europe Market Value Share and BPS Analysis by Offering, 2026 and 2036
- Figure 66: Eastern Europe Market Y-o-Y Growth Comparison by Offering, 2026-2036
- Figure 67: Eastern Europe Market Attractiveness Analysis by Offering
- Figure 68: Eastern Europe Market Value Share and BPS Analysis by Technology, 2026 and 2036
- Figure 69: Eastern Europe Market Y-o-Y Growth Comparison by Technology, 2026-2036
- Figure 70: Eastern Europe Market Attractiveness Analysis by Technology
- Figure 71: Eastern Europe Market Value Share and BPS Analysis by Application, 2026 and 2036
- Figure 72: Eastern Europe Market Y-o-Y Growth Comparison by Application, 2026-2036
- Figure 73: Eastern Europe Market Attractiveness Analysis by Application
- Figure 74: Eastern Europe Market Value Share and BPS Analysis by End User, 2026 and 2036
- Figure 75: Eastern Europe Market Y-o-Y Growth Comparison by End User, 2026-2036
- Figure 76: Eastern Europe Market Attractiveness Analysis by End User
- Figure 77: East Asia Market Value Share and BPS Analysis by Country, 2026 and 2036
- Figure 78: East Asia Market Value Share and BPS Analysis by Offering, 2026 and 2036
- Figure 79: East Asia Market Y-o-Y Growth Comparison by Offering, 2026-2036
- Figure 80: East Asia Market Attractiveness Analysis by Offering
- Figure 81: East Asia Market Value Share and BPS Analysis by Technology, 2026 and 2036
- Figure 82: East Asia Market Y-o-Y Growth Comparison by Technology, 2026-2036
- Figure 83: East Asia Market Attractiveness Analysis by Technology
- Figure 84: East Asia Market Value Share and BPS Analysis by Application, 2026 and 2036
- Figure 85: East Asia Market Y-o-Y Growth Comparison by Application, 2026-2036
- Figure 86: East Asia Market Attractiveness Analysis by Application
- Figure 87: East Asia Market Value Share and BPS Analysis by End User, 2026 and 2036
- Figure 88: East Asia Market Y-o-Y Growth Comparison by End User, 2026-2036
- Figure 89: East Asia Market Attractiveness Analysis by End User
- Figure 90: South Asia and Pacific Market Value Share and BPS Analysis by Country, 2026 and 2036
- Figure 91: South Asia and Pacific Market Value Share and BPS Analysis by Offering, 2026 and 2036
- Figure 92: South Asia and Pacific Market Y-o-Y Growth Comparison by Offering, 2026-2036
- Figure 93: South Asia and Pacific Market Attractiveness Analysis by Offering
- Figure 94: South Asia and Pacific Market Value Share and BPS Analysis by Technology, 2026 and 2036
- Figure 95: South Asia and Pacific Market Y-o-Y Growth Comparison by Technology, 2026-2036
- Figure 96: South Asia and Pacific Market Attractiveness Analysis by Technology
- Figure 97: South Asia and Pacific Market Value Share and BPS Analysis by Application, 2026 and 2036
- Figure 98: South Asia and Pacific Market Y-o-Y Growth Comparison by Application, 2026-2036
- Figure 99: South Asia and Pacific Market Attractiveness Analysis by Application
- Figure 100: South Asia and Pacific Market Value Share and BPS Analysis by End User, 2026 and 2036
- Figure 101: South Asia and Pacific Market Y-o-Y Growth Comparison by End User, 2026-2036
- Figure 102: South Asia and Pacific Market Attractiveness Analysis by End User
- Figure 103: Middle East and Africa Market Value Share and BPS Analysis by Country, 2026 and 2036
- Figure 104: Middle East and Africa Market Value Share and BPS Analysis by Offering, 2026 and 2036
- Figure 105: Middle East and Africa Market Y-o-Y Growth Comparison by Offering, 2026-2036
- Figure 106: Middle East and Africa Market Attractiveness Analysis by Offering
- Figure 107: Middle East and Africa Market Value Share and BPS Analysis by Technology, 2026 and 2036
- Figure 108: Middle East and Africa Market Y-o-Y Growth Comparison by Technology, 2026-2036
- Figure 109: Middle East and Africa Market Attractiveness Analysis by Technology
- Figure 110: Middle East and Africa Market Value Share and BPS Analysis by Application, 2026 and 2036
- Figure 111: Middle East and Africa Market Y-o-Y Growth Comparison by Application, 2026-2036
- Figure 112: Middle East and Africa Market Attractiveness Analysis by Application
- Figure 113: Middle East and Africa Market Value Share and BPS Analysis by End User, 2026 and 2036
- Figure 114: Middle East and Africa Market Y-o-Y Growth Comparison by End User, 2026-2036
- Figure 115: Middle East and Africa Market Attractiveness Analysis by End User
- Figure 116: Global Market - Tier Structure Analysis
- Figure 117: Global Market - Company Share Analysis
Frequently Asked Questions
How big is the artificial intelligence in healthcare market expected to be by 2036?
FMI projects the market will reach USD 80.7 billion by 2036, up from USD 18.0 billion in 2026, growing at a CAGR of 16.2% across the forecast period.
Which offering segment leads the market in 2026?
Hardware leads the offering breakdown with 60.2% of the 2026 market in FMI's assessment. The FDA device list does not measure this revenue share. [1]
Which other breakdowns lead the market in 2026?
Robot-Assisted Surgery leads application at 30.0%, and Healthcare Providers lead end user at 60.0%, in FMI's 2026 assessment.
Which country is projected to grow fastest from 2026 to 2036?
China has the highest forecast CAGR among the eight profiled countries, at 17.1% from 2026 to 2036.
Does medical-device authorisation guarantee reimbursement?
No. Marketing authorisation and payment are separate decisions. Eko's SENSORA information specifies an eligible outpatient OPPS route and notes that physician-fee coverage varies by carrier. [9]
Preview the report firsthand - request a free sample
Get SampleGet the brochure for pricing and purchase details.
Get PDF
