
- Market Size (2026)
- USD 57.5 Bn
- Forecast (2036)
- USD 95.5 Bn
- CAGR (2026 to 2036)
- 5.2%
How big is Art Tourism Market in 2026?
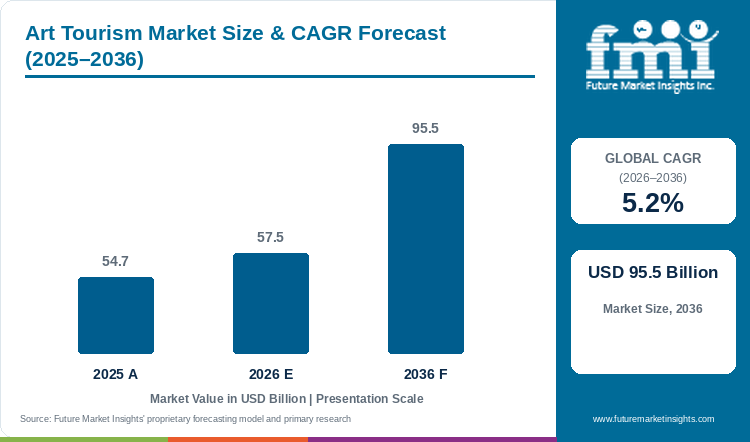
Sector valuation increases from USD 54.7 billion in 2025 to USD 57.5 billion in 2026 and is predicted to reach USD 95.5 billion by 2036. Demand for art tourism is projected to rise at 5.2% CAGR through 2036.
According to Future Market Insights analysis, the global art tourism market stands at USD 54.7 billion in 2025 and rises to USD 57.5 billion in 2026. Industry valuation is projected to reach USD 95.5 billion by 2036, expanding at a 5.2% CAGR and generating USD 38.0 billion in added industry valuation. Destination art fairs and permanent immersive digital museums convert short city breaks into high-yield cultural stays as galleries and museum patrons travel for in-person viewings. In March 2026, MCH Group AG reported USD 485.3 million in 2025 operating receipts and a 50% surge in annual EBITDA at an 11.9% margin following the premiere of Art Basel Qatar and the Zero 10 digital art initiative. To monetize collector travel across commercial trade exhibitions, international biennials and art fairs with exhibitions capture 39.4% of art experience demand in 2026, although fine-art transit insurance costs still restrain mid-tier galleries.
Key Market Trends & Insights
- By art experience. Based on art experience, international biennials and art fairs with exhibitions are projected to account for 39.4% in 2026, driven by marquee fair weeks bundling VIP previews with museum galas.
- By traveler type. Within traveler type, cultural enthusiasts and leisure tourists are estimated to hold 61.8% in 2026, supported by timed-entry museum passes and immersive light halls attracting city-break crowds.
- By trip scope. By trip scope, international art-focused trips are forecast to represent 56.2% in 2026, owing to cross-border visitors combining flagship national galleries with biennial circuits.
- By party size and age cohort. In 2026, couples and dual-traveler bookings are expected to lead party size with 43.8% share, while Millennials and Gen-X aged 28 to 54 years hold 48.3% of traveler age cohort demand.
- By expenditure tier and payment method. Mid-scale and upper-midscale experiences are likely to capture 50.6% share of expenditure tier in 2026, while digital wallets and credit cards with loyalty redemption represent 71.1% of payment volume.
Regional Highlights
- National growth outlook. Japan is projected to expand at a 5.9% CAGR through 2036 under surging Tokyo digital museum attendance, while South Korea advances at a 5.6% CAGR through Seoul international art fair circuits.
- Broader country progression. Spain is forecast to grow at a 5.4% CAGR ahead of the United States at 5.3% and France at 5.1%, while the United Kingdom records 5.0% and Italy and Germany post 4.9% and 4.8%.
Market Size & Forecast
Table 1: Market Size and Forecast for the Art Tourism Market (USD billion and CAGR percentage), 2025 to 2036
| Metric | Value |
|---|---|
| 2025 Market Size | USD 54.7 billion |
| Estimated Market Size in 2026 | USD 57.5 billion |
| Projected Market Size by 2036 | USD 95.5 billion |
| CAGR, 2026 to 2036 | 5.2% |
| Added Valuation, 2026 to 2036 | USD 38.0 billion |
National cultural tourism trajectories diverge between East Asian digital art hubs and European heritage capitals managing museum crowding caps. In March 2026, the Art Basel and UBS Art Market Report confirmed that art fair transactions rose to 35% of global dealer billings in 2025 while online-only share fell 6% to 16% as collectors returned to physical fairs. Hospitality groups partner with museum cultural districts to bundle private curatorial tours.
Cultural Visitor-Pool and Exhibition Attendance Sizing
Table 2: Cultural Visitor-Pool and Exhibition Attendance Sizing for the Art Tourism Market (USD billion and operational ranges), 2025 to 2036
| Metric | 2025 | 2026 | 2036 |
|---|---|---|---|
| Market size (USD billion) | 54.7 | 57.5 | 95.5 |
| Art-motivated domestic and international trips (million) | 118.0 to 128.0 | 124.0 to 135.0 | 195.0 to 212.0 |
| Paid museum and fair plus immersive art admissions (million) | 340.0 to 370.0 | 358.0 to 390.0 | 540.0 to 585.0 |
| Average expenditure per art tourism trip (USD) | 425.0 to 465.0 | 430.0 to 470.0 | 455.0 to 495.0 |
Operational note. Cultural visitor-pool ranges calibrate museum and art-fair attendance registries against multi-day hotel and ticketing plus curatorial tour outlays.
National art museums and private foundations depend on international cultural tourists to fund blockbuster exhibition loans and conservation laboratories. Tour operators package cultural heritage destinations with private after-hours gallery viewings to lift per-visitor ancillary yields.
Per Capita & Cultural Venue Sizing
Table 3: Per Capita and Venue Expenditure Indicators for the Art Tourism Market (USD), 2025 to 2036
| Metric | 2025 | 2026 | 2036 |
|---|---|---|---|
| World population (billion) | 8.2 | 8.3 | 9.0 |
| Market valuation per capita (USD) | 6.7 | 6.9 | 10.6 |
| Average ticket and tour spend per art visitor (USD) | 68.0 to 115.0 | 72.0 to 122.0 | 105.0 to 175.0 |
| Digital wallet and card payment share (%) | 69.5% to 71.0% | 70.5% to 72.0% | 78.0% to 82.0% |
Table 4: Exhibition Venue and Segment Allocation Indicators for the Art Tourism Market (USD and percentages), 2026
| Metric | Value | Institutional Reference Basis |
|---|---|---|
| Market size, 2026 | USD 57.5 billion | 2026 global valuation baseline |
| Major art museums and biennials plus fairs globally | 48,500 venues | Global museum and gallery plus art-fair registry |
| Annual art tourism valuation per venue | USD 1.19 million | Annualized visitor ticketing and tour plus trip allocation |
| Biennials and art fairs plus exhibitions valuation, 2026 | USD 22.7 billion | 39.4% art experience segment allocation |
Exhibition organizers balance VIP collector hospitality against public timed-entry ticketing to maximize venue attendance across five-day art fairs and six-month biennials. Destination concierges integrate curated cultural travel itineraries with auction house preview weeks in New York and London plus Paris and Hong Kong.
Analyst Perspective
"Art tourism economics reward cities that pair marquee international art fairs with permanent immersive digital museums. Operators combining mobile timed-entry ticketing with VIP curator access capture both high-volume leisure millennials and ultra-high-net-worth collectors."
- Ronak Shah, Principal Consultant, Future Market Insights.
How is the art tourism market segmented?
The art tourism market is segmented by seven primary commercial axes and region, covering art experience, traveler type, trip scope, party size, traveler age cohort and expenditure tier plus payment and financing method. In 2026, international biennials and art fairs with exhibitions are projected at 39.4%, cultural enthusiasts and leisure tourists at 61.8%, international art-focused trips at 56.2%, couples and dual-traveler bookings at 43.8%, Millennials and Gen-X at 48.3% and mid-scale and upper-midscale experiences at 50.6% plus digital wallets and credit cards at 71.1%.
By art experience. International biennials and art fairs with exhibitions and fine art galleries, plus immersive digital art installations and street art studio trails.
By traveler type. Cultural enthusiasts and leisure tourists and high-net-worth art collectors and curators plus academic and student art groups.
By trip scope and party size. International art-focused trips and domestic cultural weekend trips, with couples and dual-traveler bookings plus multi-person families and solo consumers.
By traveler age cohort. Millennials and Gen-X aged 28 to 54 years and affluent boomers and seniors aged 55+ years plus Gen-Z and young adult explorers.
By expenditure tier and payment method. Mid-scale and upper-midscale experiences plus luxury VIP and value tiers, settled via digital wallets and credit cards with buy-now-pay-later and corporate wire plans.
Why do international biennials and art fairs lead art experience demand?
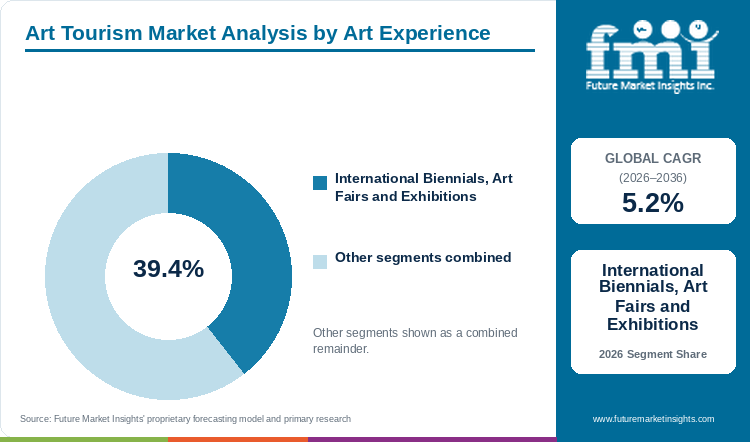
Based on art experience, international biennials and art fairs are projected to hold 39.4% in 2026, driven by collector travel.
Table 5: Art Experience Share for the Art Tourism Market (percentage share), 2026
| Art Experience | Share (2026) |
|---|---|
| International Biennials and Art Fairs plus Exhibitions | 39.4% |
| Other Segments Combined | 60.6%* |
| Total | 100.0% |
*Note. Gallery tours and digital projection venues plus street-art districts complete 100.0% of 2026 art experience valuation.
Table 6: Art Experience Leadership and Market Growth for the Art Tourism Market (segment and CAGR percentage), 2026 to 2036
| Metric | Value |
|---|---|
| Global CAGR (2026 to 2036) | 5.2% |
| Leading Segment | International Biennials and Art Fairs plus Exhibitions |
FMI research indicates that flagship international art fairs and Venice-style biennials synchronize museum openings and private collection previews across host cities. Fair organizers deploy contactless venue ticketing and VIP digital passes to manage timed collector entry and satellite pavilion traffic.
- Within art experience, international biennials and art fairs with exhibitions are likely to secure 39.4% share in 2026, supported by marquee collector weeks.
- According to Frieze Events Ltd. in October 2026, Frieze London and Frieze Masters 2026 welcomed 95,000 visitors from 108 countries and institutional delegations from 426 museums across 51 nations, led by a USD 6.5 million Old Master placement.
What supports cultural enthusiasts and leisure tourists in traveler type?
By traveler type, cultural enthusiasts and leisure tourists are estimated to hold 61.8% in 2026, supported by city museum passes.
Broad leisure tourists and museum members generate the majority of global exhibition admissions and guided gallery walk bookings. Destination marketing organizations bundle contemporary art museums with historic heritage sites on multi-attraction digital city passes.
- Cultural enthusiasts and leisure tourists are expected to command 61.8% of traveler type demand in 2026, underpinned by blockbuster museum retrospectives.
- In February 2026, Tripadvisor Inc. reported that its Viator experiences segment grew 2025 receipts by 10% to USD 924 million across 22.9 million experience bookings (+16% year-on-year) and USD 4.7 billion in gross bookings value (+13%).
How are international art-focused trips gaining use across trip scope?
In 2026, international art-focused trips are expected to lead trip scope with 56.2% share, owing to cross-border cultural stays.
Cross-border art tourists stay three to five times longer in destination hotels and spend substantially more on museum catalogues and guided tours than domestic day-trippers. International museums deploy multilingual interactive event applications and audio-visual guides to serve overseas cultural visitors.
- International art-focused trips are projected to hold 56.2% share of trip scope valuation in 2026, fueled by overseas museum patrons.
- According to the April 2026 UK Department for Culture, Media and Sport (DCMS) annual headline release, the 15 DCMS-sponsored museums recorded 42.0 million visits in FY2024/25 including 19.4 million overseas visits (46% of total attendance).
Why are buyers selecting dual-traveler bookings within party size and age?
By party size, couples and dual-traveler bookings are forecast to represent 43.8% in 2026, underpinned by weekend gallery travel.
Dual-traveler couples and career-established Millennials and Gen-Xers (48.3% of traveler age cohort demand) dominate weekend gallery district hotel stays and contemporary auction previews. Auction houses and immersive art collectives design evening cocktail viewings and dual-ticket packages tailored to 28-to-54-year-old cultural travelers.
- The party size category is forecast to be led by couples and dual-traveler bookings at 43.8% share in 2026, sustained by paired exhibition packages.
- A May 2026 empirical PLS-SEM study in Frontiers in Psychology (PMC13192015) found that spatial immersion strongly drives tourist emotional arousal (beta = 0.736, p < 0.001) and participation behavior (total effect = 0.474), with 68.7% of surveyed visitors traveling in pairs.
Which market conditions keep mid-scale experiences and digital wallets relevant?
Mid-scale and upper-midscale experiences are likely to capture 50.6% share in 2026, reinforced by digital wallet mobile ticketing.
Tiered museum admissions and USD 35 to USD 85 immersive digital art tickets plus small-group curator walks make mid-scale and upper-midscale cultural packages the core volume engine of art tourism. Simultaneously, digital wallets and credit cards with loyalty redemption capture 71.1% of payment volume across cross-border museum checkout.
- Within expenditure tier, mid-scale and upper-midscale experiences are anticipated to maintain the leading position with 50.6% share in 2026, enabled by timed-entry passes.
- In February 2026, teamLab Inc. announced that its two Tokyo digital art museums welcomed over 4.2 million visitors in 2025 (2.51 million at teamLab Planets and 1.69 million at teamLab Borderless) via official online ticket and digital wallet checkout.
What are the drivers and restraints plus opportunities in the art tourism market?
In the art tourism market, the key driver is immersive digital museum expansion and the key restraint is fine-art transit insurance plus the key opportunity is regional boutique art fairs.
- Driver. Permanent digital projection museums and flagship international art fairs convert cultural curiosity into high-frequency international city breaks.
- Restraint. Higher fine-art crating and climate-controlled air freight plus museum timed-entry capacity caps limit visitor throughput at historic European palaces.
- Opportunity. New boutique regional art fairs in Doha and Seoul plus Miami and Tokyo with curator-led hotel packages are projected to capture affluent millennial travel.
Multisensory Exhibitions and Museum Revisit Demand
Multisensory exhibition design and landmark museum reopenings stimulate repeat domestic and international cultural tourism across major capitals. According to FMI analysis, travelers combine contemporary art biennials with heritage monument tours to experience architectural landmarks with modern installations. A November 2025 study of 14,163 cultural tourism reviews and 547 tourists published in PLOS One (PMC12591403) demonstrated that rich cultural tourism experiences directly boost tourist satisfaction (beta = 0.533) and revisit intention (beta = 0.686). In addition, a May 2026 grounded-theory study of 120 museum visitors in Frontiers in Psychology (PMID 42272712) confirmed that multisensory exhibition spaces strengthen emotional memory and destination loyalty. Museum memberships and multi-day passes lock in recurring city-break attendance.
Dealer Booth Inflation and Museum Crowding Caps
Elevated booth rental fees and art shipping insurance plus dealer operating cost inflation represent the primary restraints limiting gallery participation across secondary art fairs. When mid-sized galleries face 5% annual operating cost increases and customs bond delays, they consolidate travel into three or four top-tier global fairs rather than regional exhibitions. A December 2025 Super-SBM-DEA study across 30 provinces in Frontiers in Public Health (PMC12741962) showed that regional cultural heritage tourism efficiency lags wherever transport capacity (beta = 0.117) and technological innovation (beta = 0.371) remain underfunded. Meanwhile, 38% of surveyed art dealers reported lower profitability in 2025 despite USD 34.8 billion in global dealer billings. Curators and travel agency concierge services must navigate strict daily visitor caps.
Immersive Projection Halls and Gulf Fair Hubs
Exhibition operators capture high-margin growth by developing permanent digital art centers and launching fairs in Gulf and Asian capitals. Unlike traditional loan exhibitions requiring costly crating, digital projection halls scale with high hourly throughput and strong evening yields. In September 2026, MCH Group AG reported a 12% year-on-year rise in first-half 2026 operating receipts to USD 281.1 million, propelled by the inaugural edition of Art Basel Qatar and a 20% stake in the Jupiter Festival in Miami. Similarly, a May 2026 configurational study in Frontiers in Sports and Active Living (PMID 42181511) confirmed that integrating cultural venues with culinary and cultural trails maximizes regional tourist expenditure. Bundled VIP fair access with luxury hotel packages attracts younger cross-border collectors.
Art Tourism Market by Country (2026 to 2036)
As per FMI, Japan leads art tourism expansion across major cultural destinations at a 5.9% annual clip through 2036, while Germany progresses at a 4.8% yearly pace. Commercial performance across European museum capitals and North American auction hubs plus East Asian digital art centers depends on international air arrivals and flagship biennial calendars.
Table 7: Country CAGR and Primary Growth Levers for the Art Tourism Market (CAGR percentage and operational drivers), 2026 to 2036
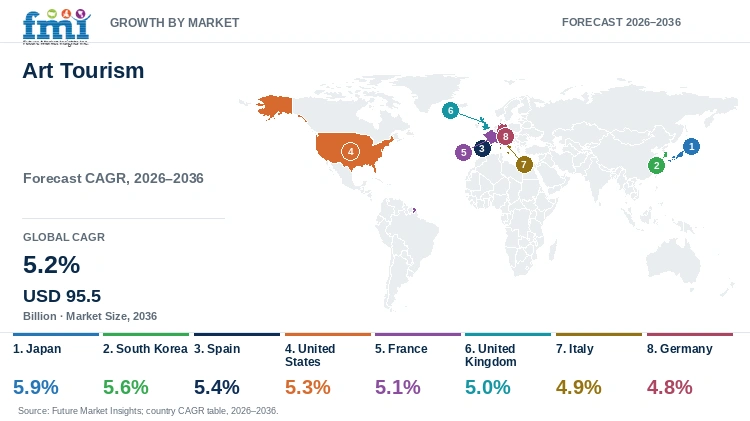
| Country | CAGR (2026 to 2036) | Primary Growth Lever |
|---|---|---|
| Japan | 5.9% | Record Tokyo teamLab digital museum attendance and Naoshima Setouchi art island tourism |
| South Korea | 5.6% | Frieze Seoul and Kiaf SEOUL collector inflows plus Seoul and Jeju digital art centers |
| Spain | 5.4% | Record Madrid State Museum attendance and ARCOmadrid plus Bilbao Guggenheim cultural corridors |
| United States | 5.3% | USD 26.0B art market hub, Art Basel Miami Beach and Frieze LA plus Smithsonian museum traffic |
| France | 5.1% | Art Basel Paris at Grand Palais and Louvre and Orsay overseas attendance plus Culturespaces hubs |
| United Kingdom | 5.0% | 19.4M overseas visits to DCMS museums, Frieze London and V&A East Storehouse plus auction weeks |
| Italy | 4.9% | Venice Biennale international pavilions and Florence Uffizi plus Rome Vatican Jubilee art trails |
| Germany | 4.8% | Berlin Gallery Weekend, Art Cologne and Documenta Kassel plus Phoenix and Port des Lumieres hubs |
Source: Future Market Insights analysis
Japan Art Tourism Market Outlook (2026 to 2036)
Unlike European capitals that rely primarily on classical painting collections, Japan combines interactive digital art museums in Tokyo with architectural art islands across the Seto Inland Sea. According to teamLab Inc. in February 2026, teamLab Planets in Toyosu welcomed 2.51 million visitors and teamLab Borderless in Azabudai Hills drew 1.69 million visitors in 2025, totaling over 4.2 million admissions led by visitors from the United States and Australia plus the UK. By 2036, Japan is projected to grow at 5.9% CAGR, driven by new contemporary museums in Tokyo and Naoshima attracting long-haul cultural travelers. Peak spring cherry-blossom and autumn hotel compression in Tokyo and Kyoto requires mandatory advance timed-entry digital ticketing.
Key takeaway: In Japan, over 4.2 million annual teamLab Tokyo admissions and Setouchi art island circuits propel art tourism at a 5.9% CAGR.
South Korea Art Tourism Market Outlook (2026 to 2036)
Per the March 2026 Art Basel and UBS Art Market Report, global art transaction volume reached 41.5 million transactions in 2025 (+2% year-on-year) while public auction billings climbed 9% in value, supported by active young Asian collector participation. South Korea anchors East Asian contemporary art travel by pairing Frieze Seoul and Kiaf SEOUL at COEX with museum districts in Samcheong-dong and Hannam-dong plus Culturespaces projection centers in Seoul and Jeju. South Korea's art tourism outlook is anticipated to advance at 5.6% CAGR over the assessment period, supported by luxury hotel art packages and tax-free gallery districts. High exhibition hall rental rates in Gangnam compel independent galleries to stage satellite warehouse shows across Seongsu-dong.
Key takeaway: In South Korea, Frieze Seoul collector weeks and permanent immersive digital museums in Seoul and Jeju drive a 5.6% CAGR.
Spain Art Tourism Market Outlook (2026 to 2036)
Spain anchors Southern European art tourism through Madrid's UNESCO-listed Paseo del Arte triangle (Prado and Reina Sofia with Thyssen-Bornemisza) plus Bilbao's Guggenheim Museum and Barcelona's foundations. According to the Spanish Ministry of Culture in January 2026, Spain's 16 State Museums recorded more than 2.8 million visitors across 72 temporary exhibitions in 2025, with the National Archaeological Museum in Madrid achieving an all-time record above 860,000 visits. Art tourism demand in Spain is forecast to rise at 5.4% CAGR over the forecast period, underpinned by Latin American and North American collector inflows around ARCOmadrid. Summer heatwaves in inland capitals encourage cultural tour operators to promote autumn and spring exhibition calendars.
Key takeaway: In Spain, record Madrid State Museum attendance and multi-city contemporary museum corridors drive a 5.4% annual growth rate.
United States Art Tourism Market Outlook (2026 to 2036)
In October 2026, the National Endowment for the Arts reported that arts and cultural production added USD 1.2 trillion to the U.S. economy, expanding at twice the pace of the broader economy. Per the Smithsonian Institution in January 2026, Smithsonian museums recorded 14.9 million visits in 2025 including 1.1 million at the Smithsonian American Art Museum and Renwick Gallery plus 937,716 at the National Portrait Gallery. Adoption of art tourism packages in the United States is estimated to expand at 5.3% CAGR through 2036, fueled by Art Basel Miami Beach and Frieze Los Angeles plus major museum reopenings such as the Frick Collection in New York. Elevated fair-week hotel rates push price-sensitive domestic visitors toward shoulder-month museum stays.
Key takeaway: Across U.S. cultural corridors, New York auction and museum flagships plus Art Basel Miami Beach and Frieze LA sustain a 5.3% CAGR.
France Art Tourism Market Outlook (2026 to 2036)
France commands the highest international museum density in Europe, anchored by the Louvre and Musee d'Orsay plus Fondation Louis Vuitton and Art Basel Paris at the restored Grand Palais. In February 2026, the French Ministry of Culture designated 11 International Production and Distribution Hubs (PIPD) uniting 45 visual arts and museum institutions to expand cross-border exhibition touring. Meanwhile, Culturespaces SAS scaled its 2026 immersive exhibitions including Renaissance at Atelier des Lumieres in Paris and Matisse at Bassins des Lumieres in Bordeaux. The French art tourism sector is projected to record 5.1% CAGR during the assessment period, enabled by Grand Palais collector traffic, though strict daily timed-slot ceilings at the Louvre require advance booking.
Key takeaway: In France, Art Basel Paris at the Grand Palais and Culturespaces immersive centers support a 5.1% art tourism CAGR.
United Kingdom Art Tourism Market Outlook (2026 to 2036)
London's hybrid model of free permanent national gallery collections paired with paid blockbuster exhibitions and Frieze Week plus Christie's and Sotheby's marquee auctions makes the United Kingdom a premier cross-border art tourism hub. According to the September 2026 UK DCMS monthly dataset, DCMS-sponsored museums and galleries recorded 11.5 million visits during April to June 2026 (+0.7% year-on-year), building on 42.0 million full-year visits where overseas tourists accounted for 46% of total footfall. In the United Kingdom, art tourism demand is predicted to advance at 5.0% CAGR through 2036, reinforced by the V&A East Storehouse opening in London housing over 500,000 creative works. Post-Brexit temporary admission customs paperwork still restrains impulsive gallery shipping.
Key takeaway: In the UK, 42.0 million annual DCMS museum visits and Frieze London collector inflows underpin a 5.0% CAGR through 2036.
Italy Art Tourism Market Outlook (2026 to 2036)
Whereas modern art capitals depend on commercial dealer fairs, Italy blends La Biennale di Venezia with Renaissance masterworks across Florence and Rome plus Milan and Turin. According to the March 2025 Istat tourist flows report, Italy generated 458.4 million tourist nights including 250.1 million international visitor nights (+6.8% year-on-year), with art cities and Venice biennial pavilions driving 54.6% foreign guest share. Italy is estimated to post 4.9% CAGR over the forecast period, aided by state museums modernizing digital ticketing and opening restored archaeological and contemporary wings. Venice day-tripper access fees and strict microclimate visitor limits inside frescoed chapels cap peak-hour crowd density across historic palazzi.
Key takeaway: In Italy, alternating Venice Art and Architecture Biennials plus Renaissance museum corridors sustain a 4.9% annual growth rate.
Germany Art Tourism Market Outlook (2026 to 2036)
In 2025 and 2026, Culturespaces expanded its German digital immersive footprint at Phoenix des Lumieres in Dortmund and Port des Lumieres in Hamburg, staging Gustav Klimt and Monet with Hundertwasser projection exhibitions for European tourists. Germany distributes art tourism across polycentric cultural hubs including Berlin's Museum Island and Gallery Weekend plus Art Cologne and Munich's Kunstareal plus Kassel's quinquennial Documenta exhibition. Between 2026 and 2036, the German market is expected to progress at 4.8% CAGR, influenced by municipal cultural budgets and cross-border rail passes facilitating multi-city museum itineraries. Elevated energy and security operating costs across municipal Kunsthallen lead museums to raise special-exhibition ticket prices.
Key takeaway: In Germany, Berlin Gallery Weekend and Art Cologne with Dortmund and Hamburg digital art centers support a 4.8% CAGR.
Geographic coverage for art tourism spans North and South America with European cultural capitals plus Asian and Middle East and African regions.
Who are the notable companies in the art tourism market?
MCH Group AG Art Basel and Frieze Events Ltd. plus TeamLab Inc., Culturespaces SAS, Christie's International plc, Sotheby's and Viator Inc. plus Meow Wolf Inc. are the notable companies in the art tourism market.
FMI's company analysis describes a moderately specialized competitive arena spanning global art-fair organizers and permanent digital art museum operators, plus marquee auction houses and online cultural tour marketplaces. International fair groups curate high-value collector weeks across Basel and Paris and Miami Beach and New York plus Hong Kong and Doha plus London and Seoul. Immersive digital collectives and cultural ticketing platforms monetize high-volume leisure attendance through timed-entry projection halls and curated museum tours.
- Global Art Fair & Biennial Organizers. MCH Group AG Art Basel and Frieze Events Ltd. anchor international collector travel and VIP preview weeks plus city-wide museum activations.
- Immersive Digital Art & Exhibition Operators. TeamLab Inc. and Culturespaces SAS plus Meow Wolf Inc. operate permanent high-capacity digital and experiential art centers.
- Marquee Auction Houses & Cultural Tour Platforms. Christie's International plc and Sotheby's host public pre-sale museum-grade exhibitions while Viator Inc. aggregates curated gallery and museum tours.
Competitive Benchmarking for the Art Tourism Market
Table 8: Competitive Benchmarking for the Art Tourism Market (qualitative capability ratings), 2026
| Company | Flagship Fair & Exhibition Scale | Digital & Immersive Capability | VIP Collector & Tour Reach | Geographic Reach |
|---|---|---|---|---|
| MCH Group AG Art Basel | High | Medium | High | High |
| Frieze Events Ltd. | High | Medium | High | High |
| TeamLab Inc. | High | High | Medium | High |
| Culturespaces SAS | High | High | Medium | High |
| Christie's International plc | High | Medium | High | High |
| Sotheby's | High | Medium | High | High |
| Viator Inc. | Medium | High | High | High |
| Meow Wolf Inc. | Medium | High | Medium | Medium |
Scoring basis. High and Medium capability ratings evaluate documented annual visitor admissions and international gallery exhibitor depth, plus current collector concierge activity and geographic reach. Ratings reflect verified exhibition venues and fair editions across Europe and North America plus the Middle East and Asia-Pacific rather than a market-share ranking.
Key Developments in the Art Tourism Market
- In October 2026, Frieze Events Ltd. welcomed 95,000 visitors from 108 countries and 426 institutional museum delegations at Frieze London and Frieze Masters after drawing over 32,000 visitors to Frieze Los Angeles in March 2026.
- In September 2026, MCH Group AG reported a 12% rise in first-half 2026 operating receipts to USD 281.1 million following the launch of Art Basel Qatar and a 20% stake in the Jupiter Festival in Miami.
- In December 2025, Christie's International plc reported USD 6.2 billion in projected 2025 global auction and private billings (+6% year-on-year), with 81% of bids placed online and 46% of new buyers and bidders millennials or younger.
Key Players in the Art Tourism Market
International Art Fair and Exhibition Organizers
- MCH Group AG Art Basel
- Frieze Events Ltd.
Immersive Digital Art and Monument Operators
- TeamLab Inc.
- Culturespaces SAS
- Meow Wolf Inc.
Global Auction Houses and Cultural Tour Marketplaces
- Christie's International plc
- Sotheby's
- Viator Inc.
Art Tourism Market Report Scope
Table 9: Report Scope for the Art Tourism Market (coverage fields and definitions), 2026 to 2036
| Coverage field | Report scope |
|---|---|
| Market breakdown | Art Experience, Traveler Type, Trip Scope, Party Size, Traveler Age Cohort and Expenditure Tier plus Payment and Financing Method |
| Quantitative Units | USD Billion |
| Market Definition | Includes art-motivated tourist expenditure across international biennials and art fairs, museum and gallery admissions, immersive digital art installations and guided street art and studio trails plus associated trip hospitality. Excludes hammer prices of fine art acquisitions and institutional museum endowment grants. |
| Regions Covered | North America, Latin America, Western Europe, Eastern Europe, East Asia and South Asia and Pacific plus Middle East and Africa |
| Countries Covered | Japan, South Korea, Spain, United States, France, United Kingdom, Italy and Germany plus additional countries in the full report |
| Key Companies Covered | MCH Group AG Art Basel, Frieze Events Ltd., TeamLab Inc., Culturespaces SAS, Christie's International plc, Sotheby's and Viator Inc. plus Meow Wolf Inc. |
| Forecast Period | 2026 to 2036 |
| Approach | Primary and secondary research with top-down and bottom-up market triangulation; segment shares and forecasts are proprietary analytical estimates. |
Art Tourism Market Research Methodology
Table 10: Research Methodology for the Art Tourism Market (research methods and approach), 2026 edition
| Method | Approach |
|---|---|
| Primary Research | Analysts gathered input from art fair directors, museum visitor-services heads, digital art studio producers and auction house hospitality teams plus cultural tour operators to examine ticketing and VIP preview packages plus visitor conversion. |
| Desk Research | Desk research covered UK DCMS museum performance indicators, Smithsonian visitor logs, Spanish Ministry of Culture releases, Art Basel and UBS Art Market Reports and peer-reviewed cultural psychology studies plus corporate filings. |
| Market Sizing and Forecasting | The valuation framework combined the 2025 baseline with historical attendance, segment structure, ticket and tour pricing and cross-border visitor shares plus country-level demand conditions from 2026 to 2036. |
| Country Forecasting Model | Country projections weight international museum footfall, flagship art-fair calendars and immersive digital venue openings plus inbound cultural tourist arrivals across eight evaluated economies. |
| Operational Benchmark Traceability | Visitor-pool and venue indicators in Tables 2 and 3 plus 4 trace to UK DCMS, Smithsonian Institution, teamLab Tokyo and Frieze London plus Tripadvisor Viator disclosures. |
| Data Validation | Estimates were checked against commercial ticketing and cultural tour bookings while excluding multi-million-dollar fine art hammer prices and museum endowment grants to prevent double counting. |
Art Tourism Market by Segments
Art Tourism Market segmented by Art Experience
- International Biennials, Art Fairs and Exhibitions
- Fine Art Galleries and Auction House Tours
- Immersive Digital Art Installations
- Street Art Districts and Artist Studio Trails
Art Tourism Market segmented by Traveler Type
- Cultural Enthusiasts and Leisure Tourists
- High-Net-Worth Art Collectors and Curators
- Academic and Student Art Groups
Art Tourism Market segmented by Trip Scope
- International Art-Focused Trips
- Domestic Cultural Weekend Trips
Art Tourism Market segmented by Party Size
- Couples and Dual-Traveler Bookings
- Multi-Person Families and Private Groups
- Solo Independent Consumers
Art Tourism Market by Traveler Age Cohort
- Millennials and Gen-X 28 to 54 Years
- Affluent Boomers and Seniors 55+ Years
- Gen-Z and Young Adult Explorers
Art Tourism Market segmented by Expenditure Tier
- Mid-Scale and Upper-Midscale Experiences
- Luxury, Custom and VIP Tier
- Value and Budget-Conscious Tier
Art Tourism Market segmented by Payment and Financing Method
- Digital Wallets, Credit Cards and Loyalty Redemption
- Buy-Now-Pay-Later and Installment Plans
- Corporate Account and Wire Settlement
Art Tourism Market by Region
- North America
- United States
- Canada
- Latin America
- Brazil
- Mexico
- Argentina
- Chile
- Western Europe
- Germany
- France
- United Kingdom
- Italy
- Spain
- Benelux
- Nordics
- Eastern Europe
- Poland
- Czech Republic
- Romania
- Hungary
- East Asia
- China
- Japan
- South Korea
- South Asia and Pacific
- India
- ASEAN
- Australia and New Zealand
- Middle East and Africa
- GCC Countries
- South Africa
- Türkiye
- Israel
Research Sources and Bibliography
- [1] MCH Group AG. (2026, March 24). MCH Group Strengthens Profitability and Advances Strategic Growth in 2025. MCH Group Media Newsroom.
- [2] McAndrew, C. (2026, March 12). Dealers in The Art Basel and UBS Art Market Report 2026. Art Basel and UBS by Arts Economics.
- [3] Frieze Events Ltd. (2026, October 19). Major Sales and New Discoveries at Frieze London and Frieze Masters 2026. Frieze Official Editorial.
- [4] Tripadvisor Inc. (2026, February 12). Tripadvisor Reports Fourth Quarter and Full Year 2025 Financial Results. Tripadvisor Investor Relations (Viator Segment).
- [5] UK Department for Culture, Media and Sport (DCMS). (2026, April 29). DCMS-Sponsored Museums and Galleries Annual Performance Indicators 2024/25 Headline Release. GOV.UK Official Statistics.
- [6] Wang, Y., & Cao, Y. (2026, May 7). Tourist value co-creation behavior in immersive cultural tourism spaces: a case study of “the longest day in chang’an”. Frontiers in Psychology, 17, 1762355 (PubMed PMID 42183532 and PMCID PMC13192015).
- [7] teamLab Inc. (2026, February 12). Tokyo's teamLab Museums Record Over 4.2 Million Visitors in 2025 as teamLab Borderless Welcomes 1.69 Million and teamLab Planets 2.51 Million. teamLab Official Press.
- [8] Qin, X., & Zhang, Y. (2025, November 6). Impact of rich cultural tourism experience on tourist satisfactions and behavioral intentions toward Ningxia’s cultural heritage: Moderation role of perceived cultural distance. PLOS One, 20(11), e0336220 (PubMed PMID 41196856 and PMCID PMC12591403).
- [9] Ling, H., & Cheng, Z. (2026, May 26). Mapping the olfactory mindscape in museums: a grounded theory investigation into smellscape perception and its impact on cultural tourism experience. Frontiers in Psychology, 17, 1776370 (PubMed PMID 42272712 and PMCID PMC13246330).
- [10] Lin, Y., Chen, M., & Zhou, L. (2025, December 12). Spatial and Temporal Evolution and Driving Factors of Cultural Heritage Tourism Efficiency. Frontiers in Public Health, 13, 1690535 (PubMed PMID 41458448 and PMCID PMC12741962).
- [11] MCH Group AG. (2026, September 17). MCH Group Continues Its Positive Trajectory With Strong Half-Year Results and Further Improves Profitability. MCH Group Media Newsroom.
- [12] Zhang, H., Liu, K., & Wang, S. (2026, May 7). Configurational Analysis of Cultural and Tourism Industry Integration and Regional Economic Resilience. Frontiers in Sports and Active Living, 8, 1792979 (PubMed PMID 42181511 and PMCID PMC13190509).
- [13] McAndrew, C. (2026, March 12). Global Sales in The Art Basel and UBS Art Market Report 2026. Art Basel and UBS by Arts Economics.
- [14] Ministerio de Cultura de Espana. (2026, January 2). State Museums Record More Than 2.8 Million Visitors in 2025. Gobierno de Espana Ministerio de Cultura.
- [15] National Endowment for the Arts (NEA). (2026, October 22). Arts and Cultural Production Satellite Account Research Impact. National Endowment for the Arts (U.S. Government).
- [16] Smithsonian Institution. (2026, January 15). Visitor Stats and Annual Museum Attendance 2025. Smithsonian Institution Newsdesk.
- [17] French Ministry of Culture. (2026, February 18). Poles Internationaux de Production et de Diffusion (PIPD) International Production and Distribution Hubs. Ministere de la Culture (France).
- [18] Culturespaces SAS. (2026, January 20). Temporary and Immersive Exhibitions Network 2025 and 2026. Portail Culturespaces.
- [19] UK Department for Culture, Media and Sport (DCMS). (2026, September 3). Museums and Galleries Monthly Visits Statistical Dataset. GOV.UK Official Statistics.
- [20] Sotheby's. (2025, February 14). The Global Agenda 2025 Museum Openings and Exhibitions. Sotheby's Editorial.
- [21] Istituto Nazionale di Statistica (Istat). (2025, March 14). Tourist Flows Fourth Quarter 2024 and Cultural City Stays. Istat Italy.
- [22] Frieze Events Ltd. (2026, March 4). Frieze Los Angeles 2026 What Sold and Attendance Recap. Frieze Official Editorial.
- [23] Christie's International plc. (2025, December 17). Christie's Announces $6.2B Projected Global Sales in 2025. Christie's Press Centre.
This bibliography is provided for reader reference. The full report contains the complete reference list and detailed citations.
This Report Answers
- How large is the art tourism market in 2026 and 2036?
- Which museum and biennial plus digital art trends support art tourism demand?
- Why do international biennials and art fairs lead art experience demand?
- Why do cultural enthusiasts and leisure tourists lead the traveler type category?
- How do growth rates differ across Japan and Spain versus USA?
- Which notable companies organize art fairs and immersive centers plus cultural tours?
- What cost and customs plus crowding hurdles restrain art tourism market expansion?
- What metrics should hospitality and venue operators evaluate in art tourism?
Table of Content
- Key Takeaways
- Market Size and CAGR
- Top Growth Driver
- Fastest Growing Segment
- Leading Region
- Key Companies
- Emerging Opportunities
- Executive Summary
- Global Market Outlook
- Demand-side Trends
- Supply-side Trends
- Technology Roadmap Analysis
- Analysis and Recommendations
- Analyst Perspective (What is happening? Why now? What should investors know?)
- Key Questions Answered
- How large is the market?
- What is the CAGR?
- What are key trends?
- Which region dominates?
- Who are the leaders?
Read More...
- Market Overview
- Market Coverage / Taxonomy
- Market Definition / Scope / Limitations
- Research Methodology
- Chapter Orientation
- Analytical Lens and Working Hypotheses
- Market Structure, Signals, and Trend Drivers
- Benchmarking and Cross-market Comparability
- Market Sizing, Forecasting, and Opportunity Mapping
- Research Design and Evidence Framework
- Desk Research Programme (Secondary Evidence)
- Expert Input and Fieldwork (Primary Evidence)
- Tooling, Models, and Reference Databases
- Data Engineering and Model Build
- Quality Assurance and Audit Trail
- Market Background
- Market Dynamics (Drivers, Restraints, Opportunity, Trends)
- Scenario Forecast (Optimistic, Likely, Conservative)
- Impact Analysis
- AI Impact
- Sustainability Impact
- Regulatory Impact
- Technology Impact
- Consumer / Buyer Analysis
- Purchase Drivers
- Adoption Barriers
- Buyer Journey
- Opportunity Map Analysis
- Product Life Cycle Analysis
- Supply Chain Analysis
- Investment Feasibility Matrix
- Value Chain Analysis
- PESTLE and Porter's Analysis
- Regulatory Landscape
- Regional Parent Market Outlook
- Production and Consumption Statistics
- Import and Export Statistics
- Global Market Analysis and Forecast, 2021 to 2036
- Historical Market Size Value (USD Billion) Analysis, 2021 to 2025
- Current and Future Market Size Value (USD Billion) Projections, 2026 to 2036
- Y-o-Y Growth Trend Analysis
- Absolute $ Opportunity Analysis
- Global Market Pricing Analysis, 2021 to 2036
- Global Market Analysis and Forecast, By Art Experience, 2021 to 2036
- Introduction / Key Findings
- Historical Market Size Value (USD Billion) Analysis By Art Experience, 2021 to 2025
- Current and Future Market Size Value (USD Billion) Analysis and Forecast By Art Experience, 2026 to 2036
- International Biennials, Art Fairs and Exhibitions
- Fine Art Galleries and Auction House Tours
- Immersive Digital Art Installations
- Street Art Districts and Artist Studio Trails
- Y-o-Y Growth Trend Analysis By Art Experience, 2021 to 2025
- Absolute $ Opportunity Analysis By Art Experience, 2026 to 2036
- Global Market Analysis and Forecast, By Traveler Type, 2021 to 2036
- Introduction / Key Findings
- Historical Market Size Value (USD Billion) Analysis By Traveler Type, 2021 to 2025
- Current and Future Market Size Value (USD Billion) Analysis and Forecast By Traveler Type, 2026 to 2036
- Cultural Enthusiasts and Leisure Tourists
- High-Net-Worth Art Collectors and Curators
- Academic and Student Art Groups
- Y-o-Y Growth Trend Analysis By Traveler Type, 2021 to 2025
- Absolute $ Opportunity Analysis By Traveler Type, 2026 to 2036
- Global Market Analysis and Forecast, By Trip Scope, 2021 to 2036
- Introduction / Key Findings
- Historical Market Size Value (USD Billion) Analysis By Trip Scope, 2021 to 2025
- Current and Future Market Size Value (USD Billion) Analysis and Forecast By Trip Scope, 2026 to 2036
- International Art-Focused Trips
- Domestic Cultural Weekend Trips
- Y-o-Y Growth Trend Analysis By Trip Scope, 2021 to 2025
- Absolute $ Opportunity Analysis By Trip Scope, 2026 to 2036
- Global Market Analysis and Forecast, By Party Size, 2021 to 2036
- Introduction / Key Findings
- Historical Market Size Value (USD Billion) Analysis By Party Size, 2021 to 2025
- Current and Future Market Size Value (USD Billion) Analysis and Forecast By Party Size, 2026 to 2036
- Couples and Dual-Traveler Bookings
- Multi-Person Families and Private Groups
- Solo Independent Consumers
- Y-o-Y Growth Trend Analysis By Party Size, 2021 to 2025
- Absolute $ Opportunity Analysis By Party Size, 2026 to 2036
- Global Market Analysis and Forecast, By Art Tourism Market by Traveler Age Cohort, 2021 to 2036
- Introduction / Key Findings
- Historical Market Size Value (USD Billion) Analysis By Art Tourism Market by Traveler Age Cohort, 2021 to 2025
- Current and Future Market Size Value (USD Billion) Analysis and Forecast By Art Tourism Market by Traveler Age Cohort, 2026 to 2036
- Millennials and Gen-X 28 to 54 Years
- Affluent Boomers and Seniors 55+ Years
- Gen-Z and Young Adult Explorers
- Y-o-Y Growth Trend Analysis By Art Tourism Market by Traveler Age Cohort, 2021 to 2025
- Absolute $ Opportunity Analysis By Art Tourism Market by Traveler Age Cohort, 2026 to 2036
- Global Market Analysis and Forecast, By Expenditure Tier, 2021 to 2036
- Introduction / Key Findings
- Historical Market Size Value (USD Billion) Analysis By Expenditure Tier, 2021 to 2025
- Current and Future Market Size Value (USD Billion) Analysis and Forecast By Expenditure Tier, 2026 to 2036
- Mid-Scale and Upper-Midscale Experiences
- Luxury, Custom and VIP Tier
- Value and Budget-Conscious Tier
- Y-o-Y Growth Trend Analysis By Expenditure Tier, 2021 to 2025
- Absolute $ Opportunity Analysis By Expenditure Tier, 2026 to 2036
- Global Market Analysis and Forecast, By Payment and Financing Method, 2021 to 2036
- Introduction / Key Findings
- Historical Market Size Value (USD Billion) Analysis By Payment and Financing Method, 2021 to 2025
- Current and Future Market Size Value (USD Billion) Analysis and Forecast By Payment and Financing Method, 2026 to 2036
- Digital Wallets, Credit Cards and Loyalty Redemption
- Buy-Now-Pay-Later and Installment Plans
- Corporate Account and Wire Settlement
- Y-o-Y Growth Trend Analysis By Payment and Financing Method, 2021 to 2025
- Absolute $ Opportunity Analysis By Payment and Financing Method, 2026 to 2036
- Global Market Analysis and Forecast, By Region, 2021 to 2036
- Introduction
- Historical Market Size Value (USD Billion) Analysis By Region, 2021 to 2025
- Current Market Size Value (USD Billion) Analysis and Forecast By Region, 2026 to 2036
- North America
- Latin America
- Western Europe
- Eastern Europe
- East Asia
- South Asia and Pacific
- Middle East and Africa
- Market Attractiveness Analysis By Region
- North America Market Analysis and Forecast, By Country, 2021 to 2036
- Historical Market Size Value (USD Billion) Trend Analysis By Market Taxonomy, 2021 to 2025
- Market Size Value (USD Billion) Forecast By Market Taxonomy, 2026 to 2036
- By Country
- United States
- Canada
- By Art Experience
- By Traveler Type
- By Trip Scope
- By Party Size
- By Art Tourism Market by Traveler Age Cohort
- By Expenditure Tier
- By Payment and Financing Method
- By Country
- Market Attractiveness Analysis
- By Country
- By Art Experience
- By Traveler Type
- By Trip Scope
- By Party Size
- By Art Tourism Market by Traveler Age Cohort
- By Expenditure Tier
- By Payment and Financing Method
- Key Takeaways
- Latin America Market Analysis and Forecast, By Country
- Historical Market Size Value (USD Billion) Trend Analysis By Market Taxonomy, 2021 to 2025
- Market Size Value (USD Billion) Forecast By Market Taxonomy, 2026 to 2036
- By Country
- Brazil
- Mexico
- Argentina
- Chile
- By Art Experience
- By Traveler Type
- By Trip Scope
- By Party Size
- By Art Tourism Market by Traveler Age Cohort
- By Expenditure Tier
- By Payment and Financing Method
- By Country
- Market Attractiveness Analysis
- By Country
- By Art Experience
- By Traveler Type
- By Trip Scope
- By Party Size
- By Art Tourism Market by Traveler Age Cohort
- By Expenditure Tier
- By Payment and Financing Method
- Key Takeaways
- Western Europe Market Analysis and Forecast, By Country
- Historical Market Size Value (USD Billion) Trend Analysis By Market Taxonomy, 2021 to 2025
- Market Size Value (USD Billion) Forecast By Market Taxonomy, 2026 to 2036
- By Country
- Germany
- France
- United Kingdom
- Italy
- Spain
- Benelux
- Nordics
- By Art Experience
- By Traveler Type
- By Trip Scope
- By Party Size
- By Art Tourism Market by Traveler Age Cohort
- By Expenditure Tier
- By Payment and Financing Method
- By Country
- Market Attractiveness Analysis
- By Country
- By Art Experience
- By Traveler Type
- By Trip Scope
- By Party Size
- By Art Tourism Market by Traveler Age Cohort
- By Expenditure Tier
- By Payment and Financing Method
- Key Takeaways
- Eastern Europe Market Analysis and Forecast, By Country
- Historical Market Size Value (USD Billion) Trend Analysis By Market Taxonomy, 2021 to 2025
- Market Size Value (USD Billion) Forecast By Market Taxonomy, 2026 to 2036
- By Country
- Poland
- Czech Republic
- Romania
- Hungary
- By Art Experience
- By Traveler Type
- By Trip Scope
- By Party Size
- By Art Tourism Market by Traveler Age Cohort
- By Expenditure Tier
- By Payment and Financing Method
- By Country
- Market Attractiveness Analysis
- By Country
- By Art Experience
- By Traveler Type
- By Trip Scope
- By Party Size
- By Art Tourism Market by Traveler Age Cohort
- By Expenditure Tier
- By Payment and Financing Method
- Key Takeaways
- East Asia Market Analysis and Forecast, By Country
- Historical Market Size Value (USD Billion) Trend Analysis By Market Taxonomy, 2021 to 2025
- Market Size Value (USD Billion) Forecast By Market Taxonomy, 2026 to 2036
- By Country
- China
- Japan
- South Korea
- By Art Experience
- By Traveler Type
- By Trip Scope
- By Party Size
- By Art Tourism Market by Traveler Age Cohort
- By Expenditure Tier
- By Payment and Financing Method
- By Country
- Market Attractiveness Analysis
- By Country
- By Art Experience
- By Traveler Type
- By Trip Scope
- By Party Size
- By Art Tourism Market by Traveler Age Cohort
- By Expenditure Tier
- By Payment and Financing Method
- Key Takeaways
- South Asia and Pacific Market Analysis and Forecast, By Country
- Historical Market Size Value (USD Billion) Trend Analysis By Market Taxonomy, 2021 to 2025
- Market Size Value (USD Billion) Forecast By Market Taxonomy, 2026 to 2036
- By Country
- India
- ASEAN
- Australia and New Zealand
- By Art Experience
- By Traveler Type
- By Trip Scope
- By Party Size
- By Art Tourism Market by Traveler Age Cohort
- By Expenditure Tier
- By Payment and Financing Method
- By Country
- Market Attractiveness Analysis
- By Country
- By Art Experience
- By Traveler Type
- By Trip Scope
- By Party Size
- By Art Tourism Market by Traveler Age Cohort
- By Expenditure Tier
- By Payment and Financing Method
- Key Takeaways
- Middle East and Africa Market Analysis and Forecast, By Country
- Historical Market Size Value (USD Billion) Trend Analysis By Market Taxonomy, 2021 to 2025
- Market Size Value (USD Billion) Forecast By Market Taxonomy, 2026 to 2036
- By Country
- GCC Countries
- South Africa
- Türkiye
- Israel
- By Art Experience
- By Traveler Type
- By Trip Scope
- By Party Size
- By Art Tourism Market by Traveler Age Cohort
- By Expenditure Tier
- By Payment and Financing Method
- By Country
- Market Attractiveness Analysis
- By Country
- By Art Experience
- By Traveler Type
- By Trip Scope
- By Party Size
- By Art Tourism Market by Traveler Age Cohort
- By Expenditure Tier
- By Payment and Financing Method
- Key Takeaways
- Key Countries Market Analysis
- United States
- Pricing Analysis
- Market Share Analysis, 2025
- By Art Experience
- By Traveler Type
- By Trip Scope
- By Party Size
- By Art Tourism Market by Traveler Age Cohort
- By Expenditure Tier
- By Payment and Financing Method
- Canada
- Pricing Analysis
- Market Share Analysis, 2025
- By Art Experience
- By Traveler Type
- By Trip Scope
- By Party Size
- By Art Tourism Market by Traveler Age Cohort
- By Expenditure Tier
- By Payment and Financing Method
- Mexico
- Pricing Analysis
- Market Share Analysis, 2025
- By Art Experience
- By Traveler Type
- By Trip Scope
- By Party Size
- By Art Tourism Market by Traveler Age Cohort
- By Expenditure Tier
- By Payment and Financing Method
- Brazil
- Pricing Analysis
- Market Share Analysis, 2025
- By Art Experience
- By Traveler Type
- By Trip Scope
- By Party Size
- By Art Tourism Market by Traveler Age Cohort
- By Expenditure Tier
- By Payment and Financing Method
- Chile
- Pricing Analysis
- Market Share Analysis, 2025
- By Art Experience
- By Traveler Type
- By Trip Scope
- By Party Size
- By Art Tourism Market by Traveler Age Cohort
- By Expenditure Tier
- By Payment and Financing Method
- Germany
- Pricing Analysis
- Market Share Analysis, 2025
- By Art Experience
- By Traveler Type
- By Trip Scope
- By Party Size
- By Art Tourism Market by Traveler Age Cohort
- By Expenditure Tier
- By Payment and Financing Method
- United Kingdom
- Pricing Analysis
- Market Share Analysis, 2025
- By Art Experience
- By Traveler Type
- By Trip Scope
- By Party Size
- By Art Tourism Market by Traveler Age Cohort
- By Expenditure Tier
- By Payment and Financing Method
- Italy
- Pricing Analysis
- Market Share Analysis, 2025
- By Art Experience
- By Traveler Type
- By Trip Scope
- By Party Size
- By Art Tourism Market by Traveler Age Cohort
- By Expenditure Tier
- By Payment and Financing Method
- Spain
- Pricing Analysis
- Market Share Analysis, 2025
- By Art Experience
- By Traveler Type
- By Trip Scope
- By Party Size
- By Art Tourism Market by Traveler Age Cohort
- By Expenditure Tier
- By Payment and Financing Method
- France
- Pricing Analysis
- Market Share Analysis, 2025
- By Art Experience
- By Traveler Type
- By Trip Scope
- By Party Size
- By Art Tourism Market by Traveler Age Cohort
- By Expenditure Tier
- By Payment and Financing Method
- India
- Pricing Analysis
- Market Share Analysis, 2025
- By Art Experience
- By Traveler Type
- By Trip Scope
- By Party Size
- By Art Tourism Market by Traveler Age Cohort
- By Expenditure Tier
- By Payment and Financing Method
- ASEAN
- Pricing Analysis
- Market Share Analysis, 2025
- By Art Experience
- By Traveler Type
- By Trip Scope
- By Party Size
- By Art Tourism Market by Traveler Age Cohort
- By Expenditure Tier
- By Payment and Financing Method
- Australia and New Zealand
- Pricing Analysis
- Market Share Analysis, 2025
- By Art Experience
- By Traveler Type
- By Trip Scope
- By Party Size
- By Art Tourism Market by Traveler Age Cohort
- By Expenditure Tier
- By Payment and Financing Method
- China
- Pricing Analysis
- Market Share Analysis, 2025
- By Art Experience
- By Traveler Type
- By Trip Scope
- By Party Size
- By Art Tourism Market by Traveler Age Cohort
- By Expenditure Tier
- By Payment and Financing Method
- Japan
- Pricing Analysis
- Market Share Analysis, 2025
- By Art Experience
- By Traveler Type
- By Trip Scope
- By Party Size
- By Art Tourism Market by Traveler Age Cohort
- By Expenditure Tier
- By Payment and Financing Method
- South Korea
- Pricing Analysis
- Market Share Analysis, 2025
- By Art Experience
- By Traveler Type
- By Trip Scope
- By Party Size
- By Art Tourism Market by Traveler Age Cohort
- By Expenditure Tier
- By Payment and Financing Method
- Poland
- Pricing Analysis
- Market Share Analysis, 2025
- By Art Experience
- By Traveler Type
- By Trip Scope
- By Party Size
- By Art Tourism Market by Traveler Age Cohort
- By Expenditure Tier
- By Payment and Financing Method
- Hungary
- Pricing Analysis
- Market Share Analysis, 2025
- By Art Experience
- By Traveler Type
- By Trip Scope
- By Party Size
- By Art Tourism Market by Traveler Age Cohort
- By Expenditure Tier
- By Payment and Financing Method
- Türkiye
- Pricing Analysis
- Market Share Analysis, 2025
- By Art Experience
- By Traveler Type
- By Trip Scope
- By Party Size
- By Art Tourism Market by Traveler Age Cohort
- By Expenditure Tier
- By Payment and Financing Method
- South Africa
- Pricing Analysis
- Market Share Analysis, 2025
- By Art Experience
- By Traveler Type
- By Trip Scope
- By Party Size
- By Art Tourism Market by Traveler Age Cohort
- By Expenditure Tier
- By Payment and Financing Method
- United States
- Market Structure Analysis
- Competition Dashboard
- Competition Benchmarking
- Market Share Analysis of Top Players
- By Regional
- By Art Experience
- By Traveler Type
- By Trip Scope
- By Party Size
- By Art Tourism Market by Traveler Age Cohort
- By Expenditure Tier
- By Payment and Financing Method
- Emerging Startups
- Innovation Benchmarking
- Competition Analysis
- Competition Deep Dive
- MCH Group AG Art Basel
- Overview
- Product Portfolio
- Profitability by Market Segments
- Sales Footprint
- Strategy Overview
- Marketing Strategy
- Product Strategy
- Channel Strategy
- Frieze Events Ltd.
- TeamLab Inc.
- Culturespaces SAS
- Christie's International plc
- Sotheby's
- Viator Inc.
- Meow Wolf Inc.
- MCH Group AG Art Basel
- Case Studies
- Success Stories
- Recent Developments
- Competition Deep Dive
- Assumptions & Acronyms Used
List of Tables
- Table 1: Global Market Value (USD Billion) Forecast by Region, 2021 to 2036
- Table 2: Global Market Value (USD Billion) Forecast by Art Experience, 2021 to 2036
- Table 3: Global Market Value (USD Billion) Forecast by Traveler Type, 2021 to 2036
- Table 4: Global Market Value (USD Billion) Forecast by Trip Scope, 2021 to 2036
- Table 5: Global Market Value (USD Billion) Forecast by Party Size, 2021 to 2036
- Table 6: Global Market Value (USD Billion) Forecast by Art Tourism Market by Traveler Age Cohort, 2021 to 2036
- Table 7: Global Market Value (USD Billion) Forecast by Expenditure Tier, 2021 to 2036
- Table 8: Global Market Value (USD Billion) Forecast by Payment and Financing Method, 2021 to 2036
- Table 9: North America Market Value (USD Billion) Forecast by Country, 2021 to 2036
- Table 10: North America Market Value (USD Billion) Forecast by Art Experience, 2021 to 2036
- Table 11: North America Market Value (USD Billion) Forecast by Traveler Type, 2021 to 2036
- Table 12: North America Market Value (USD Billion) Forecast by Trip Scope, 2021 to 2036
- Table 13: North America Market Value (USD Billion) Forecast by Party Size, 2021 to 2036
- Table 14: North America Market Value (USD Billion) Forecast by Art Tourism Market by Traveler Age Cohort, 2021 to 2036
- Table 15: North America Market Value (USD Billion) Forecast by Expenditure Tier, 2021 to 2036
- Table 16: North America Market Value (USD Billion) Forecast by Payment and Financing Method, 2021 to 2036
- Table 17: Latin America Market Value (USD Billion) Forecast by Country, 2021 to 2036
- Table 18: Latin America Market Value (USD Billion) Forecast by Art Experience, 2021 to 2036
- Table 19: Latin America Market Value (USD Billion) Forecast by Traveler Type, 2021 to 2036
- Table 20: Latin America Market Value (USD Billion) Forecast by Trip Scope, 2021 to 2036
- Table 21: Latin America Market Value (USD Billion) Forecast by Party Size, 2021 to 2036
- Table 22: Latin America Market Value (USD Billion) Forecast by Art Tourism Market by Traveler Age Cohort, 2021 to 2036
- Table 23: Latin America Market Value (USD Billion) Forecast by Expenditure Tier, 2021 to 2036
- Table 24: Latin America Market Value (USD Billion) Forecast by Payment and Financing Method, 2021 to 2036
- Table 25: Western Europe Market Value (USD Billion) Forecast by Country, 2021 to 2036
- Table 26: Western Europe Market Value (USD Billion) Forecast by Art Experience, 2021 to 2036
- Table 27: Western Europe Market Value (USD Billion) Forecast by Traveler Type, 2021 to 2036
- Table 28: Western Europe Market Value (USD Billion) Forecast by Trip Scope, 2021 to 2036
- Table 29: Western Europe Market Value (USD Billion) Forecast by Party Size, 2021 to 2036
- Table 30: Western Europe Market Value (USD Billion) Forecast by Art Tourism Market by Traveler Age Cohort, 2021 to 2036
- Table 31: Western Europe Market Value (USD Billion) Forecast by Expenditure Tier, 2021 to 2036
- Table 32: Western Europe Market Value (USD Billion) Forecast by Payment and Financing Method, 2021 to 2036
- Table 33: Eastern Europe Market Value (USD Billion) Forecast by Country, 2021 to 2036
- Table 34: Eastern Europe Market Value (USD Billion) Forecast by Art Experience, 2021 to 2036
- Table 35: Eastern Europe Market Value (USD Billion) Forecast by Traveler Type, 2021 to 2036
- Table 36: Eastern Europe Market Value (USD Billion) Forecast by Trip Scope, 2021 to 2036
- Table 37: Eastern Europe Market Value (USD Billion) Forecast by Party Size, 2021 to 2036
- Table 38: Eastern Europe Market Value (USD Billion) Forecast by Art Tourism Market by Traveler Age Cohort, 2021 to 2036
- Table 39: Eastern Europe Market Value (USD Billion) Forecast by Expenditure Tier, 2021 to 2036
- Table 40: Eastern Europe Market Value (USD Billion) Forecast by Payment and Financing Method, 2021 to 2036
- Table 41: East Asia Market Value (USD Billion) Forecast by Country, 2021 to 2036
- Table 42: East Asia Market Value (USD Billion) Forecast by Art Experience, 2021 to 2036
- Table 43: East Asia Market Value (USD Billion) Forecast by Traveler Type, 2021 to 2036
- Table 44: East Asia Market Value (USD Billion) Forecast by Trip Scope, 2021 to 2036
- Table 45: East Asia Market Value (USD Billion) Forecast by Party Size, 2021 to 2036
- Table 46: East Asia Market Value (USD Billion) Forecast by Art Tourism Market by Traveler Age Cohort, 2021 to 2036
- Table 47: East Asia Market Value (USD Billion) Forecast by Expenditure Tier, 2021 to 2036
- Table 48: East Asia Market Value (USD Billion) Forecast by Payment and Financing Method, 2021 to 2036
- Table 49: South Asia and Pacific Market Value (USD Billion) Forecast by Country, 2021 to 2036
- Table 50: South Asia and Pacific Market Value (USD Billion) Forecast by Art Experience, 2021 to 2036
- Table 51: South Asia and Pacific Market Value (USD Billion) Forecast by Traveler Type, 2021 to 2036
- Table 52: South Asia and Pacific Market Value (USD Billion) Forecast by Trip Scope, 2021 to 2036
- Table 53: South Asia and Pacific Market Value (USD Billion) Forecast by Party Size, 2021 to 2036
- Table 54: South Asia and Pacific Market Value (USD Billion) Forecast by Art Tourism Market by Traveler Age Cohort, 2021 to 2036
- Table 55: South Asia and Pacific Market Value (USD Billion) Forecast by Expenditure Tier, 2021 to 2036
- Table 56: South Asia and Pacific Market Value (USD Billion) Forecast by Payment and Financing Method, 2021 to 2036
- Table 57: Middle East and Africa Market Value (USD Billion) Forecast by Country, 2021 to 2036
- Table 58: Middle East and Africa Market Value (USD Billion) Forecast by Art Experience, 2021 to 2036
- Table 59: Middle East and Africa Market Value (USD Billion) Forecast by Traveler Type, 2021 to 2036
- Table 60: Middle East and Africa Market Value (USD Billion) Forecast by Trip Scope, 2021 to 2036
- Table 61: Middle East and Africa Market Value (USD Billion) Forecast by Party Size, 2021 to 2036
- Table 62: Middle East and Africa Market Value (USD Billion) Forecast by Art Tourism Market by Traveler Age Cohort, 2021 to 2036
- Table 63: Middle East and Africa Market Value (USD Billion) Forecast by Expenditure Tier, 2021 to 2036
- Table 64: Middle East and Africa Market Value (USD Billion) Forecast by Payment and Financing Method, 2021 to 2036
List of Figures
- Figure 1: Global Market Pricing Analysis
- Figure 2: Global Market Value (USD Billion) Forecast 2021-2036
- Figure 3: Global Market Value Share and BPS Analysis by Art Experience, 2026 and 2036
- Figure 4: Global Market Y-o-Y Growth Comparison by Art Experience, 2026-2036
- Figure 5: Global Market Attractiveness Analysis by Art Experience
- Figure 6: Global Market Value Share and BPS Analysis by Traveler Type, 2026 and 2036
- Figure 7: Global Market Y-o-Y Growth Comparison by Traveler Type, 2026-2036
- Figure 8: Global Market Attractiveness Analysis by Traveler Type
- Figure 9: Global Market Value Share and BPS Analysis by Trip Scope, 2026 and 2036
- Figure 10: Global Market Y-o-Y Growth Comparison by Trip Scope, 2026-2036
- Figure 11: Global Market Attractiveness Analysis by Trip Scope
- Figure 12: Global Market Value Share and BPS Analysis by Party Size, 2026 and 2036
- Figure 13: Global Market Y-o-Y Growth Comparison by Party Size, 2026-2036
- Figure 14: Global Market Attractiveness Analysis by Party Size
- Figure 15: Global Market Value Share and BPS Analysis by Art Tourism Market by Traveler Age Cohort, 2026 and 2036
- Figure 16: Global Market Y-o-Y Growth Comparison by Art Tourism Market by Traveler Age Cohort, 2026-2036
- Figure 17: Global Market Attractiveness Analysis by Art Tourism Market by Traveler Age Cohort
- Figure 18: Global Market Value Share and BPS Analysis by Expenditure Tier, 2026 and 2036
- Figure 19: Global Market Y-o-Y Growth Comparison by Expenditure Tier, 2026-2036
- Figure 20: Global Market Attractiveness Analysis by Expenditure Tier
- Figure 21: Global Market Value Share and BPS Analysis by Payment and Financing Method, 2026 and 2036
- Figure 22: Global Market Y-o-Y Growth Comparison by Payment and Financing Method, 2026-2036
- Figure 23: Global Market Attractiveness Analysis by Payment and Financing Method
- Figure 24: Global Market Value (USD Billion) Share and BPS Analysis by Region, 2026 and 2036
- Figure 25: Global Market Y-o-Y Growth Comparison by Region, 2026-2036
- Figure 26: Global Market Attractiveness Analysis by Region
- Figure 27: North America Market Incremental Dollar Opportunity, 2026-2036
- Figure 28: Latin America Market Incremental Dollar Opportunity, 2026-2036
- Figure 29: Western Europe Market Incremental Dollar Opportunity, 2026-2036
- Figure 30: Eastern Europe Market Incremental Dollar Opportunity, 2026-2036
- Figure 31: East Asia Market Incremental Dollar Opportunity, 2026-2036
- Figure 32: South Asia and Pacific Market Incremental Dollar Opportunity, 2026-2036
- Figure 33: Middle East and Africa Market Incremental Dollar Opportunity, 2026-2036
- Figure 34: North America Market Value Share and BPS Analysis by Country, 2026 and 2036
- Figure 35: North America Market Value Share and BPS Analysis by Art Experience, 2026 and 2036
- Figure 36: North America Market Y-o-Y Growth Comparison by Art Experience, 2026-2036
- Figure 37: North America Market Attractiveness Analysis by Art Experience
- Figure 38: North America Market Value Share and BPS Analysis by Traveler Type, 2026 and 2036
- Figure 39: North America Market Y-o-Y Growth Comparison by Traveler Type, 2026-2036
- Figure 40: North America Market Attractiveness Analysis by Traveler Type
- Figure 41: North America Market Value Share and BPS Analysis by Trip Scope, 2026 and 2036
- Figure 42: North America Market Y-o-Y Growth Comparison by Trip Scope, 2026-2036
- Figure 43: North America Market Attractiveness Analysis by Trip Scope
- Figure 44: North America Market Value Share and BPS Analysis by Party Size, 2026 and 2036
- Figure 45: North America Market Y-o-Y Growth Comparison by Party Size, 2026-2036
- Figure 46: North America Market Attractiveness Analysis by Party Size
- Figure 47: North America Market Value Share and BPS Analysis by Art Tourism Market by Traveler Age Cohort, 2026 and 2036
- Figure 48: North America Market Y-o-Y Growth Comparison by Art Tourism Market by Traveler Age Cohort, 2026-2036
- Figure 49: North America Market Attractiveness Analysis by Art Tourism Market by Traveler Age Cohort
- Figure 50: North America Market Value Share and BPS Analysis by Expenditure Tier, 2026 and 2036
- Figure 51: North America Market Y-o-Y Growth Comparison by Expenditure Tier, 2026-2036
- Figure 52: North America Market Attractiveness Analysis by Expenditure Tier
- Figure 53: North America Market Value Share and BPS Analysis by Payment and Financing Method, 2026 and 2036
- Figure 54: North America Market Y-o-Y Growth Comparison by Payment and Financing Method, 2026-2036
- Figure 55: North America Market Attractiveness Analysis by Payment and Financing Method
- Figure 56: Latin America Market Value Share and BPS Analysis by Country, 2026 and 2036
- Figure 57: Latin America Market Value Share and BPS Analysis by Art Experience, 2026 and 2036
- Figure 58: Latin America Market Y-o-Y Growth Comparison by Art Experience, 2026-2036
- Figure 59: Latin America Market Attractiveness Analysis by Art Experience
- Figure 60: Latin America Market Value Share and BPS Analysis by Traveler Type, 2026 and 2036
- Figure 61: Latin America Market Y-o-Y Growth Comparison by Traveler Type, 2026-2036
- Figure 62: Latin America Market Attractiveness Analysis by Traveler Type
- Figure 63: Latin America Market Value Share and BPS Analysis by Trip Scope, 2026 and 2036
- Figure 64: Latin America Market Y-o-Y Growth Comparison by Trip Scope, 2026-2036
- Figure 65: Latin America Market Attractiveness Analysis by Trip Scope
- Figure 66: Latin America Market Value Share and BPS Analysis by Party Size, 2026 and 2036
- Figure 67: Latin America Market Y-o-Y Growth Comparison by Party Size, 2026-2036
- Figure 68: Latin America Market Attractiveness Analysis by Party Size
- Figure 69: Latin America Market Value Share and BPS Analysis by Art Tourism Market by Traveler Age Cohort, 2026 and 2036
- Figure 70: Latin America Market Y-o-Y Growth Comparison by Art Tourism Market by Traveler Age Cohort, 2026-2036
- Figure 71: Latin America Market Attractiveness Analysis by Art Tourism Market by Traveler Age Cohort
- Figure 72: Latin America Market Value Share and BPS Analysis by Expenditure Tier, 2026 and 2036
- Figure 73: Latin America Market Y-o-Y Growth Comparison by Expenditure Tier, 2026-2036
- Figure 74: Latin America Market Attractiveness Analysis by Expenditure Tier
- Figure 75: Latin America Market Value Share and BPS Analysis by Payment and Financing Method, 2026 and 2036
- Figure 76: Latin America Market Y-o-Y Growth Comparison by Payment and Financing Method, 2026-2036
- Figure 77: Latin America Market Attractiveness Analysis by Payment and Financing Method
- Figure 78: Western Europe Market Value Share and BPS Analysis by Country, 2026 and 2036
- Figure 79: Western Europe Market Value Share and BPS Analysis by Art Experience, 2026 and 2036
- Figure 80: Western Europe Market Y-o-Y Growth Comparison by Art Experience, 2026-2036
- Figure 81: Western Europe Market Attractiveness Analysis by Art Experience
- Figure 82: Western Europe Market Value Share and BPS Analysis by Traveler Type, 2026 and 2036
- Figure 83: Western Europe Market Y-o-Y Growth Comparison by Traveler Type, 2026-2036
- Figure 84: Western Europe Market Attractiveness Analysis by Traveler Type
- Figure 85: Western Europe Market Value Share and BPS Analysis by Trip Scope, 2026 and 2036
- Figure 86: Western Europe Market Y-o-Y Growth Comparison by Trip Scope, 2026-2036
- Figure 87: Western Europe Market Attractiveness Analysis by Trip Scope
- Figure 88: Western Europe Market Value Share and BPS Analysis by Party Size, 2026 and 2036
- Figure 89: Western Europe Market Y-o-Y Growth Comparison by Party Size, 2026-2036
- Figure 90: Western Europe Market Attractiveness Analysis by Party Size
- Figure 91: Western Europe Market Value Share and BPS Analysis by Art Tourism Market by Traveler Age Cohort, 2026 and 2036
- Figure 92: Western Europe Market Y-o-Y Growth Comparison by Art Tourism Market by Traveler Age Cohort, 2026-2036
- Figure 93: Western Europe Market Attractiveness Analysis by Art Tourism Market by Traveler Age Cohort
- Figure 94: Western Europe Market Value Share and BPS Analysis by Expenditure Tier, 2026 and 2036
- Figure 95: Western Europe Market Y-o-Y Growth Comparison by Expenditure Tier, 2026-2036
- Figure 96: Western Europe Market Attractiveness Analysis by Expenditure Tier
- Figure 97: Western Europe Market Value Share and BPS Analysis by Payment and Financing Method, 2026 and 2036
- Figure 98: Western Europe Market Y-o-Y Growth Comparison by Payment and Financing Method, 2026-2036
- Figure 99: Western Europe Market Attractiveness Analysis by Payment and Financing Method
- Figure 100: Eastern Europe Market Value Share and BPS Analysis by Country, 2026 and 2036
- Figure 101: Eastern Europe Market Value Share and BPS Analysis by Art Experience, 2026 and 2036
- Figure 102: Eastern Europe Market Y-o-Y Growth Comparison by Art Experience, 2026-2036
- Figure 103: Eastern Europe Market Attractiveness Analysis by Art Experience
- Figure 104: Eastern Europe Market Value Share and BPS Analysis by Traveler Type, 2026 and 2036
- Figure 105: Eastern Europe Market Y-o-Y Growth Comparison by Traveler Type, 2026-2036
- Figure 106: Eastern Europe Market Attractiveness Analysis by Traveler Type
- Figure 107: Eastern Europe Market Value Share and BPS Analysis by Trip Scope, 2026 and 2036
- Figure 108: Eastern Europe Market Y-o-Y Growth Comparison by Trip Scope, 2026-2036
- Figure 109: Eastern Europe Market Attractiveness Analysis by Trip Scope
- Figure 110: Eastern Europe Market Value Share and BPS Analysis by Party Size, 2026 and 2036
- Figure 111: Eastern Europe Market Y-o-Y Growth Comparison by Party Size, 2026-2036
- Figure 112: Eastern Europe Market Attractiveness Analysis by Party Size
- Figure 113: Eastern Europe Market Value Share and BPS Analysis by Art Tourism Market by Traveler Age Cohort, 2026 and 2036
- Figure 114: Eastern Europe Market Y-o-Y Growth Comparison by Art Tourism Market by Traveler Age Cohort, 2026-2036
- Figure 115: Eastern Europe Market Attractiveness Analysis by Art Tourism Market by Traveler Age Cohort
- Figure 116: Eastern Europe Market Value Share and BPS Analysis by Expenditure Tier, 2026 and 2036
- Figure 117: Eastern Europe Market Y-o-Y Growth Comparison by Expenditure Tier, 2026-2036
- Figure 118: Eastern Europe Market Attractiveness Analysis by Expenditure Tier
- Figure 119: Eastern Europe Market Value Share and BPS Analysis by Payment and Financing Method, 2026 and 2036
- Figure 120: Eastern Europe Market Y-o-Y Growth Comparison by Payment and Financing Method, 2026-2036
- Figure 121: Eastern Europe Market Attractiveness Analysis by Payment and Financing Method
- Figure 122: East Asia Market Value Share and BPS Analysis by Country, 2026 and 2036
- Figure 123: East Asia Market Value Share and BPS Analysis by Art Experience, 2026 and 2036
- Figure 124: East Asia Market Y-o-Y Growth Comparison by Art Experience, 2026-2036
- Figure 125: East Asia Market Attractiveness Analysis by Art Experience
- Figure 126: East Asia Market Value Share and BPS Analysis by Traveler Type, 2026 and 2036
- Figure 127: East Asia Market Y-o-Y Growth Comparison by Traveler Type, 2026-2036
- Figure 128: East Asia Market Attractiveness Analysis by Traveler Type
- Figure 129: East Asia Market Value Share and BPS Analysis by Trip Scope, 2026 and 2036
- Figure 130: East Asia Market Y-o-Y Growth Comparison by Trip Scope, 2026-2036
- Figure 131: East Asia Market Attractiveness Analysis by Trip Scope
- Figure 132: East Asia Market Value Share and BPS Analysis by Party Size, 2026 and 2036
- Figure 133: East Asia Market Y-o-Y Growth Comparison by Party Size, 2026-2036
- Figure 134: East Asia Market Attractiveness Analysis by Party Size
- Figure 135: East Asia Market Value Share and BPS Analysis by Art Tourism Market by Traveler Age Cohort, 2026 and 2036
- Figure 136: East Asia Market Y-o-Y Growth Comparison by Art Tourism Market by Traveler Age Cohort, 2026-2036
- Figure 137: East Asia Market Attractiveness Analysis by Art Tourism Market by Traveler Age Cohort
- Figure 138: East Asia Market Value Share and BPS Analysis by Expenditure Tier, 2026 and 2036
- Figure 139: East Asia Market Y-o-Y Growth Comparison by Expenditure Tier, 2026-2036
- Figure 140: East Asia Market Attractiveness Analysis by Expenditure Tier
- Figure 141: East Asia Market Value Share and BPS Analysis by Payment and Financing Method, 2026 and 2036
- Figure 142: East Asia Market Y-o-Y Growth Comparison by Payment and Financing Method, 2026-2036
- Figure 143: East Asia Market Attractiveness Analysis by Payment and Financing Method
- Figure 144: South Asia and Pacific Market Value Share and BPS Analysis by Country, 2026 and 2036
- Figure 145: South Asia and Pacific Market Value Share and BPS Analysis by Art Experience, 2026 and 2036
- Figure 146: South Asia and Pacific Market Y-o-Y Growth Comparison by Art Experience, 2026-2036
- Figure 147: South Asia and Pacific Market Attractiveness Analysis by Art Experience
- Figure 148: South Asia and Pacific Market Value Share and BPS Analysis by Traveler Type, 2026 and 2036
- Figure 149: South Asia and Pacific Market Y-o-Y Growth Comparison by Traveler Type, 2026-2036
- Figure 150: South Asia and Pacific Market Attractiveness Analysis by Traveler Type
- Figure 151: South Asia and Pacific Market Value Share and BPS Analysis by Trip Scope, 2026 and 2036
- Figure 152: South Asia and Pacific Market Y-o-Y Growth Comparison by Trip Scope, 2026-2036
- Figure 153: South Asia and Pacific Market Attractiveness Analysis by Trip Scope
- Figure 154: South Asia and Pacific Market Value Share and BPS Analysis by Party Size, 2026 and 2036
- Figure 155: South Asia and Pacific Market Y-o-Y Growth Comparison by Party Size, 2026-2036
- Figure 156: South Asia and Pacific Market Attractiveness Analysis by Party Size
- Figure 157: South Asia and Pacific Market Value Share and BPS Analysis by Art Tourism Market by Traveler Age Cohort, 2026 and 2036
- Figure 158: South Asia and Pacific Market Y-o-Y Growth Comparison by Art Tourism Market by Traveler Age Cohort, 2026-2036
- Figure 159: South Asia and Pacific Market Attractiveness Analysis by Art Tourism Market by Traveler Age Cohort
- Figure 160: South Asia and Pacific Market Value Share and BPS Analysis by Expenditure Tier, 2026 and 2036
- Figure 161: South Asia and Pacific Market Y-o-Y Growth Comparison by Expenditure Tier, 2026-2036
- Figure 162: South Asia and Pacific Market Attractiveness Analysis by Expenditure Tier
- Figure 163: South Asia and Pacific Market Value Share and BPS Analysis by Payment and Financing Method, 2026 and 2036
- Figure 164: South Asia and Pacific Market Y-o-Y Growth Comparison by Payment and Financing Method, 2026-2036
- Figure 165: South Asia and Pacific Market Attractiveness Analysis by Payment and Financing Method
- Figure 166: Middle East and Africa Market Value Share and BPS Analysis by Country, 2026 and 2036
- Figure 167: Middle East and Africa Market Value Share and BPS Analysis by Art Experience, 2026 and 2036
- Figure 168: Middle East and Africa Market Y-o-Y Growth Comparison by Art Experience, 2026-2036
- Figure 169: Middle East and Africa Market Attractiveness Analysis by Art Experience
- Figure 170: Middle East and Africa Market Value Share and BPS Analysis by Traveler Type, 2026 and 2036
- Figure 171: Middle East and Africa Market Y-o-Y Growth Comparison by Traveler Type, 2026-2036
- Figure 172: Middle East and Africa Market Attractiveness Analysis by Traveler Type
- Figure 173: Middle East and Africa Market Value Share and BPS Analysis by Trip Scope, 2026 and 2036
- Figure 174: Middle East and Africa Market Y-o-Y Growth Comparison by Trip Scope, 2026-2036
- Figure 175: Middle East and Africa Market Attractiveness Analysis by Trip Scope
- Figure 176: Middle East and Africa Market Value Share and BPS Analysis by Party Size, 2026 and 2036
- Figure 177: Middle East and Africa Market Y-o-Y Growth Comparison by Party Size, 2026-2036
- Figure 178: Middle East and Africa Market Attractiveness Analysis by Party Size
- Figure 179: Middle East and Africa Market Value Share and BPS Analysis by Art Tourism Market by Traveler Age Cohort, 2026 and 2036
- Figure 180: Middle East and Africa Market Y-o-Y Growth Comparison by Art Tourism Market by Traveler Age Cohort, 2026-2036
- Figure 181: Middle East and Africa Market Attractiveness Analysis by Art Tourism Market by Traveler Age Cohort
- Figure 182: Middle East and Africa Market Value Share and BPS Analysis by Expenditure Tier, 2026 and 2036
- Figure 183: Middle East and Africa Market Y-o-Y Growth Comparison by Expenditure Tier, 2026-2036
- Figure 184: Middle East and Africa Market Attractiveness Analysis by Expenditure Tier
- Figure 185: Middle East and Africa Market Value Share and BPS Analysis by Payment and Financing Method, 2026 and 2036
- Figure 186: Middle East and Africa Market Y-o-Y Growth Comparison by Payment and Financing Method, 2026-2036
- Figure 187: Middle East and Africa Market Attractiveness Analysis by Payment and Financing Method
- Figure 188: Global Market - Tier Structure Analysis
- Figure 189: Global Market - Company Share Analysis
Frequently Asked Questions
How big is the art tourism market in 2026, and what is forecast for 2036?
In the FMI report, global art tourism valuation stands at USD 57.5 billion in 2026 compared with USD 54.7 billion in 2025 and reaches USD 95.5 billion by 2036.
What is the CAGR for the art tourism market from 2026 to 2036?
Future Market Insights projects a 5.2% compound annual growth rate over 2026 to 2036, generating USD 38.0 billion in incremental ten-year valuation across exhibition travel.
Which art experience segment leads the art tourism market?
International biennials and art fairs with exhibitions capture 39.4% of art experience demand in 2026 since marquee fair weeks concentrate collectors and curators with international leisure visitors.
Which traveler type segment leads the art tourism market?
Cultural enthusiasts and leisure tourists secure 61.8% of the traveler type category in 2026 seeing that museum retrospectives and immersive projection halls attract broad urban leisure visitors.
Which country has a notable growth outlook during the assessment period?
Japan records a 5.9% CAGR through 2036, followed by South Korea at 5.6% and Spain at 5.4%, while the United States advances at 5.3% and France grows at 5.1%.
Who are the key players in the market?
MCH Group AG Art Basel and Frieze Events Ltd. with TeamLab Inc. and Culturespaces SAS lead exhibition attendance. Christie's International plc and Sotheby's with Viator Inc. anchor auction previews and curated museum tours.
Preview the report firsthand - request a free sample
Get SampleGet the brochure for pricing and purchase details.
Get PDF
