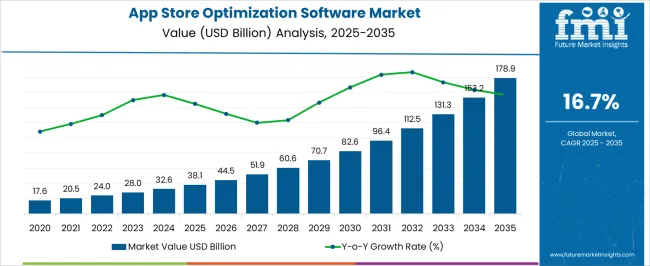
The App Store Optimization Software Market is estimated to be valued at USD 38.1 billion in 2025 and is projected to reach USD 178.9 billion by 2035, registering a compound annual growth rate (CAGR) of 16.7% over the forecast period.

| Metric | Value |
|---|---|
| App Store Optimization Software Market Estimated Value in (2025 E) | USD 38.1 billion |
| App Store Optimization Software Market Forecast Value in (2035 F) | USD 178.9 billion |
| Forecast CAGR (2025 to 2035) | 16.7% |
The app store optimization (ASO) software market is progressing steadily, driven by the exponential growth of mobile applications and the intensifying competition among developers to secure user visibility. Industry updates and technology reports have underscored the role of ASO tools in improving app discoverability, conversion rates, and user acquisition efficiency. With increasing advertising costs, app publishers are prioritizing organic growth strategies, creating a strong demand for advanced ASO solutions.
Product innovations have emphasized AI-driven keyword analysis, competitive benchmarking, and predictive analytics, enabling developers to optimize app listings with precision. Additionally, the rise of subscription-based revenue models has heightened the need for ongoing visibility and retention strategies, further enhancing software adoption.
Investor briefings and company announcements have highlighted the integration of ASO platforms with mobile analytics and marketing automation tools, creating comprehensive solutions for app lifecycle management. Looking forward, demand will be sustained by the continued expansion of mobile gaming, entertainment, and e-commerce applications, coupled with the growing penetration of data-driven platforms in global markets.

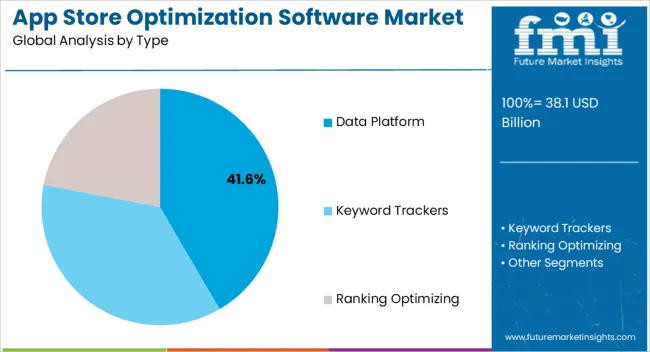
The Data Platform segment is projected to hold 41.60% of the app store optimization software market revenue in 2025, maintaining its position as the leading type. Growth in this segment has been driven by the increasing reliance on data-centric strategies for app visibility and performance management. Developers and publishers have prioritized data platforms for their ability to provide real-time insights into search trends, user engagement, and competitive positioning.
Continuous enhancements in machine learning algorithms have strengthened the accuracy of predictive analytics within these platforms, enabling proactive adjustments to app listings. Additionally, the integration of cross-channel performance data has supported decision-making across marketing campaigns and app updates.
Industry announcements have revealed expanding partnerships between ASO software providers and mobile analytics firms, which has further reinforced the utility of data platforms. As app ecosystems grow more competitive, the Data Platform segment is expected to remain critical for delivering actionable intelligence and sustaining long-term user acquisition strategies.

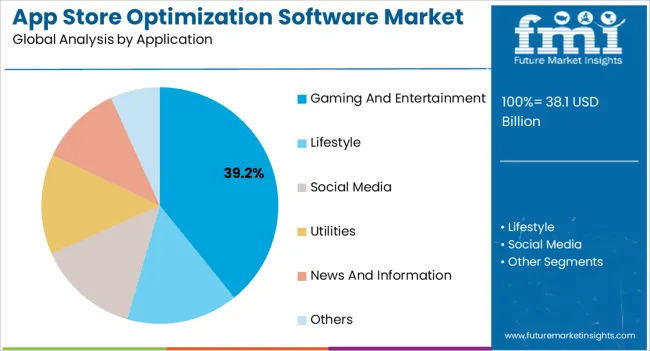
The Gaming and Entertainment segment is projected to contribute 39.20% of the app store optimization software market revenue in 2025, leading the application landscape. This growth has been supported by the dominance of gaming and entertainment apps in global app store revenues and downloads. Publishers in this segment face high competition and shorter app lifecycles, intensifying the need for ASO solutions that ensure consistent visibility and ranking.
Industry reports have emphasized that ASO tools tailored for gaming and entertainment have focused on optimizing creative assets, such as icons, screenshots, and videos, to drive higher conversion rates. Furthermore, frequent updates and live-ops events in gaming applications require ongoing optimization, reinforcing software demand.
Market momentum has also been boosted by entertainment platforms expanding globally, where localized ASO strategies play a critical role in reaching diverse user bases. As gaming and entertainment remain at the forefront of mobile app adoption, the segment is expected to sustain its leadership in ASO software applications, supported by continuous investment in creative optimization and user acquisition efficiency.
The global market for the App Store Optimization Software Market expanded at a CAGR of 21.8% over the last four years (2020 to 2025). With an absolute dollar opportunity of USD 38.1 billion during 2025 to 2035, the market is projected to reach a valuation of USD 160,918.1 million by 2035.
The two key drivers of market growth are the increase in downloads and growth in the number of devoted mobile users. Increased organic app installs are one of the key benefits of Google Play Store and App Store Optimization.
As a result of the marketing plan, the app will rank higher in the App Store/Play Store's search section, making it even simpler for people to find and download the app while looking for a comparable one.
In the long term, this increases the likelihood of more app installs. Additionally, the number of people seeking a similar app rises when it comes to optimizing the Google Play Store or App Store app for the proper keywords.
ASO software increases the likelihood of attracting relevant traffic rather than simply consumers who accidentally land on the app page while searching for a different type of app.
Furthermore, it is much simpler to persuade the appropriate customers to download and use the app once they have arrived at it. This suggests that it takes less time and money to convert consumers into paying customers.
Additionally, ASO makes suggestions for improving or keeping positioning. Many products in the market offer competitive intelligence elements, including detailed ranking and download information for both an app developed by a company and its rivals.
Developers and app marketers frequently use app store optimization software to boost their app's ranking and make it stand out in app stores like the App Store and Google Play. Similar to SEO software in many aspects, app store optimization software is created expressly for app stores.
ASO offers a number of benefits over conventional updating and other forms of advertising. To promote their apps, app developers and marketers are able to select ASA keywords that suit their needs. By raising prices for exact match keywords or designating certain terms as negative keywords to prevent bidding for them, they can modify bids based on performance.
ASO ranking is primarily influenced by relevance rather than just bids, therefore advertisers must find relevant keywords rather than just bidding randomly on terms. Basic and advanced payment models are available.
The fundamental strategy is based on CPI (cost per installation), thus marketers wouldn't need to select audience granularities or pertinent keywords. Instead, Apple automatically matches ads to likely clients and allows marketers to pause them whenever they like.
For advertisers who have limited time and financial resources but want to boost the number of installations, this type of ASO is appropriate. The enhanced model offers more options and provides marketers more control over their targeting abilities, making it more sophisticated.
The sophisticated approach allows marketers to choose their own keywords, manage when viewers see their ads and make use of their own creative resources. The advanced ASO, which is ideal for marketers with advertising knowledge and a sufficient budget, is based on CPT (cost per tap).
The key drawback of ASO is that it takes a lot of time and requires continual supervision. The ASO software has to be updated and needs to perform A/B testing, deep linking, and periodic description changes. Therefore, the development of the app store optimization software has been hampered by the expense of putting up teams of trained workers and equipment.
According to a study, around 3.5 million apps are now being offered on Google Play. It would affect about 11.0% of the apps by the new Google Play guidelines. This includes nearly equal shares of mobile games which are 11.2% and non-gaming apps which are 10.4%. More popular apps won't encounter many difficulties.
However, this will be a significant issue for other applications that rely on utilizing every character that Google has available. In other words, the new guidelines will have the terrible unintended consequence of reducing a crucial competitive advantage for less well-known apps and games.
The development of app store optimization tools has been significantly hampered by the app shop's constantly changing policies.
The large market share of App Store Optimization Software in North America is attributed to the presence of key players along with several emerging start-ups in the region. North America accounts for 2/5th of the global app store optimization software market.
It is realistic to anticipate that more North American app publishers will make investments in business growth tools and solutions.
In any event, both good and negative effects are expected to affect more than 385 thousand apps. when the app marketplaces undergo any structural modifications. There is a significant probability that these apps are already carefully selecting their keywords for optimization.
That is to say, publishers are aware of the significant adjustments made by the app store businesses and will take the essential action by utilizing app store optimization software to lessen that difficulty. As a result, North America offers significant potential for future market expansion.
The United States will account for over USD 178.9 billion of the global App Store Optimization Software Market by the year 2035. App Store Optimization Software Market growth from 2020 to 2025 was estimated at 21.4% CAGR.
The United States has the headquarters of the world’s biggest IT companies like Google, Amazon, Facebook, etc. Many of the popular app stores are owned by these companies which brings huge revenue to the company.
This revenue is reinvested again in the development of the platform. Hence the United States dominates the App store optimization software market.
The market growth through social media applications expanded at a CAGR of 21.2% during 2020 to 2025. With a projected CAGR of 17% for the next ten years. The social media platform has greater penetration among all sections of society. 58.4% of the world population uses one or other social media platforms, directly or indirectly.
The average time spent on the platform is around 2 hours and 27 minutes. Around 450 Million people around the world came online in the past 24 hours. Providing a seamless experience is crucial for I.T. companies to survive the competition. Hence ASO market is huge potential for growth in the future.

At present, App Store Optimization companies are largely aiming to bring policy reforms in their app stores and setting up collaboration for better market capture.
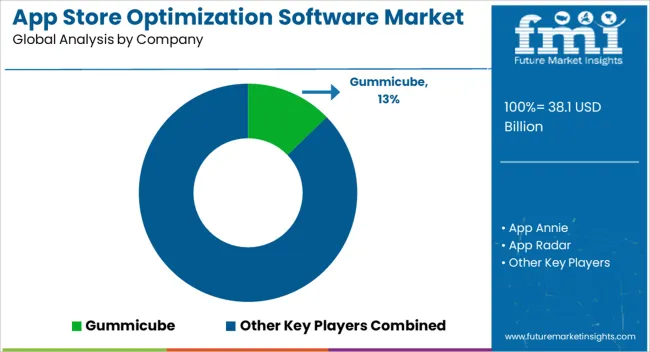
The key companies operating in the App Store Optimization Software Market include Gummicube, App Annie, App Radar, Lab Cave, PreApps, Tune, Appfigures, SensorTower Inc., StoreMaven, TheTool, AppTopia, PrioriData, ASODesk, AppCodes, Mobile Action, AppTweak, SearchMan, Keyword Tool, appScatter, SplitMetrics, Reflection.io, RankMyApps, AppFollow, App Annie, Adjust GmbH, MightySignal, and KUMULOS.
Some of the recent developments by key providers of the App Store Optimization Software Market are as follows:
Similarly, recent developments related to companies providing services for App Store Optimization Software have been tracked by the team at Future Market Insights, which is available in the full report.
The global app store optimization software market is estimated to be valued at USD 38.1 billion in 2025.
The market size for the app store optimization software market is projected to reach USD 178.9 billion by 2035.
The app store optimization software market is expected to grow at a 16.7% CAGR between 2025 and 2035.
The key product types in app store optimization software market are data platform, keyword trackers and ranking optimizing.
In terms of application, gaming and entertainment segment to command 39.2% share in the app store optimization software market in 2025.


Full Research Suite comprises of:
Market outlook & trends analysis
Interviews & case studies
Strategic recommendations
Vendor profiles & capabilities analysis
5-year forecasts
8 regions and 60+ country-level data splits
Market segment data splits
12 months of continuous data updates
DELIVERED AS:
PDF EXCEL ONLINE
Application Integration Market Size and Share Forecast Outlook 2025 to 2035
Application Programming Interface (API) Security Market Size and Share Forecast Outlook 2025 to 2035
Application Development and Modernization (ADM) Market Size and Share Forecast Outlook 2025 to 2035
Application Release Automation Market Size and Share Forecast Outlook 2025 to 2035
Application Delivery Controllers Market Size and Share Forecast Outlook 2025 to 2035
Application Virtualization Market Size and Share Forecast Outlook 2025 to 2035
Apparel Market Size and Share Forecast Outlook 2025 to 2035
Apple Seed Oil Market Size and Share Forecast Outlook 2025 to 2035
Appendage Management Market Size and Share Forecast Outlook 2025 to 2035
Applicator Tips Market Size and Share Forecast Outlook 2025 to 2035
Application Specific Integrated Circuit Market Size and Share Forecast Outlook 2025 to 2035
Apple Accessories Market Report – Demand, Trends & Forecast 2025–2035
Applicant Tracking System Market Size and Share Forecast Outlook 2025 to 2035
Apparel Re-commerce Market Size and Share Forecast Outlook 2025 to 2035
Application Processor Market Size and Share Forecast Outlook 2025 to 2035
Apple Cider Vinegar Market Analysis - Size, Share, and Forecast Outlook 2025 to 2035
Application Delivery Network Market by Product, End-user, Environment, Deployment Type, Vertical, and Region, Forecast through 2035
Application Metrics and Monitoring Tools Market Analysis By Component, Mode, Deployment, Verticals, and Region through 2035
App Analytics Market Trends – Growth & Industry Forecast 2023-2033
Application Centric Infrastructure Market

Thank you!
You will receive an email from our Business Development Manager. Please be sure to check your SPAM/JUNK folder too.
Chat With
MaRIA