The Anti-corrosion Bags Market is estimated to be valued at USD 16.9 billion in 2025 and is projected to reach USD 32.5 billion by 2035, registering a compound annual growth rate (CAGR) of 6.8% over the forecast period.
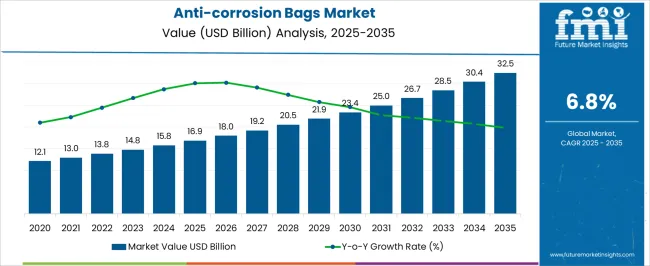
| Metric | Value |
|---|---|
| Anti-corrosion Bags Market Estimated Value in (2025 E) | USD 16.9 billion |
| Anti-corrosion Bags Market Forecast Value in (2035 F) | USD 32.5 billion |
| Forecast CAGR (2025 to 2035) | 6.8% |
The anti-corrosion bags market is expanding steadily, supported by the rising need for packaging solutions that extend product shelf life and protect sensitive components from oxidation and environmental damage. Industry reports and manufacturing updates have emphasized the increasing use of such bags across automotive, electronics, and industrial sectors where material integrity is critical. Growth in global trade and cross-border shipments of high-value goods has further increased reliance on advanced protective packaging.
Additionally, manufacturers have been investing in innovative barrier materials and sealing technologies to improve moisture resistance and anti-rust performance. The demand for sustainable and recyclable packaging formats has also influenced product development, as companies align with circular economy initiatives. In the near term, multi-layer anti-corrosion bags and specialized formats such as zipper designs are gaining traction due to their enhanced functionality.
Looking forward, market momentum is expected to be driven by regulatory requirements for safe storage, the expansion of automotive and electronics exports, and continued adoption of advanced corrosion-prevention packaging in logistics and manufacturing operations.
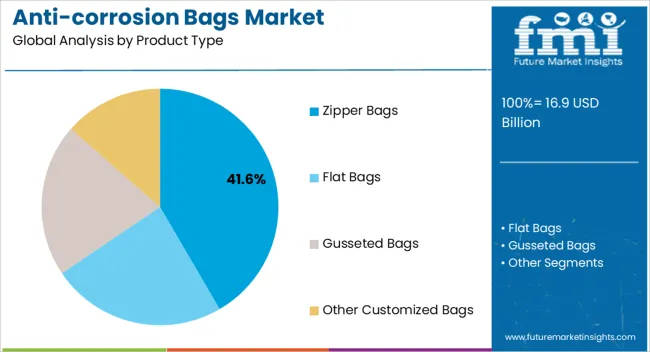
The Zipper Bags segment is projected to account for 41.60% of the anti-corrosion bags market revenue in 2025, maintaining its leadership position among product types. Growth in this segment has been fueled by the convenience of resealable closures, which allow repeated use while ensuring product protection. Industrial users have preferred zipper bags for their ease of handling, efficient storage, and ability to maintain protective properties even after multiple openings.
Furthermore, these bags provide flexible packaging solutions that are well-suited for both small components and larger assemblies, supporting a broad range of industrial applications. The increasing use of zipper anti-corrosion bags in warehousing and export logistics has strengthened demand, as they reduce the risk of corrosion during transit and storage.
With ongoing advancements in film technologies and sealing strength, the Zipper Bags segment is expected to retain its dominance in the product landscape.
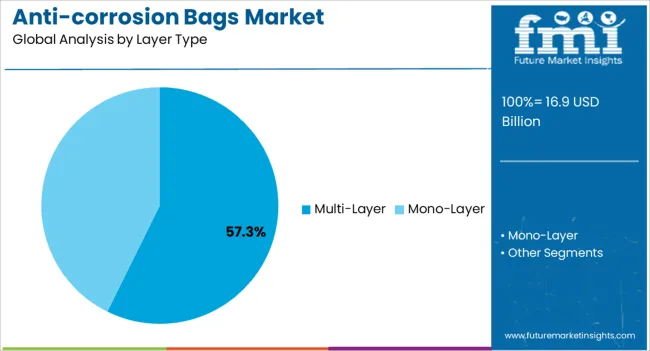
The Multi-Layer segment is projected to contribute 57.30% of the anti-corrosion bags market revenue in 2025, making it the leading layer type. This dominance has been supported by the superior barrier properties offered by multi-layer films, which provide enhanced resistance against moisture, oxygen, and corrosive agents. Manufacturers have adopted multi-layer structures to combine mechanical durability with chemical stability, offering long-lasting protection in demanding storage and transport conditions.
Industrial packaging reports have highlighted the increasing role of multi-layer bags in protecting precision machinery, electronics, and automotive components during long-term storage. In addition, the ability to incorporate anti-static and UV-resistant properties into multi-layer formats has further broadened their adoption.
As companies seek cost-efficient yet high-performance packaging solutions, the Multi-Layer segment is expected to remain the preferred choice for corrosion-sensitive products.
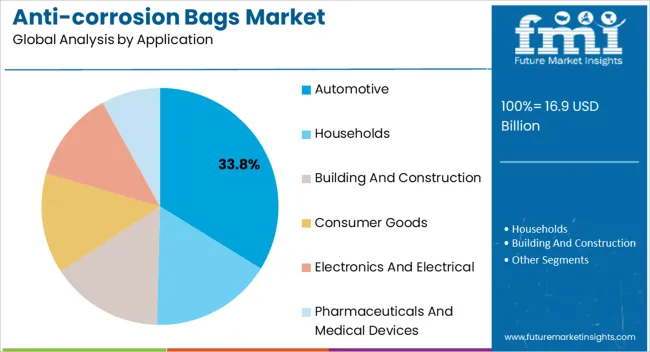
The Automotive segment is projected to hold 33.80% of the anti-corrosion bags market revenue in 2025, establishing itself as the leading application area. Growth in this segment has been driven by the critical need to protect automotive parts such as engines, transmissions, and metal components from rust during storage and shipping. The global expansion of automotive manufacturing and supply chains has increased demand for specialized packaging that ensures product quality across diverse climates and long-distance logistics.
Automakers and suppliers have increasingly relied on anti-corrosion bags to meet stringent quality control and customer satisfaction standards. Additionally, as the automotive industry transitions toward electric vehicles, the need to safeguard sensitive metal and electronic components has reinforced the use of corrosion-prevention packaging.
With production volumes rising in both established and emerging automotive markets, the Automotive segment is expected to sustain its leading position in the anti-corrosion bags market.
The global demand for anti-corrosion bags increased at a CAGR of 3.4% during the forecast period between 2020 and 2025, reaching a total of USD 32.5 billion in 2035.
According to Future Market Insights, a market research and competitive intelligence provider, the anti-corrosion bags market was valued at USD 16.9 billion in 2025.
The rise in global trade has significantly increased the movement of goods across borders, leading to a greater emphasis on effective packaging solutions that can ensure the integrity of products during transportation. The trend has particularly fueled the demand for anti-corrosion bags, which play a crucial role in safeguarding goods from corrosion-related damage.
International shipments often involve extended transit durations, exposing products to varying environmental conditions. Factors such as humidity, temperature fluctuations, and exposure to saltwater can accelerate corrosion. Anti-corrosion bags are designed to create a protective barrier that shields products from these elements, ensuring they arrive at their destination in the same condition as when they were shipped.
Goods transported across borders may pass through multiple transportation modes, including ships, trucks, and airplanes. Each mode exposes products to unique environmental challenges. Anti-corrosion bags provide a versatile and reliable solution that can withstand the rigors of different shipping environments, maintaining the products' corrosion-free status.
Modern supply chains are complex and global, involving multiple intermediaries and distribution points. During this journey, products can be subjected to numerous handling processes and storage conditions. Anti-corrosion bags provide a consistent and reliable layer of protection that minimizes the risk of corrosion-related damage at every stage of the supply chain.
Automation and Industry 4.0 is Likely to be Beneficial for Market Growth
The integration of anti-corrosion solutions into automated manufacturing and supply chain processes, in alignment with Industry 4.0 principles, represents a significant advancement in the field of corrosion protection. The trend is driven by the increasing need for efficient, reliable, and technologically advanced solutions to ensure the quality and integrity of products as they move through the production and distribution cycle.
Industry 4.0 emphasizes the use of interconnected devices, sensors, and data analytics to create a smart and connected manufacturing environment. Anti-corrosion bags can be integrated into this network, allowing for real-time monitoring of the conditions and protection status of products throughout the manufacturing process.
Automated systems enabled by Industry 4.0 can predict maintenance needs and potential issues. Anti-corrosion bags equipped with smart sensors can also provide real-time data on the effectiveness of corrosion protection. Manufacturers can monitor the bags' performance and replace them proactively, preventing any potential corrosion-related damage.
Industry 4.0 enables end-to-end visibility of supply chains through the use of technologies like IoT (Internet of Things) and RFID (Radio-Frequency Identification). Anti-corrosion bags integrated with these technologies can be tracked and monitored as they move through the supply chain, ensuring that products remain protected at all times.
Research & Development to Fuel the Market Growth
Ongoing research and development (R&D) efforts play a pivotal role in driving innovation and growth within the anti-corrosion bags market. Manufacturers are continually striving to develop new formulations and technologies that offer enhanced protection against corrosion, longer-lasting performance, and compatibility with diverse materials.
R&D efforts focus on creating anti-corrosion bag formulations that are more effective in preventing corrosion across a broad spectrum of materials, including metals, electronics, machinery components, and more. The formulations may incorporate specialized additives, inhibitors, and coatings to provide targeted protection tailored to specific applications.
One key objective of R&D is to extend the protection period offered by anti-corrosion bags. Manufacturers aim to develop solutions that can safeguard products for longer durations, whether during storage, transportation, or export, which is particularly crucial for industries with extended supply chains and storage requirements.
R&D teams work to ensure that anti-corrosion bag formulations are compatible with various materials and substrates. The versatility allows businesses across different industries to confidently use anti-corrosion bags to protect their products without concerns about adverse reactions or incompatibilities.
By product type, zipper bags segment is estimated to be the leading segment at a CAGR of 7.0% during the forecast period.
Zipper bags provide a user-friendly and resealable design that allows easy access to the contents while maintaining a secure seal. The convenience is highly valued by industries where frequent access to the protected items is required, such as automotive, electronics, and machinery.
Zipper bags are suitable for a wide range of products, from small components to larger items. Their adaptable size and shape make them versatile for packaging various goods, contributing to their widespread adoption across different sectors.
The resealable feature of zipper bags ensures that items remain protected from corrosion after every use, and this feature is particularly advantageous for industries that need to frequently access and reseal the bags to prevent exposure to corrosive elements.
Manufacturers can customize zipper bags with specific sizes, materials, and additional features to meet the unique requirements of different industries. The flexibility makes zipper bags an attractive choice for businesses seeking tailored anti-corrosion solutions.
By application, electronics & electrical segment is estimated to be the leading segment at a CAGR of 7.0% during the forecast period.
The electronics and electrical industry deals with highly sensitive and valuable components, such as circuit boards, semiconductors, connectors, and sensors. The components are vulnerable to corrosion, which can lead to malfunction or complete failure. Anti-corrosion bags provide a reliable barrier to protect these components during storage, transportation, and assembly.
The electronics industry has a global supply chain, with components often traveling long distances before final assembly. Anti-corrosion bags ensure that components remain corrosion-free throughout the supply chain, even in varying environmental conditions and climates.
The growing demand for consumer electronics, including smartphones, tablets, laptops, and wearable devices, drives the need for effective corrosion protection. Anti-corrosion bags play a crucial role in preserving the integrity and functionality of these devices, ensuring customer satisfaction.
Modern vehicles rely heavily on electronics for various functions, including safety, entertainment, navigation, and diagnostics. Anti-corrosion bags help safeguard automotive electronics from moisture, humidity, and corrosive gases, contributing to the overall reliability and performance of vehicles.
Europe is anticipated to remain at the forefront in the assessment period by generating the largest anti-corrosion bags market share. The growth is attributable to the presence of numerous well-established industries, such as food and beverages, building and construction, and automotive in the region.
As per the European Commission (EU), the region is considered to be the biggest producer of motor vehicles in the world. Its automotive sector provides indirect and direct jobs to nearly 13.8 million Europeans, which represents around 6.1% of the total employment in the EU. The trend is likely to continue throughout the forthcoming years, thereby propelling the market across Europe. The region is expected to hold a CAGR of 7.0% over the analysis period
The increasing usage of anti-corrosion bags for the transportation of medical devices, especially in the United States is estimated to augment the North America market. The government of this country is also taking several initiatives to compel manufacturers to use advanced packaging materials.
According to SelectUSA, the United States is considered to be one of the world’s most supportive domestic environments for the commercialization and development of pharmaceuticals with minimum barriers. Many firms in this country conduct research and development activities worth USD 75 billion in pharmaceuticals alone. The factors are projected to augur well for the North America anti-corrosion bags market size in future. The region is expected to hold a CAGR of 6.9% over the analysis period
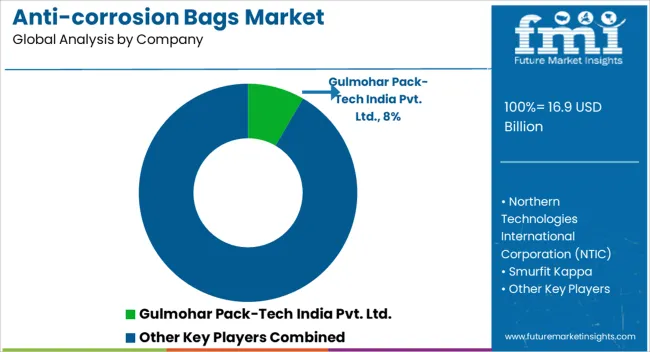
Key players in the anti-corrosion bags market are strongly focusing on profit generation from their existing product portfolios along while exploring potential new applications. The players are emphasizing on increasing their anti-corrosion bags production capacities, to cater to the demand from numerous end use industries. Prominent players are also pushing for geographical expansion to decrease the dependency on imported anti-corrosion bags.
Recent Developments:
| Attribute | Details |
|---|---|
| Forecast Period | 2025 to 2035 |
| Historical Data Available for | 2020 to 2025 |
| Market Analysis | USD Billion for value and Tons for Volume |
| Key Regions Covered | North America; Latin America; Western Europe; Eastern Europe; South Asia & Pacific; East Asia; Middle East & Africa |
| Key Countries Covered | United States, Canada, Brazil, Mexico, Germany, United Kingdom, France, Spain, Italy, Poland, Russia, Czech Republic, Romania, India, Bangladesh, Australia, New Zealand, China, Japan, South Korea, GCC Countries, South Africa, Israel |
| Key Segments Covered | Product Type, Layer Type, Application, Region |
| Key Companies Profiled | Gulmohar Pack-Tech India Pvt. Ltd.; Northern Technologies International Corporation (NTIC); Smurfit Kappa; H L Saw Mill; NEFAB Group; Acme Packaging; Modi Polyfab Pvt Ltd.; Pontus Pack Private Limited; Metpro Group; Suprabha; AGM Container Controls, Inc.; Benz Packaging; Cortec Corporation; Daubert Cromwell, Inc.; Safepack Industries Ltd.; Intertape Polymer Group; Sealed Air; Rose Plastic AG; EMBALEX, S.L.U. |
| Report Coverage | Market Forecast, brand share analysis, competition intelligence, DROT analysis, Market Dynamics and Challenges, Strategic Growth Initiatives |
| Customization & Pricing | Available upon Request |
The global anti-corrosion bags market is estimated to be valued at USD 16.9 billion in 2025.
The market size for the anti-corrosion bags market is projected to reach USD 32.5 billion by 2035.
The anti-corrosion bags market is expected to grow at a 6.8% CAGR between 2025 and 2035.
The key product types in anti-corrosion bags market are zipper bags, flat bags, gusseted bags and other customized bags.
In terms of layer type, multi-layer segment to command 57.3% share in the anti-corrosion bags market in 2025.


Full Research Suite comprises of:
Market outlook & trends analysis
Interviews & case studies
Strategic recommendations
Vendor profiles & capabilities analysis
5-year forecasts
8 regions and 60+ country-level data splits
Market segment data splits
12 months of continuous data updates
DELIVERED AS:
PDF EXCEL ONLINE
Polybags Market Size and Share Forecast Outlook 2025 to 2035
Net Bags Market
VCI Bags Market
Sandbags Market
Leno Bags Market Size and Share Forecast Outlook 2025 to 2035
Silo bags Market Size and Share Forecast Outlook 2025 to 2035
Food Bags Market Share, Size, and Trend Analysis for 2025 to 2035
Competitive Breakdown of Silo Bag Manufacturers
Paper Bags Market Size and Share Forecast Outlook 2025 to 2035
Jumbo Bags Market Size and Share Forecast Outlook 2025 to 2035
Blood Bags Market Size and Share Forecast Outlook 2025 to 2035
Craft Bags Market Growth, Trends, Forecast 2025 to 2035
Market Share Breakdown of Craft Bags Manufacturers
Competitive Breakdown of Paper Bags Providers
Market Share Analysis of Jumbo Bags & Key Players
Grout Bags Market Demand & Construction Industry Trends 2024 to 2034
Sugar Bags Market
Cotton Bags Market Size and Share Forecast Outlook 2025 to 2035
Refuse Bags Market Size and Share Forecast Outlook 2025 to 2035
Emesis Bags Market Size and Share Forecast Outlook 2025 to 2035

Thank you!
You will receive an email from our Business Development Manager. Please be sure to check your SPAM/JUNK folder too.
Chat With
MaRIA