Animal Feed Ingredients Market Size, Share, and Forecast Outlook 2025 to 2035

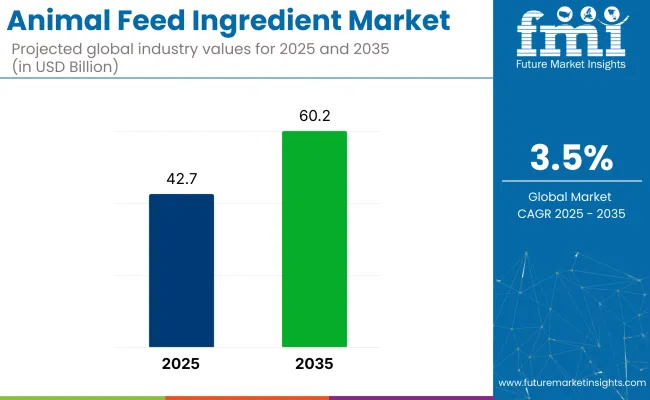
The global animal feed ingredients market was valued at approximately USD 42.7 billion in 2025 and is projected to reach USD 60.2 billion by 2035, expanding at a steady CAGR of 3.5%. This growth trajectory underscores the increasing role of feed ingredients, particularly protein-based components, in meeting the nutritional requirements of livestock, poultry, and aquaculture systems.
Quick Stats of Animal Feed Ingredient Market

  • Market Value (2025): USD 42.7 billion
  • Forecast Value (2035): USD 60.2 billion
  • Forecast CAGR (2025 to 2035): 3.5%
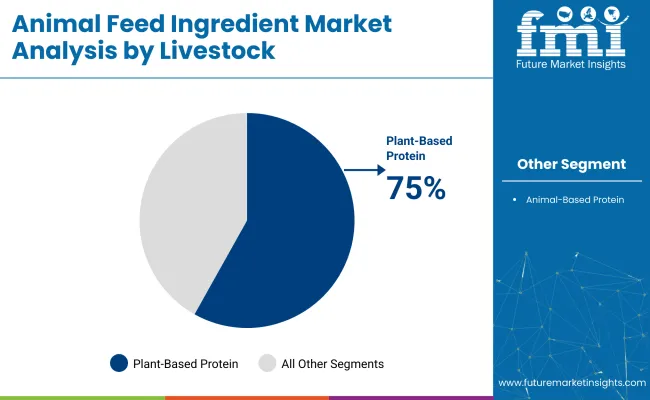
  • Leading Segment in 2025: Plant-based Protein(75% share)
  • Key Growth Region: Asia Pacific (India it the fastest-growing market with 4.5% CAGR)
  • Key Players: DuPont, Mosaic Company, BurconNutrascience Corporation, ADM, Alltech, Hamlet Proteins, DSM, CHS, J.R. Simplot Co., and BRF

Animal Feed Ingredients Market

As the demand for high-quality protein from meat, eggs, and dairy products rises globally, animal feed ingredients become increasingly indispensable in ensuring the optimal health, growth, and reproduction of farmed animals.

The animal feed ingredient market plays a significant role within its parent markets. Within the animal feed market, feed ingredients account for 30-35% of the total market, as these ingredients are the foundation of animal nutrition. In the agricultural ingredients market, the share of product is estimated at around 10-12%, as various agricultural products are used for both human consumption and animal feed.

In the livestock and poultry market, feed ingredients contribute about 40-45%, as they are critical to ensuring the growth and health of livestock and poultry. In the pet food market, feed ingredients make up approximately 8-10%, as the demand for nutritious pet food continues to rise. In the agricultural chemicals market, feed ingredients account for around 2-3%, due to the use of chemicals for preservation and nutrient enhancement.

A primary driving factor behind the market's expansion is the global shift towards more intensive animal husbandry practices. As the world population continues to grow, the demand for animal-based food products has surged, particularly in emerging economies such as China and India, where rising middle-class populations are contributing to greater consumption of meat and dairy.

In these regions, the demand for efficient animal feed is crucial to support livestock productivity. China, with its large-scale livestock sector, is projected to remain the most lucrative market, given its substantial contribution to the global feed market. National policies favoring domestic feed formulation further boost the market in this region. The rising consumption of animal protein in emerging economies is a significant factor driving the demand for high-quality feed ingredients.

APHIS’ NADPRP is set to provide up to USD 16.5 million in FY 2025 funding to boost disease preparedness, early detection, biosecurity, and emergency response in livestock, poultry, equine, sheep/goat, and aquaculture sectors

Analysis of Animal Feed Ingredient Market by Top Investment Segments 

The compound feed segment leads the market, driven by its role in providing balanced nutrition for livestock and poultry. Plant-based proteins dominate demand due to their cost-effectiveness and sustainability, while the poultry segment remains the largest, fueled by the rising global demand for meat and eggs.

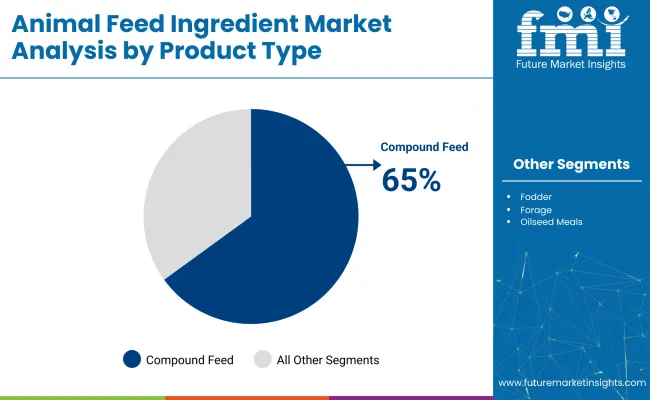
By Product Type, Compound Feed Segment Accounts for Over 65% Share

The compound feed segment is the dominant player in the animal feed ingredients market, accounting for 65% of the total market share in 2025. This dominant position is driven by the increasing reliance on compound feed in both the livestock and poultry industries, where it plays a critical role in providing balanced and nutritionally complete diets for animals.
  • Compound feed combines a variety of ingredients, including grains, protein meals, vitamins, and minerals, which are formulated to meet the specific nutritional needs of animals at different growth stages.
  • The global demand for meat, dairy, and eggs continues to rise, the compound feed segment is predicted to maintain its leadership position due to its ability to support large-scale, efficient animal production. Its role in improving feed efficiency and ensuring optimal animal health makes it the most influential segment in the animal feed market, and this trend is expected to persist throughout the forecast period.

Animal Feed Ingredients Market Analysis By Product Type

Plant-based Protein Lead Product Demand

The plant-based protein segment dominates the market, accounting for a significant share of 75% in 2025. This dominance is driven by the widespread availability and cost-effectiveness of plant-based protein sources such as soy, wheat gluten, and corn gluten meal, which are extensively used in animal feed formulations.
  • The demand for sustainable and cost-efficient feed solutions grows, plant-based proteins are increasingly favored due to their lower environmental impact compared to animal-based proteins.
  • Plant-based proteins provide essential amino acids and nutrients required for optimal animal growth and development, making them the preferred choice for large-scale animal production systems, particularly in regions with expanding livestock industries.
  • The segment is expected to maintain its leading position throughout the forecast period, driven by increasing demand for plant-derived feed ingredients.

Animal Feed Ingredients Market Analysis By Livestock

Growing Product Demand for Poultry Applications with 45% Share

The poultry segment holds the largest market share in the market, accounting for approximately 45% of the total market in 2025. This dominance is driven by the global demand for poultry products, including meat and eggs, which are staples in many diets.

  • Poultry farming is one of the most widespread and intensive forms of livestock production, the demand for high-quality animal feed ingredients, particularly protein-rich sources like soy protein concentrate and corn gluten meal, is substantial.
  • Poultry feed formulations are designed to meet the specific nutritional needs of chickens at different growth stages, ensuring optimal health, growth, and production efficiency. As the global population continues to grow and the demand for affordable protein sources rises, the poultry segment is expected to maintain its dominant position in the animal feed market throughout the forecast period.

Top Animal Feed Ingredient Market Dynamics

Rising Demand for Animal Protein

The global increase in the consumption of animal protein is a major driving force behind the growth of the market. As the world population grows and disposable incomes rise, particularly in emerging economies, there is a greater demand for meat, dairy, and egg products. This has led to intensified livestock farming and the need for higher quality and more efficient animal feed.

With animal protein becoming a key dietary source, the market for feed ingredients, especially those used in poultry, swine, and ruminant farming, continues to expand. As such, the need for balanced and nutritious feed solutions remains critical for supporting the productivity of these industries.

Cost Efficiency drives the Market

As awareness around environmental impacts increases, the demand for more feed options, including plant-based proteins and novel protein sources like insect meal, is rising. The volatility of raw material prices, particularly for animal-based protein, has prompted producers to seek more cost-effective alternatives.

This shift towards plant-based and alternative protein sources is driven by both the need to reduce environmental impact and the rising pressure on producers to maintain profitability while meeting global food production demands. The integration of such sustainable practices is expected to continue influencing market dynamics.
Analysis of Top Countries Manufacturing, Exporting and Supplying Animal Feed Ingredient Globally

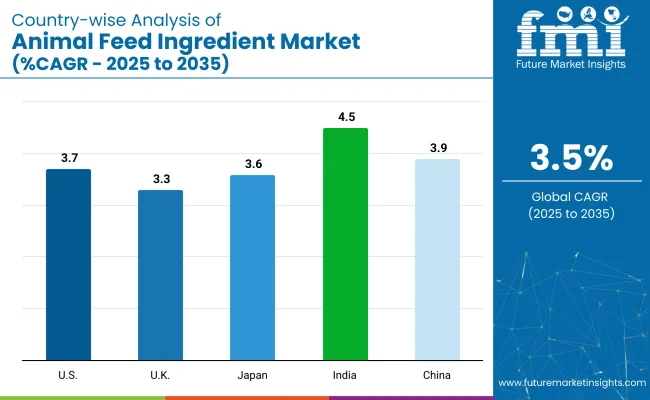
Country Wise Analysis Of Animal Feed Ingredients Market Cagr 2025 To 2035

Countries CAGR (2025 to 2035)
USA 3.7%
UK 3.3%
Japan 3.6%
India 4.5%
China 3.9%

India’s momentum is driven by its rapidly expanding poultry, dairy, and aquaculture industries, coupled with rising demand for high-quality feed ingredients. China follows closely, with a projected 3.9% CAGR, supported by government initiatives promoting sustainable farming and increasing demand for feed in its growing livestock sector. In contrast, developed economies such as Japan (3.6%), the United Kingdom (3.3%), and the United States (3.7%) are expanding at a steady 0.95-1.03x rate.

The United States leads the demand for feed ingredients, driven by the livestock and poultry industries, focusing on feed efficiency and sustainability. Japan benefits from advancements in specialized, high-performance feed ingredients for poultry and aquaculture. As the market grows and adds over USD 200 million by 2035, both high-growth regions like India and China and stable demand from OECD countries will shape its trajectory.

The report covers detailed analysis of 40+ countries, with the top five countries shared as a reference.

USA Animal Feed Ingredient Industry Expansion

The USA animal feed ingredient market is estimated to grow at a CAGR of 3.7% during the forecast period. This growth is primarily driven by the country's large-scale and highly advanced livestock industry, which produces a substantial amount of meat, poultry, dairy, and eggs. The USA is the largest producer of animal feed globally, and its demand for high-quality feed ingredients continues to rise as the population grows and consumption patterns shift towards protein-rich diets.

The push towards more efficient and sustainable feed solutions, coupled with technological advancements in feed formulations, has significantly impacted the market's expansion. The USA is also leading in terms of feed innovation, as major players invest in R&D to improve feed efficiency and reduce environmental impacts.

  • The growing demand for animal protein, particularly poultry and beef, fuels the demand for high-quality feed ingredients.
  • Innovation in feed formulations, including plant-based protein alternatives and functional additives, is driving market expansion.
  • Sustainability concerns are prompting the USA to focus on more eco-friendly, cost-effective feed solutions.

UK Animal Feed Ingredient Industry Growth

The UK animal feed ingredient market is projected to grow at a CAGR of 3.3% from 2025 to 2035. The growing demand for animal protein, particularly in poultry and pork, is a significant factor in the UK's feed market expansion. The country has a well-established livestock farming industry that is focused on high-efficiency feed solutions to support its growing population.

The shift towards sustainable and natural feed options is gaining ground as consumers demand cleaner, more eco-friendly products. Advancements in technology are making it easier to produce customized feed for specific animal needs, further driving market growth. The UK government’s focus on sustainable agriculture practices and policies supporting animal welfare also boosts the demand for feed ingredients that meet these standards.

  • A shift towards plant-based protein sources is expected to drive demand for sustainable feed.
  • Technological advancements in feed efficiency and nutrient optimization contribute to market growth.
  • Increasing consumer awareness around sustainability is leading to greater demand for natural, eco-friendly feed solutions.

Animal Feed Ingredient Market Growth Outlook in Japan

Japan’s animal feed ingredient market is expected to grow at a CAGR of 3.6% between 2025 and 2035. This growth can be attributed to the country's strong emphasis on high-quality food production and efficient animal farming practices. Japan is a significant importer of animal feed ingredients, with demand driven by the need to support its poultry and livestock industries.

The country's aging population and the shift towards more health-conscious eating habits are influencing the increased consumption of high-protein foods such as poultry and pork, which in turn increases the demand for high-quality animal feed.

Technological innovations in feed formulations, such as functional feeds that enhance animal health and productivity, are also a major driver of growth. Furthermore, Japan’s commitment to sustainability and eco-friendly practices in agriculture encourages the adoption of sustainable feed alternatives, including plant-based proteins.

  • Growing health-conscious consumer trends lead to increased demand for high-quality animal protein, boosting feed requirements.
  • Japan’s advancements in animal nutrition technology drive the adoption of more efficient feed solutions.
  • Increasing sustainability measures in animal farming are pushing the market towards more eco-friendly feed ingredients.

India Animal Feed Ingredient Market Analysis and Growth Outlook

The Indian animal feed ingredient market is poised to grow at a CAGR of 4.5% during the forecast period, driven by increasing demand for protein-rich foods and the expansion of the livestock sector. India’s growing middle class and changing dietary preferences are driving the consumption of poultry, dairy, and meat products.

This, in turn, has led to increased demand for animal feed ingredients, particularly those that support the rapid growth of the poultry and dairy industries. With India being one of the largest producers of milk, the demand for dairy feed is also a major market driver. The shift towards sustainable feed options, such as plant-based proteins, is gaining traction in response to global environmental concerns. The government’s focus on modernizing agriculture and improving livestock productivity is expected to further bolster the market.

  • Growing middle-class population and increasing consumption of animal protein drive feed ingredient demand.
  • The expansion of the dairy and poultry industries is fueling the need for high-quality feed.
  • Sustainability and environmental concerns are pushing the adoption of plant-based and alternative protein sources in feed formulations.

Demand Forecast for Animal Feed Ingredient Market in China

China’s animal feed ingredient market is estimated to grow at a CAGR of 3.9% from 2025 to 2035. As the world's largest producer and consumer of meat, particularly pork, China has a massive demand for animal feed ingredients to support its extensive livestock sector. The country’s growing urbanization and rising disposable incomes are contributing to increased demand for animal-based protein, particularly in poultry and swine.

China’s government has been implementing policies that promote feed industry modernization and sustainability. The country is increasingly adopting plant-based proteins and novel feed ingredients to reduce the reliance on traditional animal-based proteins, which are subject to price volatility. The growing focus on improving feed efficiency and productivity, alongside efforts to enhance sustainability in agriculture, is set to drive continued growth in the feed ingredients market.

  • Growing demand for meat, particularly pork and poultry, is driving the need for animal feed ingredients.
  • China’s focus on sustainability and feed industry modernization supports the adoption of alternative feed ingredients.
  • Rising disposable incomes and urbanization in China contribute to the expanding demand for high-quality feed ingredients.

Leading Animal Feed Ingredients Suppliers

The animal feed ingredients industry is driven by both established players and emerging innovators focused on enhancing feed quality and efficiency. Leading companies like DuPont, ADM, and DSM are at the forefront with their advanced feed solutions, which cater to the growing demand for high-protein and sustainable feed options.

Mosaic Company and BurconNutrascience Corporation specialize in plant-based protein innovations, offering alternatives that meet the increasing need for eco-friendly feed ingredients. Alltech, Hamlet Proteins, and J.R. Simplot Co. continue to lead with research-backed feed additives and specialized formulations aimed at improving animal health and productivity. In addition, companies like CHS, BRF, and DSM contribute to the market with their diverse feed products that support the expanding livestock and poultry industries.

Recent Animal Feed Ingredients Industry News

  • In May 2025, Mosaic launched afour-year partnership with the Tampa Bay Rayscalled “Runs for Food,” aimed at combating food insecurity in the Tampa Bay region through donations tied to baseball runs scored.
  • In 2024, DSM merged with Firmenich to formDSM-Firmenich, combining strengths in nutrition and health sectors. This merger aims to boost innovation and sustainable development in both animal and human nutrition markets, including animal feed ingredients

Report Coverage and Scope Summary

Report Attributes Details
Market Size (2025) USD 42.7 billion
Projected Market Size (2035) USD 60.2 billion
CAGR (2025 to 2035) 3.5%
Base Year for Estimation 2024
Historical Period 2020 to 2024
Projections Period 2025 to 2035
Quantitative Units USD billion for value and volume in metric tons
Product Type Analyzed (Segment 1) Compound Feed, Fodder, Forage, Oilseed Meals, And Animal-By-Product Meals.
Source Analyzed (Segment 2) Animal-Based Protein And Plant-Based Protein.
Applications Analyzed (Segment 3) Poultry, Ruminants, Swine, Aquatic Animals, Other Animals (Pet Animals, Birds, And Reptiles), Research And Biotech, And Biocatalysts.
Regions Covered North America, Europe, Asia Pacific, Middle East & Africa, Latin America
Countries Covered United States, Canada, Germany, United Kingdom, France, Italy, Spain, China, Japan, South Korea, India, Australia, Brazil, Mexico, Argentina, Saudi Arabia, UAE, South Africa
Key Players DuPont, Mosaic Company, Burcon Nutrascience Corporation, ADM, Alltech, Hamlet Proteins, DSM, CHS, J.R. Simplot Co., and BRF.
Additional Attributes Dollar sales, market share by product type and application, key growth regions, competitive landscape, pricing trends, regulatory factors, and emerging opportunities.

Leading Players

  • Dupont
  • Mosaic Company
  • BurconNutrascience Corporation
  • ADM
  • Alltech
  • Hamlet Proteins
  • DSM
  • CHS
  • J.R. Simplot Co.
  • BRF

Key Animal Feed Ingredient Market Segmentation 

By Product Type:

The industry is segmented into compound feed, fodder, forage, oilseed meals, and animal-by-product meals.

By Source:

The segments include animal-based protein and plant-based protein.

By Application:

The industry finds applications in poultry, ruminants, swine, aquatic animals, other animals (pet animals, birds, and reptiles), research and biotech, and biocatalysts.

By Region:

The industry covers regions including North America, Europe, Asia Pacific, Latin America, and the Middle East & Africa.

Table of Content

  1. Executive Summary
    • Global Market Outlook
    • Demand-side Trends
    • Supply-side Trends
    • Technology Roadmap Analysis
    • Analysis and Recommendations
  2. Market Overview
    • Market Coverage / Taxonomy
    • Market Definition / Scope / Limitations
  3. Market Background
    • Market Dynamics
      • Drivers
      • Restraints
      • Opportunity
      • Trends
    • Scenario Forecast
      • Demand in Optimistic Scenario
      • Demand in Likely Scenario
      • Demand in Conservative Scenario
    • Opportunity Map Analysis
    • Product Life Cycle Analysis
    • Supply Chain Analysis
      • Supply Side Participants and their Roles
        • Producers
        • Mid-Level Participants (Traders/ Agents/ Brokers)
        • Wholesalers and Distributors
      • Value Added and Value Created at Node in the Supply Chain
      • List of Raw Material Suppliers
      • List of Existing and Potential Buyer’s
    • Investment Feasibility Matrix
    • Value Chain Analysis
      • Profit Margin Analysis
      • Wholesalers and Distributors
      • Retailers
    • PESTLE and Porter’s Analysis
    • Regulatory Landscape
      • By Key Regions
      • By Key Countries
    • Regional Parent Market Outlook
    • Production and Consumption Statistics
    • Import and Export Statistics
  4. Global Market Analysis 2020 to 2024 and Forecast, 2025 to 2035
    • Historical Market Size Value (USD Billion) & Volume ( metric tons) Analysis, 2020 to 2024
    • Current and Future Market Size Value (USD Billion) & Volume ( metric tons) Projections, 2025 to 2035
      • Y-o-Y Growth Trend Analysis
      • Absolute $ Opportunity Analysis
  5. Global Market Pricing Analysis 2020 to 2024 and Forecast 2025 to 2035
  6. Global Market Analysis 2020 to 2024 and Forecast 2025 to 2035, By Product Type
    • Introduction / Key Findings
    • Historical Market Size Value (USD Billion) & Volume ( metric tons) Analysis By Product Type, 2020 to 2024
    • Current and Future Market Size Value (USD Billion) & Volume ( metric tons) Analysis and Forecast By Product Type, 2025 to 2035
      • Compound feed
      • Fodder
      • Forage
      • Oilseed meals
      • Animal-by-product meals
    • Y-o-Y Growth Trend Analysis By Product Type, 2020 to 2024
    • Absolute $ Opportunity Analysis By Product Type, 2025 to 2035
  7. Global Market Analysis 2020 to 2024 and Forecast 2025 to 2035, By Source
    • Introduction / Key Findings
    • Historical Market Size Value (USD Billion) & Volume ( metric tons) Analysis By Source, 2020 to 2024
    • Current and Future Market Size Value (USD Billion) & Volume ( metric tons) Analysis and Forecast By Source, 2025 to 2035
      • Animal-based Protein
      • Plant-based Protein
    • Y-o-Y Growth Trend Analysis By Source, 2020 to 2024
    • Absolute $ Opportunity Analysis By Source, 2025 to 2035
  8. Global Market Analysis 2020 to 2024 and Forecast 2025 to 2035, By Application
    • Introduction / Key Findings
    • Historical Market Size Value (USD Billion) & Volume ( metric tons) Analysis By Application, 2020 to 2024
    • Current and Future Market Size Value (USD Billion) & Volume ( metric tons) Analysis and Forecast By Application, 2025 to 2035
      • Poultry
      • Ruminants
      • Swine
      • Aquatic Animals
      • Other Animals (Pet Animals, Birds, and Reptiles)
      • Research and biotech
      • Biocatalysts
    • Y-o-Y Growth Trend Analysis By Application, 2020 to 2024
    • Absolute $ Opportunity Analysis By Application, 2025 to 2035
  9. Global Market Analysis 2020 to 2024 and Forecast 2025 to 2035, By Region
    • Introduction
    • Historical Market Size Value (USD Billion) & Volume ( metric tons) Analysis By Region, 2020 to 2024
    • Current Market Size Value (USD Billion) & Volume ( metric tons) Analysis and Forecast By Region, 2025 to 2035
      • North America
      • Latin America
      • Western Europe
      • Eastern Europe
      • East Asia
      • South Asia & Pacific
      • Middle East and Africa
    • Market Attractiveness Analysis By Region
  10. North America Market Analysis 2020 to 2024 and Forecast 2025 to 2035, By Country
    • Historical Market Size Value (USD Billion) & Volume ( metric tons) Trend Analysis By Market Taxonomy, 2020 to 2024
    • Market Size Value (USD Billion) & Volume ( metric tons) Forecast By Market Taxonomy, 2025 to 2035
      • By Country
        • U.S.
        • Canada
        • Mexico
      • By Product Type
      • By Source
      • By Application
    • Market Attractiveness Analysis
      • By Country
      • By Product Type
      • By Source
      • By Application
    • Key Takeaways
  11. Latin America Market Analysis 2020 to 2024 and Forecast 2025 to 2035, By Country
    • Historical Market Size Value (USD Billion) & Volume ( metric tons) Trend Analysis By Market Taxonomy, 2020 to 2024
    • Market Size Value (USD Billion) & Volume ( metric tons) Forecast By Market Taxonomy, 2025 to 2035
      • By Country
        • Brazil
        • Argentina
        • Rest of LATAM
      • By Product Type
      • By Source
      • By Application
    • Market Attractiveness Analysis
      • By Country
      • By Product Type
      • By Source
      • By Application
    • Key Takeaways
  12. Western Europe Market Analysis 2020 to 2024 and Forecast 2025 to 2035, By Country
    • Historical Market Size Value (USD Billion) & Volume ( metric tons) Trend Analysis By Market Taxonomy, 2020 to 2024
    • Market Size Value (USD Billion) & Volume ( metric tons) Forecast By Market Taxonomy, 2025 to 2035
      • By Country
        • Germany
        • Italy
        • France
        • UK
        • Spain
        • BENELUX
        • Nordic
        • Rest of W.Europe
      • By Product Type
      • By Source
      • By Application
    • Market Attractiveness Analysis
      • By Country
      • By Product Type
      • By Source
      • By Application
    • Key Takeaways
  13. Eastern Europe Market Analysis 2020 to 2024 and Forecast 2025 to 2035, By Country
    • Historical Market Size Value (USD Billion) & Volume ( metric tons) Trend Analysis By Market Taxonomy, 2020 to 2024
    • Market Size Value (USD Billion) & Volume ( metric tons) Forecast By Market Taxonomy, 2025 to 2035
      • By Country
        • Russia
        • Hungary
        • Poland
        • Balkan & Baltics
        • Rest of E. Europe
      • By Product Type
      • By Source
      • By Application
    • Market Attractiveness Analysis
      • By Country
      • By Product Type
      • By Source
      • By Application
    • Key Takeaways
  14. East Asia Market Analysis 2020 to 2024 and Forecast 2025 to 2035, By Country
    • Historical Market Size Value (USD Billion) & Volume ( metric tons) Trend Analysis By Market Taxonomy, 2020 to 2024
    • Market Size Value (USD Billion) & Volume ( metric tons) Forecast By Market Taxonomy, 2025 to 2035
      • By Country
        • China
        • Japan
        • South Korea
      • By Product Type
      • By Source
      • By Application
    • Market Attractiveness Analysis
      • By Country
      • By Product Type
      • By Source
      • By Application
    • Key Takeaways
  15. South Asia & Pacific Market Analysis 2020 to 2024 and Forecast 2025 to 2035, By Country
    • Historical Market Size Value (USD Billion) & Volume ( metric tons) Trend Analysis By Market Taxonomy, 2020 to 2024
    • Market Size Value (USD Billion) & Volume ( metric tons) Forecast By Market Taxonomy, 2025 to 2035
      • By Country
        • India
        • Australia & New Zealand
        • ASEAN
        • Rest of SAP
      • By Product Type
      • By Source
      • By Application
    • Market Attractiveness Analysis
      • By Country
      • By Product Type
      • By Source
      • By Application
    • Key Takeaways
  16. Middle East and Africa Market Analysis 2020 to 2024 and Forecast 2025 to 2035, By Country
    • Historical Market Size Value (USD Billion) & Volume ( metric tons) Trend Analysis By Market Taxonomy, 2020 to 2024
    • Market Size Value (USD Billion) & Volume ( metric tons) Forecast By Market Taxonomy, 2025 to 2035
      • By Country
        • GCC Countries
        • Northern Africa
        • South Africa
        • Turkiye
        • Rest of MEA
      • By Product Type
      • By Source
      • By Application
    • Market Attractiveness Analysis
      • By Country
      • By Product Type
      • By Source
      • By Application
    • Key Takeaways
  17. Key Countries Market Analysis
    • U.S.
      • Pricing Analysis
      • Market Share Analysis, 2024
        • By Product Type
        • By Source
        • By Application
    • Canada
      • Pricing Analysis
      • Market Share Analysis, 2024
        • By Product Type
        • By Source
        • By Application
    • Brazil
      • Pricing Analysis
      • Market Share Analysis, 2024
        • By Product Type
        • By Source
        • By Application
    • Mexico
      • Pricing Analysis
      • Market Share Analysis, 2024
        • By Product Type
        • By Source
        • By Application
    • Argentina
      • Pricing Analysis
      • Market Share Analysis, 2024
        • By Product Type
        • By Source
        • By Application
  18. Market Structure Analysis
    • Competition Dashboard
    • Competition Benchmarking
    • Market Share Analysis of Top Players
      • By Regional
      • By Product Type
      • By Source
      • By Application
  19. Competition Analysis
    • Competition Deep Dive
      • Dupont
        • Overview
        • Product Portfolio
        • Profitability by Market Segments (Product/Age /Sales Channel/Region)
        • Sales Footprint
        • Strategy Overview
          • Marketing Strategy
          • Product Strategy
          • Channel Strategy
      • Mosaic Company
        • Overview
        • Product Portfolio
        • Profitability by Market Segments (Product/Age /Sales Channel/Region)
        • Sales Footprint
        • Strategy Overview
          • Marketing Strategy
          • Product Strategy
          • Channel Strategy
      • Burcon Nutrascience Corporation
        • Overview
        • Product Portfolio
        • Profitability by Market Segments (Product/Age /Sales Channel/Region)
        • Sales Footprint
        • Strategy Overview
          • Marketing Strategy
          • Product Strategy
          • Channel Strategy
      • ADM
        • Overview
        • Product Portfolio
        • Profitability by Market Segments (Product/Age /Sales Channel/Region)
        • Sales Footprint
        • Strategy Overview
          • Marketing Strategy
          • Product Strategy
          • Channel Strategy
      • Alltech
        • Overview
        • Product Portfolio
        • Profitability by Market Segments (Product/Age /Sales Channel/Region)
        • Sales Footprint
        • Strategy Overview
          • Marketing Strategy
          • Product Strategy
          • Channel Strategy
      • Hamlet Proteins
        • Overview
        • Product Portfolio
        • Profitability by Market Segments (Product/Age /Sales Channel/Region)
        • Sales Footprint
        • Strategy Overview
          • Marketing Strategy
          • Product Strategy
          • Channel Strategy
      • DSM
        • Overview
        • Product Portfolio
        • Profitability by Market Segments (Product/Age /Sales Channel/Region)
        • Sales Footprint
        • Strategy Overview
          • Marketing Strategy
          • Product Strategy
          • Channel Strategy
      • CHS
        • Overview
        • Product Portfolio
        • Profitability by Market Segments (Product/Age /Sales Channel/Region)
        • Sales Footprint
        • Strategy Overview
          • Marketing Strategy
          • Product Strategy
          • Channel Strategy
      • J.R. Simplot Co.
        • Overview
        • Product Portfolio
        • Profitability by Market Segments (Product/Age /Sales Channel/Region)
        • Sales Footprint
        • Strategy Overview
          • Marketing Strategy
          • Product Strategy
          • Channel Strategy
      • BRF
        • Overview
        • Product Portfolio
        • Profitability by Market Segments (Product/Age /Sales Channel/Region)
        • Sales Footprint
        • Strategy Overview
          • Marketing Strategy
          • Product Strategy
          • Channel Strategy
  20. Assumptions & Acronyms Used
  21. Research Methodology

List of Tables

  • Table 1: Global Market Value (USD Billion) Forecast by Region, 2020 to 2035
  • Table 2: Global Market Volume ( metric tons) Forecast by Region, 2020 to 2035
  • Table 3: Global Market Value (USD Billion) Forecast by Product Type, 2020 to 2035
  • Table 4: Global Market Volume ( metric tons) Forecast by Product Type, 2020 to 2035
  • Table 5: Global Market Value (USD Billion) Forecast by Source, 2020 to 2035
  • Table 6: Global Market Volume ( metric tons) Forecast by Source, 2020 to 2035
  • Table 7: Global Market Value (USD Billion) Forecast by Application, 2020 to 2035
  • Table 8: Global Market Volume ( metric tons) Forecast by Application, 2020 to 2035
  • Table 9: North America Market Value (USD Billion) Forecast by Country, 2020 to 2035
  • Table 10: North America Market Volume ( metric tons) Forecast by Country, 2020 to 2035
  • Table 11: North America Market Value (USD Billion) Forecast by Product Type, 2020 to 2035
  • Table 12: North America Market Volume ( metric tons) Forecast by Product Type, 2020 to 2035
  • Table 13: North America Market Value (USD Billion) Forecast by Source, 2020 to 2035
  • Table 14: North America Market Volume ( metric tons) Forecast by Source, 2020 to 2035
  • Table 15: North America Market Value (USD Billion) Forecast by Application, 2020 to 2035
  • Table 16: North America Market Volume ( metric tons) Forecast by Application, 2020 to 2035
  • Table 17: Latin America Market Value (USD Billion) Forecast by Country, 2020 to 2035
  • Table 18: Latin America Market Volume ( metric tons) Forecast by Country, 2020 to 2035
  • Table 19: Latin America Market Value (USD Billion) Forecast by Product Type, 2020 to 2035
  • Table 20: Latin America Market Volume ( metric tons) Forecast by Product Type, 2020 to 2035
  • Table 21: Latin America Market Value (USD Billion) Forecast by Source, 2020 to 2035
  • Table 22: Latin America Market Volume ( metric tons) Forecast by Source, 2020 to 2035
  • Table 23: Latin America Market Value (USD Billion) Forecast by Application, 2020 to 2035
  • Table 24: Latin America Market Volume ( metric tons) Forecast by Application, 2020 to 2035
  • Table 25: Western Europe Market Value (USD Billion) Forecast by Country, 2020 to 2035
  • Table 26: Western Europe Market Volume ( metric tons) Forecast by Country, 2020 to 2035
  • Table 27: Western Europe Market Value (USD Billion) Forecast by Product Type, 2020 to 2035
  • Table 28: Western Europe Market Volume ( metric tons) Forecast by Product Type, 2020 to 2035
  • Table 29: Western Europe Market Value (USD Billion) Forecast by Source, 2020 to 2035
  • Table 30: Western Europe Market Volume ( metric tons) Forecast by Source, 2020 to 2035
  • Table 31: Western Europe Market Value (USD Billion) Forecast by Application, 2020 to 2035
  • Table 32: Western Europe Market Volume ( metric tons) Forecast by Application, 2020 to 2035
  • Table 33: Eastern Europe Market Value (USD Billion) Forecast by Country, 2020 to 2035
  • Table 34: Eastern Europe Market Volume ( metric tons) Forecast by Country, 2020 to 2035
  • Table 35: Eastern Europe Market Value (USD Billion) Forecast by Product Type, 2020 to 2035
  • Table 36: Eastern Europe Market Volume ( metric tons) Forecast by Product Type, 2020 to 2035
  • Table 37: Eastern Europe Market Value (USD Billion) Forecast by Source, 2020 to 2035
  • Table 38: Eastern Europe Market Volume ( metric tons) Forecast by Source, 2020 to 2035
  • Table 39: Eastern Europe Market Value (USD Billion) Forecast by Application, 2020 to 2035
  • Table 40: Eastern Europe Market Volume ( metric tons) Forecast by Application, 2020 to 2035
  • Table 41: East Asia Market Value (USD Billion) Forecast by Country, 2020 to 2035
  • Table 42: East Asia Market Volume ( metric tons) Forecast by Country, 2020 to 2035
  • Table 43: East Asia Market Value (USD Billion) Forecast by Product Type, 2020 to 2035
  • Table 44: East Asia Market Volume ( metric tons) Forecast by Product Type, 2020 to 2035
  • Table 45: East Asia Market Value (USD Billion) Forecast by Source, 2020 to 2035
  • Table 46: East Asia Market Volume ( metric tons) Forecast by Source, 2020 to 2035
  • Table 47: East Asia Market Value (USD Billion) Forecast by Application, 2020 to 2035
  • Table 48: East Asia Market Volume ( metric tons) Forecast by Application, 2020 to 2035
  • Table 49: South Asia & Pacific Market Value (USD Billion) Forecast by Country, 2020 to 2035
  • Table 50: South Asia & Pacific Market Volume ( metric tons) Forecast by Country, 2020 to 2035
  • Table 51: South Asia & Pacific Market Value (USD Billion) Forecast by Product Type, 2020 to 2035
  • Table 52: South Asia & Pacific Market Volume ( metric tons) Forecast by Product Type, 2020 to 2035
  • Table 53: South Asia & Pacific Market Value (USD Billion) Forecast by Source, 2020 to 2035
  • Table 54: South Asia & Pacific Market Volume ( metric tons) Forecast by Source, 2020 to 2035
  • Table 55: South Asia & Pacific Market Value (USD Billion) Forecast by Application, 2020 to 2035
  • Table 56: South Asia & Pacific Market Volume ( metric tons) Forecast by Application, 2020 to 2035
  • Table 57: Middle East and Africa Market Value (USD Billion) Forecast by Country, 2020 to 2035
  • Table 58: Middle East and Africa Market Volume ( metric tons) Forecast by Country, 2020 to 2035
  • Table 59: Middle East and Africa Market Value (USD Billion) Forecast by Product Type, 2020 to 2035
  • Table 60: Middle East and Africa Market Volume ( metric tons) Forecast by Product Type, 2020 to 2035
  • Table 61: Middle East and Africa Market Value (USD Billion) Forecast by Source, 2020 to 2035
  • Table 62: Middle East and Africa Market Volume ( metric tons) Forecast by Source, 2020 to 2035
  • Table 63: Middle East and Africa Market Value (USD Billion) Forecast by Application, 2020 to 2035
  • Table 64: Middle East and Africa Market Volume ( metric tons) Forecast by Application, 2020 to 2035

List of Figures

  • Figure 1: Global Market Volume ( metric tons) Forecast 2020 to 2035
  • Figure 2: Global Market Pricing Analysis
  • Figure 3: Global Market Value (USD Billion) Forecast 2020 to 2035
  • Figure 4: Global Market Value Share and BPS Analysis by Product Type, 2025 and 2035
  • Figure 5: Global Market Y-o-Y Growth Comparison by Product Type, 2025 to 2035
  • Figure 6: Global Market Attractiveness Analysis by Product Type
  • Figure 7: Global Market Value Share and BPS Analysis by Source, 2025 and 2035
  • Figure 8: Global Market Y-o-Y Growth Comparison by Source, 2025 to 2035
  • Figure 9: Global Market Attractiveness Analysis by Source
  • Figure 10: Global Market Value Share and BPS Analysis by Application, 2025 and 2035
  • Figure 11: Global Market Y-o-Y Growth Comparison by Application, 2025 to 2035
  • Figure 12: Global Market Attractiveness Analysis by Application
  • Figure 13: Global Market Value (USD Billion) Share and BPS Analysis by Region, 2025 and 2035
  • Figure 14: Global Market Y-o-Y Growth Comparison by Region, 2025 to 2035
  • Figure 15: Global Market Attractiveness Analysis by Region
  • Figure 16: North America Market Incremental $ Opportunity, 2025 to 2035
  • Figure 17: Latin America Market Incremental $ Opportunity, 2025 to 2035
  • Figure 18: Western Europe Market Incremental $ Opportunity, 2025 to 2035
  • Figure 19: Eastern Europe Market Incremental $ Opportunity, 2025 to 2035
  • Figure 20: East Asia Market Incremental $ Opportunity, 2025 to 2035
  • Figure 21: South Asia & Pacific Market Incremental $ Opportunity, 2025 to 2035
  • Figure 22: Middle East and Africa Market Incremental $ Opportunity, 2025 to 2035
  • Figure 23: North America Market Value Share and BPS Analysis by Country, 2025 and 2035
  • Figure 24: North America Market Value Share and BPS Analysis by Product Type, 2025 and 2035
  • Figure 25: North America Market Y-o-Y Growth Comparison by Product Type, 2025 to 2035
  • Figure 26: North America Market Attractiveness Analysis by Product Type
  • Figure 27: North America Market Value Share and BPS Analysis by Source, 2025 and 2035
  • Figure 28: North America Market Y-o-Y Growth Comparison by Source, 2025 to 2035
  • Figure 29: North America Market Attractiveness Analysis by Source
  • Figure 30: North America Market Value Share and BPS Analysis by Application, 2025 and 2035
  • Figure 31: North America Market Y-o-Y Growth Comparison by Application, 2025 to 2035
  • Figure 32: North America Market Attractiveness Analysis by Application
  • Figure 33: Latin America Market Value Share and BPS Analysis by Country, 2025 and 2035
  • Figure 34: Latin America Market Value Share and BPS Analysis by Product Type, 2025 and 2035
  • Figure 35: Latin America Market Y-o-Y Growth Comparison by Product Type, 2025 to 2035
  • Figure 36: Latin America Market Attractiveness Analysis by Product Type
  • Figure 37: Latin America Market Value Share and BPS Analysis by Source, 2025 and 2035
  • Figure 38: Latin America Market Y-o-Y Growth Comparison by Source, 2025 to 2035
  • Figure 39: Latin America Market Attractiveness Analysis by Source
  • Figure 40: Latin America Market Value Share and BPS Analysis by Application, 2025 and 2035
  • Figure 41: Latin America Market Y-o-Y Growth Comparison by Application, 2025 to 2035
  • Figure 42: Latin America Market Attractiveness Analysis by Application
  • Figure 43: Western Europe Market Value Share and BPS Analysis by Country, 2025 and 2035
  • Figure 44: Western Europe Market Value Share and BPS Analysis by Product Type, 2025 and 2035
  • Figure 45: Western Europe Market Y-o-Y Growth Comparison by Product Type, 2025 to 2035
  • Figure 46: Western Europe Market Attractiveness Analysis by Product Type
  • Figure 47: Western Europe Market Value Share and BPS Analysis by Source, 2025 and 2035
  • Figure 48: Western Europe Market Y-o-Y Growth Comparison by Source, 2025 to 2035
  • Figure 49: Western Europe Market Attractiveness Analysis by Source
  • Figure 50: Western Europe Market Value Share and BPS Analysis by Application, 2025 and 2035
  • Figure 51: Western Europe Market Y-o-Y Growth Comparison by Application, 2025 to 2035
  • Figure 52: Western Europe Market Attractiveness Analysis by Application
  • Figure 53: Eastern Europe Market Value Share and BPS Analysis by Country, 2025 and 2035
  • Figure 54: Eastern Europe Market Value Share and BPS Analysis by Product Type, 2025 and 2035
  • Figure 55: Eastern Europe Market Y-o-Y Growth Comparison by Product Type, 2025 to 2035
  • Figure 56: Eastern Europe Market Attractiveness Analysis by Product Type
  • Figure 57: Eastern Europe Market Value Share and BPS Analysis by Source, 2025 and 2035
  • Figure 58: Eastern Europe Market Y-o-Y Growth Comparison by Source, 2025 to 2035
  • Figure 59: Eastern Europe Market Attractiveness Analysis by Source
  • Figure 60: Eastern Europe Market Value Share and BPS Analysis by Application, 2025 and 2035
  • Figure 61: Eastern Europe Market Y-o-Y Growth Comparison by Application, 2025 to 2035
  • Figure 62: Eastern Europe Market Attractiveness Analysis by Application
  • Figure 63: East Asia Market Value Share and BPS Analysis by Country, 2025 and 2035
  • Figure 64: East Asia Market Value Share and BPS Analysis by Product Type, 2025 and 2035
  • Figure 65: East Asia Market Y-o-Y Growth Comparison by Product Type, 2025 to 2035
  • Figure 66: East Asia Market Attractiveness Analysis by Product Type
  • Figure 67: East Asia Market Value Share and BPS Analysis by Source, 2025 and 2035
  • Figure 68: East Asia Market Y-o-Y Growth Comparison by Source, 2025 to 2035
  • Figure 69: East Asia Market Attractiveness Analysis by Source
  • Figure 70: East Asia Market Value Share and BPS Analysis by Application, 2025 and 2035
  • Figure 71: East Asia Market Y-o-Y Growth Comparison by Application, 2025 to 2035
  • Figure 72: East Asia Market Attractiveness Analysis by Application
  • Figure 73: South Asia & Pacific Market Value Share and BPS Analysis by Country, 2025 and 2035
  • Figure 74: South Asia & Pacific Market Value Share and BPS Analysis by Product Type, 2025 and 2035
  • Figure 75: South Asia & Pacific Market Y-o-Y Growth Comparison by Product Type, 2025 to 2035
  • Figure 76: South Asia & Pacific Market Attractiveness Analysis by Product Type
  • Figure 77: South Asia & Pacific Market Value Share and BPS Analysis by Source, 2025 and 2035
  • Figure 78: South Asia & Pacific Market Y-o-Y Growth Comparison by Source, 2025 to 2035
  • Figure 79: South Asia & Pacific Market Attractiveness Analysis by Source
  • Figure 80: South Asia & Pacific Market Value Share and BPS Analysis by Application, 2025 and 2035
  • Figure 81: South Asia & Pacific Market Y-o-Y Growth Comparison by Application, 2025 to 2035
  • Figure 82: South Asia & Pacific Market Attractiveness Analysis by Application
  • Figure 83: Middle East and Africa Market Value Share and BPS Analysis by Country, 2025 and 2035
  • Figure 84: Middle East and Africa Market Value Share and BPS Analysis by Product Type, 2025 and 2035
  • Figure 85: Middle East and Africa Market Y-o-Y Growth Comparison by Product Type, 2025 to 2035
  • Figure 86: Middle East and Africa Market Attractiveness Analysis by Product Type
  • Figure 87: Middle East and Africa Market Value Share and BPS Analysis by Source, 2025 and 2035
  • Figure 88: Middle East and Africa Market Y-o-Y Growth Comparison by Source, 2025 to 2035
  • Figure 89: Middle East and Africa Market Attractiveness Analysis by Source
  • Figure 90: Middle East and Africa Market Value Share and BPS Analysis by Application, 2025 and 2035
  • Figure 91: Middle East and Africa Market Y-o-Y Growth Comparison by Application, 2025 to 2035
  • Figure 92: Middle East and Africa Market Attractiveness Analysis by Application
  • Figure 93: Global Market - Tier Structure Analysis
  • Figure 94: Global Market - Company Share Analysis

Frequently Asked Questions

What is the estimated market size of the animal feed ingredient industry in 2025?

The industry is valued at USD 42.7 billion in 2025.

What is the projected industry size of the animal feed ingredient industry by 2035?

It is forecasted to reach USD 60.2 billion by 2035.

What is the expected CAGR for the animal feed ingredient industry between 2025 and 2035?

The industry is anticipated to grow at a CAGR of 3.5% during this period.

Which segment is expected to lead the animal feed ingredient market in 2035?

Plant-based Protein are projected to lead the market with a 75% share in 2035.

Which region is expected to witness the highest growth in the animal feed ingredient market?

Asia Pacific particularly India, is expected to be the key growth region with a projected growth rate of 4.5%.

Explore Similar Insights

Future Market Insights

Animal Feed Ingredients Market