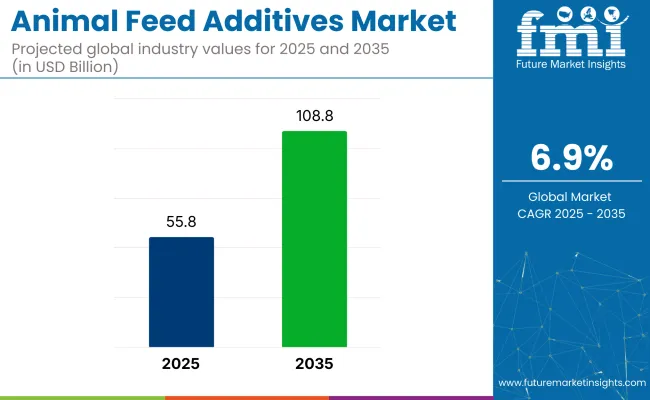
The global animal feed additives market has been valued at USD 55.8 billion for 2025, and a valuation of USD 108.8 billion is projected for 2035, implying that overall revenue is forecast to almost double within a few years at a CAGR of 6.9%. This momentum is being underpinned by rising consumption of meat, dairy, eggs, and farmed seafood as populations expand and household incomes increase, particularly across Asia and Latin America.
Commercial producers are being pressed to lift feed conversion efficiency and reduce animal mortality, so greater volumes of vitamins, enzymes, amino acids, and immune-modulating compounds are being incorporated into finished rations. At the same time, volatility in traditional feed-protein prices is prompting trading houses to secure forward contracts for additives that enhance nutrient utilization and offset fluctuating raw-material quality, thereby reinforcing demand consistency across poultry, swine, ruminant, and aquaculture sectors.
The market holds a significant share within its parent markets. Within the animal feed market, feed additives contribute around 10-15%, as they are crucial for improving the nutritional value and overall health of animal feed. In the broader agricultural chemicals market, the share of animal feed additives is estimated to be about 3-5%, as it represents a specialized segment within agricultural chemicals.
In the livestock industry, feed additives have a larger share, around 15-20%, due to their importance in livestock nutrition and productivity. The pet care market sees feed additives for pets accounting for 4-6%of the overall market. In the food & beverage market, the contribution of feed additives is indirect but significant, at around 2-3%, impacting the supply of animal-based food products.
Regulatory dynamics are exerting a decisive influence on market growth. The European Union, the United States, and China have each imposed stringent restrictions on antimicrobial growth promoters, shifting the industry toward probiotic microbes, postbiotic metabolites, phytogenic extracts, and acidifier blends that support gut health without contributing to antimicrobial resistance.
USDA launched an USD 8.5 million sterile screwworm fly facility in Texas, with a USD 21 million production expansion in Mexico to safeguard USA livestock from reemergent pests. Compliance with feed-safety rules framed by authorities such as the FDA, EFSA, and China’s MARA is obliging manufacturers to meet tighter mycotoxin thresholds, improve traceability, and verify additive efficacy through in-vivo research, thereby raising technological and capital barriers.
Regulations for animal feed additives are designed to ensure the safety, efficacy, and quality of additives used in animal nutrition. These frameworks vary by country but generally cover approval processes, labeling, usage limits, and safety assessments to protect animal health, consumer safety, and the environment.
The global trade in animal feed additives is expanding steadily, driven by increasing demand for livestock products and the need for enhanced animal nutrition. Trade flows are shaped by regional production capacities, regulatory environments, and evolving consumer preferences.
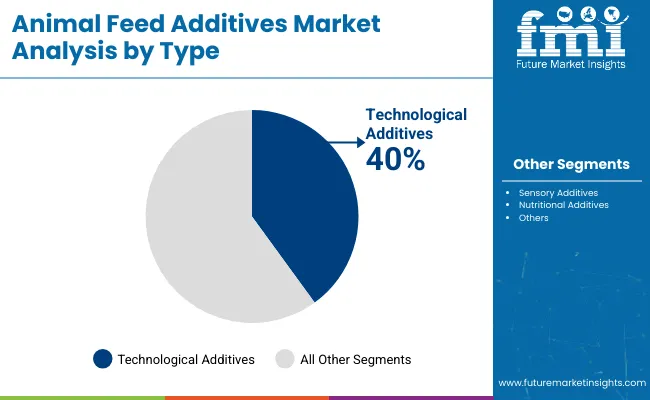
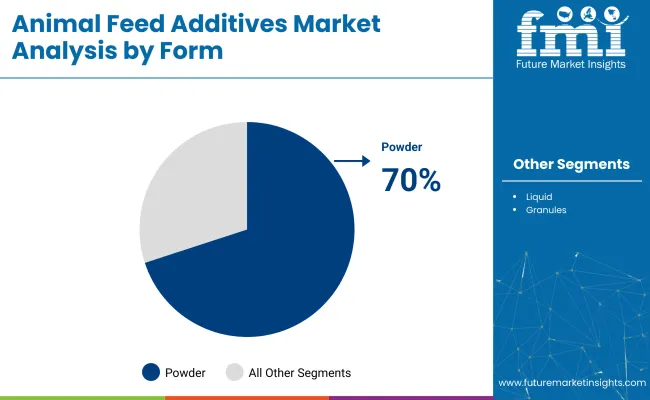
Technological additives lead the market due to their critical role in enhancing feed stability, nutrient absorption, and shelf life. Major players are focusing on advanced preservatives, emulsifiers, and mold inhibitors to meet performance and safety standards. Dry feed additives dominate in form because of their cost-effectiveness, long shelf life, and compatibility with automated feed systems, making them ideal for large-scale livestock operations.
Technological additives are expected to hold 40% of the industry share in 2025, making them the largest additive type.
Powdered feed additives are projected to account for over 70% of the share in 2025, making them the largest form category.
The market is advancing due to regulatory bans on antibiotics, prompting the rise of natural, functional additives that enhance animal health. Simultaneously, innovations in alternative proteins and precision nutrient delivery are driving efficiency and traceability.
Themarket is being significantly influenced by global regulatory reforms aimed at phasing out antibiotic growth promoters. With mounting concerns over antimicrobial resistance, authorities in the EU, USA, and China have imposed strict guidelines, pushing manufacturers to innovate with natural alternatives such as probiotics, postbiotics, phytogenic extracts, and organic acids. These clean-label, functional additives not only support gut health and immunity but also align with rising consumer demand for ethically raised and residue-free animal products.
Ongoing volatility in traditional protein ingredients such as soybean meal and fishmeal is driving the industry to explore novel inputs, including insect-based proteins, single-cell organisms, and algae-derived nutrients. To maintain nutrient bioavailability and stability, feed additive manufacturers are adopting technologies like microencapsulation, cold pelleting, and emulsion-based delivery systems.
Additionally, the integration of AI-powered feed formulation and real-time animal health monitoring is allowing for more precise nutrient targeting, improving feed conversion ratios and animal performance.
| Countries | CAGR (2025 to 2035) |
|---|---|
| USA | 3.8% |
| UK | 4.4% |
| France | 4.3% |
| China | 6.3% |
| Japan | 4.1% |
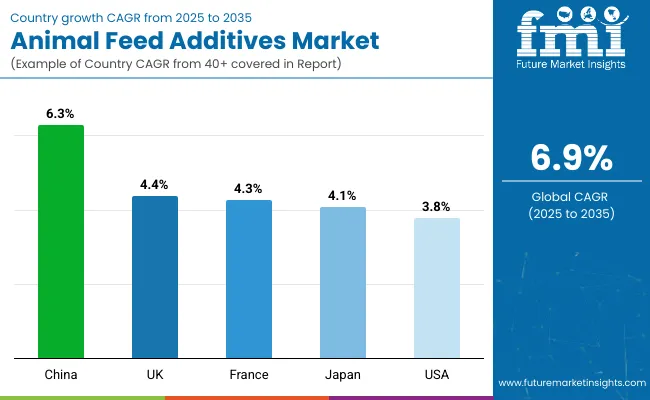
The animal feed additives industry, expected to grow at a global CAGR of 6.9% from 2025 to 2035, is experiencing varied performance across key countries. India’s momentum is driven by rapid growth in its livestock and poultry sectors, coupled with the increasing demand for high-quality feed additives.
China follows closely, with a projected 6.3% CAGR, supported by its expanding livestock industry and the rising demand for efficient feed additives to improve productivity. In contrast, developed economies such as Japan (4.1%), France (4.3%), and the United Kingdom (4.4%) are expanding at a steady 0.95-1.03x rate.
The United Kingdom sees increasing demand for functional feed additives, especially in the poultry and dairy sectors, while France focuses on sustainability and traceability in animal feed solutions. In Japan, the market is driven by specialized additives for aquaculture and poultry sectors. As the market adds over USD 350 million by 2035, both high-growth regions like India and China and steady demand from OECD countries will shape its trajectory.
The report covers detailed analysis of 40+ countries, with the top five countries shared as a reference.
The USA animal feed additives market is estimated to grow at 3.8% CAGR during the forecast period. Expansion is being supported by the country’s vast poultry, swine, and cattle inventories, where strict feed-quality mandates have been enforced by the Food and Drug Administration.
Greater consumer scrutiny over antibiotic residues has compelled processors to adopt probiotic, postbiotic, and phytogenic additives, while beef and dairy producers have been incentivized by retail programs that reward residue-free supply chains.
Volatility in grain prices has been partially offset through wider amino-acid fortification, which has improved feed conversion ratios and reduced nitrogen excretion. Digital ration-balancing software is being deployed across integrated production systems, so additive inclusion rates are being optimized in real time.
The animal feed additives market in China is estimated to grow at 6.3% CAGR during the forecast period. Growth is being propelled by the country’s rebuilding of its swine herd after African Swine Fever and by rapid urban dietary shifts favoring higher meat and aquaculture consumption.
Provincial directives have limited antibiotic growth promoters, so producers have transitioned toward enzyme complexes, organic acids, and yeast derivatives that enhance gut integrity. State grain-reserve programs have stabilized corn and soybean meal supplies, encouraging mills to lock in additive contracts that improve feed efficiency amid fluctuating raw-material quality.
Mega-feed complexes along coastal and river delta regions have installed micro-dosing systems capable of precise additive delivery, while e-commerce platforms have widened distribution to smallholders.
The UK animal feed additives market is estimated to grow at 4.4% CAGR between 2025 and 2035. Expansion is being underpinned by stringent Food Standards Agency regulations that mandate traceable, residue-free feed inputs across poultry, pig, and ruminant sectors. Retailer animal-welfare schemes have driven adoption of organic-acid blends and essential oils that support gut health without pharmacological interventions.
The nation’s protein self-sufficiency strategy has promoted rapeseed meal and domestic faba beans, intensifying the need for phytase and protease additives that unlock nutrient availability. Investment in on-farm feed milling has risen, and micro-ingredient premix stations are being installed to ensure precise dosing of vitamins, minerals, and functional compounds.
Demand for animal feed additives in Japan is estimated to grow at 4.1% CAGR from 2025 to 2035. Growth is being encouraged by high consumer expectations for premium Wagyu beef, antibiotic-free poultry, and aquaculture products, each requiring meticulously balanced rations.
Imports account for a major share of feed grains, so exchange-rate fluctuations have heightened reliance on amino-acid supplementation to reduce soybean meal volumes. Government grants under the Feed Innovation Program have financed trials of algae-based omega-3 additives that improve meat quality. Advanced pelleting systems incorporating vacuum coating are being adopted to preserve heat-labile vitamins and probiotics.
The animal feed additives market in France is estimated to grow at 4.3% CAGR during the forecast period. Expansion is being driven by the nation’s strong dairy and poultry industries, which are subject to tight veterinary-drug restrictions set by ANSES. Feed manufacturers have accelerated adoption of plant-extract and organic-acid complexes to comply with antibiotic-reduction targets.
Farm-to-fork traceability initiatives under the EGAlim law have required additive suppliers to certify origin and purity, increasing demand for clean-label solutions. The government’s protein-crop plan has boosted cultivation of peas and lupins, prompting wider use of enzyme cocktails that offset anti-nutritional factors. Renewable-energy policies have fostered biogas expansion, generating high-protein press cakes that need tailored vitamin and mineral fortification.
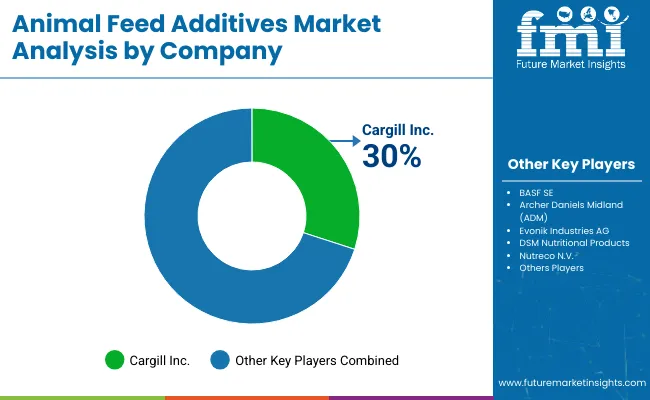
The animal feed additives market is driven by established players and innovative manufacturers focused on performance enhancement, gut health optimization, and nutrient efficiency. Key companies like Cargill Inc., BASF SE, and Archer Daniels Midland (ADM) lead with broad portfolios of amino acids, organic acids, and vitamins tailored for poultry, swine, and ruminants.
Evonik Industries AG and DSM Nutritional Products are known for cutting-edge enzyme technologies and precision-nutrition solutions that improve feed conversion and reduce emissions. Nutreco N.V., Kemin Industries, and Novus International are expanding their footprint in natural and functional additives through investments in probiotic strains and phytogenic compounds.
Emerging leaders like Alltech and Adisseo are innovating with encapsulated trace minerals and fermentation-derived bioactives that align with global antibiotic-free regulations and sustainability targets.
| Report Attributes | Details |
|---|---|
| Market Size (2025) | USD 55.8 billion |
| Projected Market Size (2035) | USD 108.8 billion |
| CAGR (2025 to 2035) | 6.9% |
| Base Year for Estimation | 2024 |
| Historical Period | 2020 to 2024 |
| Projections Period | 2025 to 2035 |
| Quantitative Units | USD billion for value and volume in tons |
| Additive Type Analyzed (Segment 1) | Technological Additives (Preservatives, Emulsifiers, And Others), Sensory Additives (Sweeteners, Lutein, And Others), Nutritional Additives. |
| Form Analyzed (Segment 2) | Powder, Granules, Liquid. |
| Regions Covered | North America, Europe, Asia Pacific, Middle East & Africa, Latin America |
| Countries Covered | United States, Canada, Germany, United Kingdom, France, Italy, Spain, China, Japan, South Korea, India, Australia, Brazil, Mexico, Argentina, Saudi Arabia, UAE, South Africa |
| Key Players | Cargill Inc., BASF SE, Archer Daniels Midland (ADM), Evonik Industries AG, DSM Nutritional Products, Nutreco N.V., Kemin Industries, Novus International, Alltech, and Adisseo . |
| Additional Attributes | Dollar sales, CAGR, segment-wise share, regional demand trends, key growth drivers, regulatory updates, competitor share, pricing trends, ingredient innovations, and preferred sales channels. |
The industry is segmented into technological additives (preservatives, emulsifiers, and others), sensory additives (sweeteners, lutein, and others), nutritional additives.
The key form include powder, granules, liquid.
Industry analysis has been carried out in key countries of North America, Latin America, Europe, Middle East and Africa, East Asia, South Asia, and Oceania
The industry is valued at USD 55.8 billion in 2025.
It is forecasted to reach USD 108.8 billion by 2035.
The industry is anticipated to grow at a CAGR of 6.9% during this period.
Powder-based forms are projected to lead the market with a 70% share in 2035.
Asia Pacific, particularly China, is expected to be the key growth region with a projected growth rate of 6.3%.


Full Research Suite comprises of:
Market outlook & trends analysis
Interviews & case studies
Strategic recommendations
Vendor profiles & capabilities analysis
5-year forecasts
8 regions and 60+ country-level data splits
Market segment data splits
12 months of continuous data updates
DELIVERED AS:
PDF EXCEL ONLINE
Analyzing Animal Feed Additives Market Share & Industry Leaders
UK Animal Feed Additives Market Trends – Growth, Demand & Forecast 2025–2035
United States Animal Feed Additives Market Report – Trends, Growth & Forecast 2025–2035
ASEAN Animal Feed Additives Market Insights – Demand, Size & Industry Trends 2025–2035
Europe Animal Feed Additives Market Insights – Size, Trends & Forecast 2025–2035
Australia Animal Feed Additives Market Analysis – Size & Industry Trends 2025–2035
Demand for Animal Feed Additives in EU Size and Share Forecast Outlook 2025 to 2035
Latin America Animal Feed Additives Market Trends – Demand, Innovations & Forecast 2025–2035
Animal Healthcare Packaging Market Size and Share Forecast Outlook 2025 to 2035
Animal External Fixation Market Size and Share Forecast Outlook 2025 to 2035
Animal Antibiotics and Antimicrobials Market Size and Share Forecast Outlook 2025 to 2035
Animal Auto-Immune Disease Diagnostics Market Size and Share Forecast Outlook 2025 to 2035
Animal Disinfectants Market Size and Share Forecast Outlook 2025 to 2035
Animal Health Software Market Size and Share Forecast Outlook 2025 to 2035
Animal Antimicrobials and Antibiotics Market Size and Share Forecast Outlook 2025 to 2035
Animal Sedative Market Size and Share Forecast Outlook 2025 to 2035
Animal Genetics Market Size and Share Forecast Outlook 2025 to 2035
Animal Peptides Market Size and Share Forecast Outlook 2025 to 2035
Animal Immunoassay Kits Market Analysis - Size, Share, and Forecast Outlook 2025 to 2035
Animal Gastroesophageal Reflux Disease Market Size and Share Forecast Outlook 2025 to 2035

Thank you!
You will receive an email from our Business Development Manager. Please be sure to check your SPAM/JUNK folder too.
Chat With
MaRIA