Analog to Digital Converter Market Outlook (2023 to 2033)

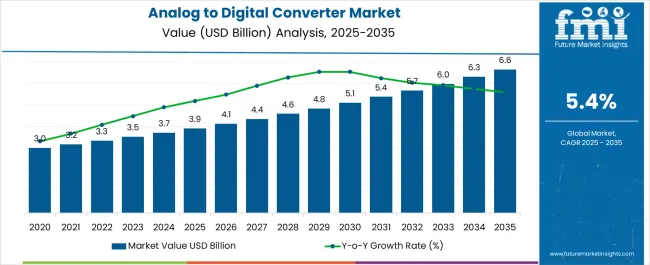
The analog to digital converter market is anticipated to flourish at an average CAGR of 5.7% between 2023 and 2033. The market is expected to hold a market share of US$ 6.13 billion by 2033 while the market is likely to reach a value of US$ 3.51 billion in 2023.

The global analog to digital converter market is poised to scale great heights in this decade. As the name suggests, analog to digital converters (ADCs) help transform analog inputs such as light picked up by a camera or a soundwave by a microphone into a digital signal.

ADCs have been gaining significant ground, being utilized across several industries, including instrumentation, sensory-based systems, measurement and control systems, and communication systems over the years.

The usage of ADCs is phenomenally rising as industries strive toward streamlining their operations through digitization and achieving efficiency. This has provided all industries with a massive productive edge.

The volume of global trade of several goods and services is rising exponentially, as the world becomes increasingly interconnected. Against this backdrop, industries have been compelled to augment their productive capabilities, thus increasing adoption of ADCs. Based on these trends, the global analog to digital converter market is slated to enjoy a steep upward curve.

Attributes Details
Analog to Digital Converter Market CAGR (2023 to 2033) 5.7%
Analog to Digital Converter Market Size (2023) US$ 3.51 billion
Analog to Digital Converter Market Size (2033) US$ 6.13 billion

Don't pay for what you don't need

Customize your report by selecting specific countries or regions and save 30%!

What Drivers Underpin the Analog to Digital Converter Market Growth?

Rising Need for Data Acquisition across Key Industries to Widen Adoption

End-use industries are investing funds in collating and assimilating market data that is easily accessible and can be stored conveniently as digitization progresses. Therefore, numerous data acquisition tools and approaches are relied upon.

At the core of all data acquisition systems is an Analog to Digital Converter (ADC). As the name implies, this chip takes data from the environment and converts it to discrete levels that can be interpreted by a processor. These discrete levels correspond to the small detectable change in the signal being measured.

Analog-to-digital converters (ADCs) and digital-to-analog converters (DACs) play an important role in the design of data acquisition systems. ADCs are used to convert analog signals like the output from a temperature transducer, a radio receiver or a video camera into digital signals for processing. Conversely, DACs are used to convert digital signals back to analog signals. Convenience, cost, power dissipation, resolution, speed, supply voltage and ease of use drive the selection of a particular ADC/DAC.

What are the Key Challenges Posed to Analog to Digital Converters’ Adoption?

Structural Complexities while Collecting Data may Discourage Adoption

A key challenge associated with using analog to digital converters is their structural complexities. With respect to flash analog to digital converters, as the use of comparators increases, circuit complexity also rises. Furthermore, converting non-periodic signals using pipeline ADCs can be difficult as it typically runs at a periodic rate.

Pipeline ADCs experience frequent latency of input signals, causing non-linearities in various parameters. Over and above these challenges, analog to digital converters are expensive, compelling enterprises to spend a significant portion of their budgets on their installation and security.

Sudip Saha
Sudip Saha

Principal Consultant

Talk to Analyst

Find your sweet spots for generating winning opportunities in this market.

Country-wise Insights

Countries Revenue Share % (2022)
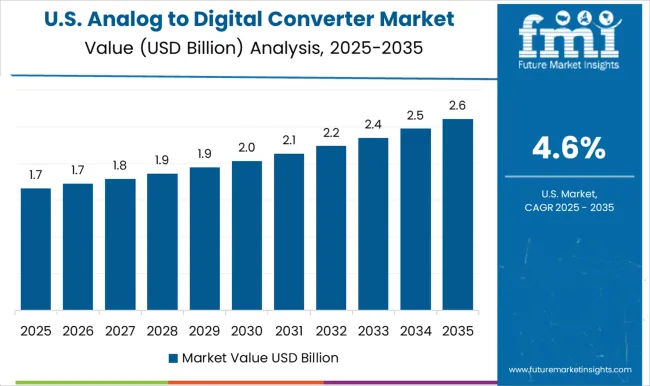
The United States 20.4%
Germany 8.1%
Japan 6.3%
Australia 3.1%
North America 30.4%
Europe 22.9%
Countries CAGR % (2023 to 2033)
China 4.3%
India 7.6%
The United Kingdom 3.2%

How Analog to Digital Converters Sales is Likely to Fare across North America?

Extensive Deployment Strengthened Military Capabilities

According to Future Market Insights, the analog to digital converter market in North America held a revenue share worth 30.4% in 2022. With extensive digitization of key industries, combined with the deployment of advanced connectivity technologies, the market is set to take a turn for the better across the region in the coming decade. Perhaps the most extensive application of this technology is in the military sector.

Warfare technologies have evolved tremendously, since the dawn of the 21st century. From the deployment of unmanned aerial vehicles and drones for surveillance or combat to stealth aircraft or heat-guided missiles, military technology has come a long way. The introduction of analog to digital converters is yet another addition to this list. With respect to is popularity in North America, there are widespread applications of this technology.

Modern military radar, communication, and surveillance systems are typically leveraging ultrafast analog-to-digital converters to digitize received signals. They are critical in military applications such as military software-defined radio, radar, and electronic counter warfare (ECW) which require high sampling rates and bandwidths.

How is Asia Pacific Contributing to the Growth of the Market for Analog to Digital Converters?

Applications are Likely to Abound for Medical Applications in the Long-Run

Asia Pacific’s market is expected to generate substantial growth prospects for analog to digital converters, especially in the healthcare domain. This is especially prominent for digital radiography, CT, PET, MRI, and ultrasonography among other applications. Future Market Insights expect the Asia Pacific analog to digital converters market to experience a 6.3% CAGR from 20223 to 2033.

Given the increasing scope of medical tourism across the region, healthcare facilities across countries such as India, Japan, and China, are overhauling their existing medical infrastructure. Stakeholders are attempting to incorporate digitization, big data analytics, Industry 4.0, and IoT to make healthcare systems efficient. The introduction of analog to digital conversion is another feather in the cap for the Asia Pacific market.
Does Europe Generate Attractive Growth Prospects for Analog to Digital Converters?

A Flourishing Automotive Industry to Encourage Manufacturers to Establish Base

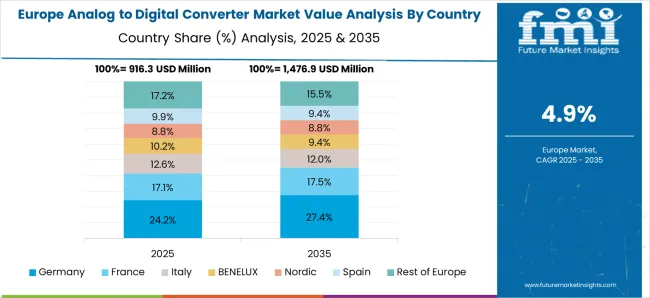
Europe’s analog to digital converter market held market revenue worth 21.1% in 2022, according to Future Market Insights. The growth of the region is typically attributed to a flourishing automotive industry in recent years. Sensor applications requiring data converters range from temperature sensors identifying different engine statuses to radar/LIDAR enabling automotive driver assistance systems (ADAS).

A few other applications involving data converters include wireless transceivers for communicating with other vehicles or with a fixed network. The data converter IP (analog-to-digital and digital-to-analog) provides an interface for a multitude of analog sensors to automotive system-on-chips (SoCs).

Numerous regional players are active in the analog to digital converter landscape for the automotive industry in Europe. Dewesoft, for instance, is a prominent manufacturer, offering versatile and easy-to-use data acquisition systems. Its vehicle testing portfolio includes ADAS testing; break testing, break noise testing, combustion analysis and e-mobility among others.

Category Analysis

Category By Product Type
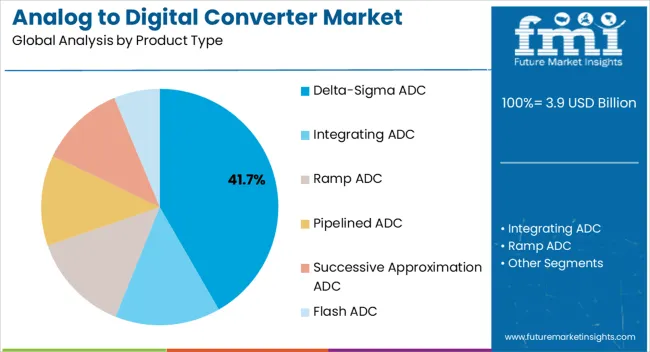
Leading Segment Delta Sigma ADC
Market Share% (2022) 19.5%
Category By Application Type
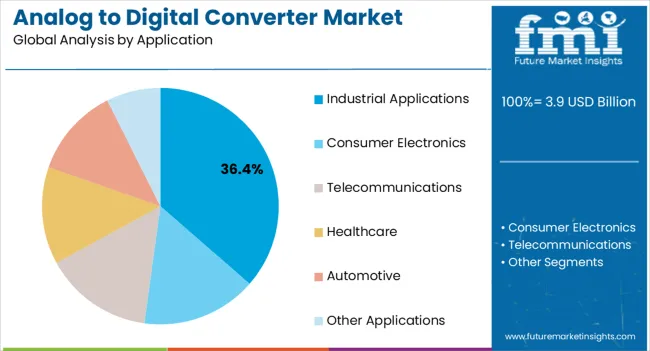
Leading Segment Telecommunications
Market Share% (2022) 20.3%

By Product, which Analog to Digital Converters are most Preferred?

Delta Sigma ADC is to Account for a Significant Share of the Global ADC Market

Among all types, delta sigma ADC held a revenue share of 19.5% in 2022. Growth is primarily being driven by extensive applications across 4G and 5G devices for providing superior data and services quality. The segment accounted for one-third market share in 2019.

Demand for fast data processing, accurate decision intelligence and large communication channels bandwidth have acquired critical precedence, as the industrial internet of things (IIoT) gradually takes over the entire manufacturing process. Functional ADCs help achieve all these things by providing optimum speed, size, power, and resolution across machines, thus accelerating processes.

Which Application Area Accounts for Maximum Deployment of Analog to Digital Converters?

Telecommunications to Remain Principal Application Area, Usage to Accelerate in Automotive Sector

ADCs are experiencing immense fertile growth across the telecommunications sector. As the world hurtles toward rapid inter-connectedness, people demand fast andefficient means of connectivity. Further, the advent of artificial intelligence has spurred deployment of 4G/5G data transmission systems, which extensively utilize data converters. The segment held a market share of 20.3% in 2022.

The automotive industry is up-scaling the adoption of ADCs to ensure the functionality, reliability and safety of a variety of functions. A key application has been recorded in the automotive driver assistance systems (ADAS) and in wireless trans-receivers for communicating with other vehicles. Additionally, ADCs are also used in child seat detection, remote keyless entry, immobilizers, passive keyless entry and tire pressure monitoring systems. As per FMI, the automotive segment is poised to expand at a CAGR of 6.2% until 2033.

Get the data you need at a Fraction of the cost

Personalize your report by choosing insights you need
and save 40%!

The Start-Up Ecosystem: How Key Players are Opening Frontiers for Future Growth?

Manufacturers are adopting various marketing strategies such as new product launches, geographical expansion, mergers and acquisitions, partnerships, and collaboration to identify the interest of potential buyers and create a large customer base. For instance,

  • On November 1, 2002, Renesas Electronics Corporation, a semiconductor manufacturer in Japan with its headquarters in Tokyo, was established. Renesas recently announced collaboration with Mahindra & Mahindra Ltd. to deliver system-level design and developments that utilize use of Renesas RH850/E2x microcontroller (MCU), which is primarily geared to fulfil the needs of powertrain systems.
  • In 2006, NXP Semiconductors N.V., an American-Dutch semiconductor manufacturer and designer with headquarters in Eindhoven, the Netherlands, was established. They provide an ADC that allows for four simultaneous conversions controlled by two separate sequences.

Recent Developments:

  • In August 2020, Analog Instruments Inc. collaborated with Intel Corporation to create a flexible radio platform for addressing 5G network design challenges, enabling customers to scale their 5G networks quickly and economically. The technology is going to combine ADI’s radio-frequency trans-receivers with the latter’s Intel Arria 10 Field Programmable Gate Arrays which might provide access to a new set of design tools for creating optimized solutions.
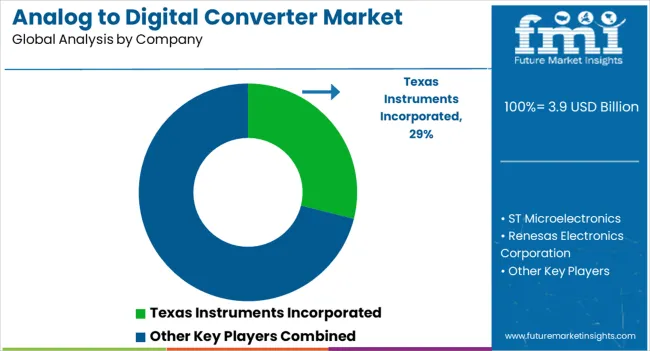
  • Texas Instruments Incorporated, the second market leader, offers a range of ADCs such as the ADS8167 16-bit, 500 kSPS, buffer and direct sensor interface, the ADS8924B 16-Bit, 250 kSPS buffer internal LDP and enhanced SPI interface and the ADS8900B 20-Bit 1-MSPS SAR ADC interfaces to name a few of them.
  • In July 2020, Maxim Integrated introduced the MAXM86146 Dual-Photodetector Optical Sensor Solution which is integrated with highly advanced algorithms for monitoring heart rate and oxygen saturation in its health and fitness product portfolio. This contraption offers designers of advanced wearable products to achieve a 45% thinner optical design.
  • Recently, in July 2020, Asahi Microdevices developed an ultra-low power intelligent system wakeup ADC integrated with Acoustic Activity Analyzer codenamed AK5706. It is a high-performance 24-bit stereo A/D Converter, ideal for applications such as smart speakers, voice-assisted wearable devices and connected security devices.
  • Texas Instruments Incorporated has introduced the high speed ADCs, precision ADCs, and Isolated ADCs. The product comes with SPI, I2C, parallel, and JESD204 interface.
  • Mouser Electronics has introduced the STMicroelectronics ISOSD61Sigma-Delta Modulators and 12-bit analog to digital converter.

Key Players Profiled in the Analog to Digital Converter Market

  • Texas Instruments Incorporated
  • ST Microelectronics
  • Renesas Electronics Corporation
  • ON Semiconductor Corporation
  • Maxim Integrated, Inc.
  • Asahi Kasei Microdevices Corporation
  • Rohm Co, Ltd.
  • Cirrus Logic Inc.
  • Microchip Technology Inc.
  • Analog Devices Inc.
  • Diligent Inc.
  • National Instruments
  • Sony Corporation
  • Adafruit Industries

Key Segments Covered

By Product Type:

  • Delta-Sigma ADC
  • Integrating ADC
  • Ramp ADC
  • Pipelined ADC
  • Successive Approximation ADC
  • Flash ADC

By Application:

  • Industrial Applications
  • Consumer Electronics
  • Telecommunications
  • Healthcare
  • Automotive
  • Other Applications

Key Regions Covered:

  • North America
    • The United States
    • Canada
  • Latin America
    • Brazil
    • Mexico
    • Rest of Latin America
  • Europe
    • Germany
    • The United Kingdom
    • France
    • Spain
    • Russia
    • Rest of Europe
  • Japan
  • Asia Pacific Excluding Japan
    • China
    • India
    • Malaysia
    • Singapore
    • Australia
    • Rest of Asia Pacific Excluding Japan (APEJ)
  • The Middle East and Africa
    • GCC Countries
    • Israel
    • South Africa
    • The Middle East and Africa (MEA)

Frequently Asked Questions

What is the Analog to Digital Converter Market Size in 2023?

The market is valued at US$ 3.5 billion in 2023.

Which are the Key Market Players?

ST Microelectronics, and Rohm Co, Ltd. are the key market players.

How Big will the Analog to Digital Converter Market by 2033?

The market is predicted to reach US$ 6.1 billion in 2033.

What is the Growth Forecast for the Market?

The market is expected to witness a CAGR of 5.7% through 2033.

Which is the Dominant Segment by Product?

Delta Sigma ADC segment is likely to remain preferred through 2033.

Table of Content
1. Executive Summary
    1.1. Global Market Outlook
    1.2. Demand-side Trends
    1.3. Supply-side Trends
    1.4. Technology Roadmap Analysis
    1.5. Analysis and Recommendations
2. Market Overview
    2.1. Market Coverage / Taxonomy
    2.2. Market Definition / Scope / Limitations
3. Market Background
    3.1. Market Dynamics
        3.1.1. Drivers
        3.1.2. Restraints
        3.1.3. Opportunity
        3.1.4. Trends
    3.2. Scenario Forecast
        3.2.1. Demand in Optimistic Scenario
        3.2.2. Demand in Likely Scenario
        3.2.3. Demand in Conservative Scenario
    3.3. Opportunity Map Analysis
    3.4. Product Life Cycle Analysis
    3.5. Supply Chain Analysis
        3.5.1. Supply Side Participants and their Roles
            3.5.1.1. Producers
            3.5.1.2. Mid-Level Participants (Traders/ Agents/ Brokers)
            3.5.1.3. Wholesalers and Distributors
        3.5.2. Value Added and Value Created at Node in the Supply Chain
        3.5.3. List of Raw Material Suppliers
        3.5.4. List of Existing and Potential Buyer’s
    3.6. Investment Feasibility Matrix
    3.7. Value Chain Analysis
        3.7.1. Profit Margin Analysis
        3.7.2. Wholesalers and Distributors
        3.7.3. Retailers
    3.8. PESTLE and Porter’s Analysis
    3.9. Regulatory Landscape
        3.9.1. By Key Regions
        3.9.2. By Key Countries
    3.10. Regional Parent Market Outlook
    3.11. Production and Consumption Statistics
    3.12. Import and Export Statistics
4. Global Market Analysis 2018 to 2022 and Forecast, 2023 to 2033
    4.1. Historical Market Size Value (US$ Million) & Volume (Units) Analysis, 2018 to 2022
    4.2. Current and Future Market Size Value (US$ Million) & Volume (Units) Projections, 2023 to 2033
        4.2.1. Y-o-Y Growth Trend Analysis
        4.2.2. Absolute $ Opportunity Analysis
5. Global Market Analysis 2018 to 2022 and Forecast 2023 to 2033, By Product Type
    5.1. Introduction / Key Findings
    5.2. Historical Market Size Value (US$ Million) & Volume (Units) Analysis By Product Type, 2018 to 2022
    5.3. Current and Future Market Size Value (US$ Million) & Volume (Units) Analysis and Forecast By Product Type, 2023 to 2033
        5.3.1. Delta-Sigma ADC
        5.3.2. Integrating ADC
        5.3.3. Ramp ADC
        5.3.4. Pipelined ADC
        5.3.5. Successive Approximation ADC
        5.3.6. Flash ADC
    5.4. Y-o-Y Growth Trend Analysis By Product Type, 2018 to 2022
    5.5. Absolute $ Opportunity Analysis By Product Type, 2023 to 2033
6. Global Market Analysis 2018 to 2022 and Forecast 2023 to 2033, By Application
    6.1. Introduction / Key Findings
    6.2. Historical Market Size Value (US$ Million) & Volume (Units) Analysis By Application, 2018 to 2022
    6.3. Current and Future Market Size Value (US$ Million) & Volume (Units) Analysis and Forecast By Application, 2023 to 2033
        6.3.1. Industrial Applications
        6.3.2. Consumer Electronics
        6.3.3. Telecommunications
        6.3.4. Healthcare
        6.3.5. Automotive
        6.3.6. Others
    6.4. Y-o-Y Growth Trend Analysis By Application, 2018 to 2022
    6.5. Absolute $ Opportunity Analysis By Application, 2023 to 2033
7. Global Market Analysis 2018 to 2022 and Forecast 2023 to 2033, By Region
    7.1. Introduction
    7.2. Historical Market Size Value (US$ Million) & Volume (Units) Analysis By Region, 2018 to 2022
    7.3. Current Market Size Value (US$ Million) & Volume (Units) Analysis and Forecast By Region, 2023 to 2033
        7.3.1. North America
        7.3.2. Latin America
        7.3.3. Western Europe
        7.3.4. Eastern Europe
        7.3.5. South Asia and Pacific
        7.3.6. East Asia
        7.3.7. Middle East and Africa
    7.4. Market Attractiveness Analysis By Region
8. North America Market Analysis 2018 to 2022 and Forecast 2023 to 2033, By Country
    8.1. Historical Market Size Value (US$ Million) & Volume (Units) Trend Analysis By Market Taxonomy, 2018 to 2022
    8.2. Market Size Value (US$ Million) & Volume (Units) Forecast By Market Taxonomy, 2023 to 2033
        8.2.1. By Country
            8.2.1.1. U.S.
            8.2.1.2. Canada
        8.2.2. By Product Type
        8.2.3. By Application
    8.3. Market Attractiveness Analysis
        8.3.1. By Country
        8.3.2. By Product Type
        8.3.3. By Application
    8.4. Key Takeaways
9. Latin America Market Analysis 2018 to 2022 and Forecast 2023 to 2033, By Country
    9.1. Historical Market Size Value (US$ Million) & Volume (Units) Trend Analysis By Market Taxonomy, 2018 to 2022
    9.2. Market Size Value (US$ Million) & Volume (Units) Forecast By Market Taxonomy, 2023 to 2033
        9.2.1. By Country
            9.2.1.1. Brazil
            9.2.1.2. Mexico
            9.2.1.3. Rest of Latin America
        9.2.2. By Product Type
        9.2.3. By Application
    9.3. Market Attractiveness Analysis
        9.3.1. By Country
        9.3.2. By Product Type
        9.3.3. By Application
    9.4. Key Takeaways
10. Western Europe Market Analysis 2018 to 2022 and Forecast 2023 to 2033, By Country
    10.1. Historical Market Size Value (US$ Million) & Volume (Units) Trend Analysis By Market Taxonomy, 2018 to 2022
    10.2. Market Size Value (US$ Million) & Volume (Units) Forecast By Market Taxonomy, 2023 to 2033
        10.2.1. By Country
            10.2.1.1. Germany
            10.2.1.2. U.K.
            10.2.1.3. France
            10.2.1.4. Spain
            10.2.1.5. Italy
            10.2.1.6. Rest of Western Europe
        10.2.2. By Product Type
        10.2.3. By Application
    10.3. Market Attractiveness Analysis
        10.3.1. By Country
        10.3.2. By Product Type
        10.3.3. By Application
    10.4. Key Takeaways
11. Eastern Europe Market Analysis 2018 to 2022 and Forecast 2023 to 2033, By Country
    11.1. Historical Market Size Value (US$ Million) & Volume (Units) Trend Analysis By Market Taxonomy, 2018 to 2022
    11.2. Market Size Value (US$ Million) & Volume (Units) Forecast By Market Taxonomy, 2023 to 2033
        11.2.1. By Country
            11.2.1.1. Poland
            11.2.1.2. Russia
            11.2.1.3. Czech Republic
            11.2.1.4. Romania
            11.2.1.5. Rest of Eastern Europe
        11.2.2. By Product Type
        11.2.3. By Application
    11.3. Market Attractiveness Analysis
        11.3.1. By Country
        11.3.2. By Product Type
        11.3.3. By Application
    11.4. Key Takeaways
12. South Asia and Pacific Market Analysis 2018 to 2022 and Forecast 2023 to 2033, By Country
    12.1. Historical Market Size Value (US$ Million) & Volume (Units) Trend Analysis By Market Taxonomy, 2018 to 2022
    12.2. Market Size Value (US$ Million) & Volume (Units) Forecast By Market Taxonomy, 2023 to 2033
        12.2.1. By Country
            12.2.1.1. India
            12.2.1.2. Bangladesh
            12.2.1.3. Australia
            12.2.1.4. New Zealand
            12.2.1.5. Rest of South Asia and Pacific
        12.2.2. By Product Type
        12.2.3. By Application
    12.3. Market Attractiveness Analysis
        12.3.1. By Country
        12.3.2. By Product Type
        12.3.3. By Application
    12.4. Key Takeaways
13. East Asia Market Analysis 2018 to 2022 and Forecast 2023 to 2033, By Country
    13.1. Historical Market Size Value (US$ Million) & Volume (Units) Trend Analysis By Market Taxonomy, 2018 to 2022
    13.2. Market Size Value (US$ Million) & Volume (Units) Forecast By Market Taxonomy, 2023 to 2033
        13.2.1. By Country
            13.2.1.1. China
            13.2.1.2. Japan
            13.2.1.3. South Korea
        13.2.2. By Product Type
        13.2.3. By Application
    13.3. Market Attractiveness Analysis
        13.3.1. By Country
        13.3.2. By Product Type
        13.3.3. By Application
    13.4. Key Takeaways
14. Middle East and Africa Market Analysis 2018 to 2022 and Forecast 2023 to 2033, By Country
    14.1. Historical Market Size Value (US$ Million) & Volume (Units) Trend Analysis By Market Taxonomy, 2018 to 2022
    14.2. Market Size Value (US$ Million) & Volume (Units) Forecast By Market Taxonomy, 2023 to 2033
        14.2.1. By Country
            14.2.1.1. GCC Countries
            14.2.1.2. South Africa
            14.2.1.3. Israel
            14.2.1.4. Rest of MEA
        14.2.2. By Product Type
        14.2.3. By Application
    14.3. Market Attractiveness Analysis
        14.3.1. By Country
        14.3.2. By Product Type
        14.3.3. By Application
    14.4. Key Takeaways
15. Key Countries Market Analysis
    15.1. U.S.
        15.1.1. Pricing Analysis
        15.1.2. Market Share Analysis, 2022
            15.1.2.1. By Product Type
            15.1.2.2. By Application
    15.2. Canada
        15.2.1. Pricing Analysis
        15.2.2. Market Share Analysis, 2022
            15.2.2.1. By Product Type
            15.2.2.2. By Application
    15.3. Brazil
        15.3.1. Pricing Analysis
        15.3.2. Market Share Analysis, 2022
            15.3.2.1. By Product Type
            15.3.2.2. By Application
    15.4. Mexico
        15.4.1. Pricing Analysis
        15.4.2. Market Share Analysis, 2022
            15.4.2.1. By Product Type
            15.4.2.2. By Application
    15.5. Germany
        15.5.1. Pricing Analysis
        15.5.2. Market Share Analysis, 2022
            15.5.2.1. By Product Type
            15.5.2.2. By Application
    15.6. U.K.
        15.6.1. Pricing Analysis
        15.6.2. Market Share Analysis, 2022
            15.6.2.1. By Product Type
            15.6.2.2. By Application
    15.7. France
        15.7.1. Pricing Analysis
        15.7.2. Market Share Analysis, 2022
            15.7.2.1. By Product Type
            15.7.2.2. By Application
    15.8. Spain
        15.8.1. Pricing Analysis
        15.8.2. Market Share Analysis, 2022
            15.8.2.1. By Product Type
            15.8.2.2. By Application
    15.9. Italy
        15.9.1. Pricing Analysis
        15.9.2. Market Share Analysis, 2022
            15.9.2.1. By Product Type
            15.9.2.2. By Application
    15.10. Poland
        15.10.1. Pricing Analysis
        15.10.2. Market Share Analysis, 2022
            15.10.2.1. By Product Type
            15.10.2.2. By Application
    15.11. Russia
        15.11.1. Pricing Analysis
        15.11.2. Market Share Analysis, 2022
            15.11.2.1. By Product Type
            15.11.2.2. By Application
    15.12. Czech Republic
        15.12.1. Pricing Analysis
        15.12.2. Market Share Analysis, 2022
            15.12.2.1. By Product Type
            15.12.2.2. By Application
    15.13. Romania
        15.13.1. Pricing Analysis
        15.13.2. Market Share Analysis, 2022
            15.13.2.1. By Product Type
            15.13.2.2. By Application
    15.14. India
        15.14.1. Pricing Analysis
        15.14.2. Market Share Analysis, 2022
            15.14.2.1. By Product Type
            15.14.2.2. By Application
    15.15. Bangladesh
        15.15.1. Pricing Analysis
        15.15.2. Market Share Analysis, 2022
            15.15.2.1. By Product Type
            15.15.2.2. By Application
    15.16. Australia
        15.16.1. Pricing Analysis
        15.16.2. Market Share Analysis, 2022
            15.16.2.1. By Product Type
            15.16.2.2. By Application
    15.17. New Zealand
        15.17.1. Pricing Analysis
        15.17.2. Market Share Analysis, 2022
            15.17.2.1. By Product Type
            15.17.2.2. By Application
    15.18. China
        15.18.1. Pricing Analysis
        15.18.2. Market Share Analysis, 2022
            15.18.2.1. By Product Type
            15.18.2.2. By Application
    15.19. Japan
        15.19.1. Pricing Analysis
        15.19.2. Market Share Analysis, 2022
            15.19.2.1. By Product Type
            15.19.2.2. By Application
    15.20. South Korea
        15.20.1. Pricing Analysis
        15.20.2. Market Share Analysis, 2022
            15.20.2.1. By Product Type
            15.20.2.2. By Application
    15.21. GCC Countries
        15.21.1. Pricing Analysis
        15.21.2. Market Share Analysis, 2022
            15.21.2.1. By Product Type
            15.21.2.2. By Application
    15.22. South Africa
        15.22.1. Pricing Analysis
        15.22.2. Market Share Analysis, 2022
            15.22.2.1. By Product Type
            15.22.2.2. By Application
    15.23. Israel
        15.23.1. Pricing Analysis
        15.23.2. Market Share Analysis, 2022
            15.23.2.1. By Product Type
            15.23.2.2. By Application
16. Market Structure Analysis
    16.1. Competition Dashboard
    16.2. Competition Benchmarking
    16.3. Market Share Analysis of Top Players
        16.3.1. By Regional
        16.3.2. By Product Type
        16.3.3. By Application
17. Competition Analysis
    17.1. Competition Deep Dive
        17.1.1. Texas Instruments Incorporated
            17.1.1.1. Overview
            17.1.1.2. Product Portfolio
            17.1.1.3. Profitability by Market Segments
            17.1.1.4. Sales Footprint
            17.1.1.5. Strategy Overview
                17.1.1.5.1. Marketing Strategy
                17.1.1.5.2. Product Strategy
                17.1.1.5.3. Channel Strategy
        17.1.2. ST Microelectronics
            17.1.2.1. Overview
            17.1.2.2. Product Portfolio
            17.1.2.3. Profitability by Market Segments
            17.1.2.4. Sales Footprint
            17.1.2.5. Strategy Overview
                17.1.2.5.1. Marketing Strategy
                17.1.2.5.2. Product Strategy
                17.1.2.5.3. Channel Strategy
        17.1.3. Renesas Electronics Corporation
            17.1.3.1. Overview
            17.1.3.2. Product Portfolio
            17.1.3.3. Profitability by Market Segments
            17.1.3.4. Sales Footprint
            17.1.3.5. Strategy Overview
                17.1.3.5.1. Marketing Strategy
                17.1.3.5.2. Product Strategy
                17.1.3.5.3. Channel Strategy
        17.1.4. ON Semiconductor Corporation
            17.1.4.1. Overview
            17.1.4.2. Product Portfolio
            17.1.4.3. Profitability by Market Segments
            17.1.4.4. Sales Footprint
            17.1.4.5. Strategy Overview
                17.1.4.5.1. Marketing Strategy
                17.1.4.5.2. Product Strategy
                17.1.4.5.3. Channel Strategy
        17.1.5. Maxim Integrated, Inc.
            17.1.5.1. Overview
            17.1.5.2. Product Portfolio
            17.1.5.3. Profitability by Market Segments
            17.1.5.4. Sales Footprint
            17.1.5.5. Strategy Overview
                17.1.5.5.1. Marketing Strategy
                17.1.5.5.2. Product Strategy
                17.1.5.5.3. Channel Strategy
        17.1.6. Asahi Kasei Microdevices Corporation
            17.1.6.1. Overview
            17.1.6.2. Product Portfolio
            17.1.6.3. Profitability by Market Segments
            17.1.6.4. Sales Footprint
            17.1.6.5. Strategy Overview
                17.1.6.5.1. Marketing Strategy
                17.1.6.5.2. Product Strategy
                17.1.6.5.3. Channel Strategy
        17.1.7. Rohm Co, Ltd.
            17.1.7.1. Overview
            17.1.7.2. Product Portfolio
            17.1.7.3. Profitability by Market Segments
            17.1.7.4. Sales Footprint
            17.1.7.5. Strategy Overview
                17.1.7.5.1. Marketing Strategy
                17.1.7.5.2. Product Strategy
                17.1.7.5.3. Channel Strategy
        17.1.8. Cirrus Logic Inc.
            17.1.8.1. Overview
            17.1.8.2. Product Portfolio
            17.1.8.3. Profitability by Market Segments
            17.1.8.4. Sales Footprint
            17.1.8.5. Strategy Overview
                17.1.8.5.1. Marketing Strategy
                17.1.8.5.2. Product Strategy
                17.1.8.5.3. Channel Strategy
        17.1.9. Microchip Technology Inc.
            17.1.9.1. Overview
            17.1.9.2. Product Portfolio
            17.1.9.3. Profitability by Market Segments
            17.1.9.4. Sales Footprint
            17.1.9.5. Strategy Overview
                17.1.9.5.1. Marketing Strategy
                17.1.9.5.2. Product Strategy
                17.1.9.5.3. Channel Strategy
        17.1.10. Analog Devices Inc.
            17.1.10.1. Overview
            17.1.10.2. Product Portfolio
            17.1.10.3. Profitability by Market Segments
            17.1.10.4. Sales Footprint
            17.1.10.5. Strategy Overview
                17.1.10.5.1. Marketing Strategy
                17.1.10.5.2. Product Strategy
                17.1.10.5.3. Channel Strategy
        17.1.11. Diligent Inc.
            17.1.11.1. Overview
            17.1.11.2. Product Portfolio
            17.1.11.3. Profitability by Market Segments
            17.1.11.4. Sales Footprint
            17.1.11.5. Strategy Overview
                17.1.11.5.1. Marketing Strategy
                17.1.11.5.2. Product Strategy
                17.1.11.5.3. Channel Strategy
        17.1.12. National Instruments
            17.1.12.1. Overview
            17.1.12.2. Product Portfolio
            17.1.12.3. Profitability by Market Segments
            17.1.12.4. Sales Footprint
            17.1.12.5. Strategy Overview
                17.1.12.5.1. Marketing Strategy
                17.1.12.5.2. Product Strategy
                17.1.12.5.3. Channel Strategy
        17.1.13. Sony Corporation
            17.1.13.1. Overview
            17.1.13.2. Product Portfolio
            17.1.13.3. Profitability by Market Segments
            17.1.13.4. Sales Footprint
            17.1.13.5. Strategy Overview
                17.1.13.5.1. Marketing Strategy
                17.1.13.5.2. Product Strategy
                17.1.13.5.3. Channel Strategy
        17.1.14. Adafruit Industries
            17.1.14.1. Overview
            17.1.14.2. Product Portfolio
            17.1.14.3. Profitability by Market Segments
            17.1.14.4. Sales Footprint
            17.1.14.5. Strategy Overview
                17.1.14.5.1. Marketing Strategy
                17.1.14.5.2. Product Strategy
                17.1.14.5.3. Channel Strategy
18. Assumptions & Acronyms Used
19. Research Methodology
Recommendations

Technology

Digital Transformation Industry Analysis in MENA

February 2024

REP-MA-39

342 pages

Technology

Analog & Digital IC Development Tools Market

June 2022

REP-GB-10501

323 pages

Explore Technology Insights

View Reports
Future Market Insights

Analog to Digital Converter Market

Schedule a Call