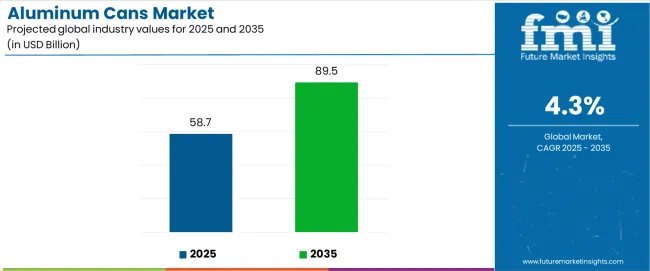
The global aluminum cans market is valued at USD 58.7 billion in 2025 and is set to reach USD 89.5 billion by 2035, growing at a CAGR of 4.3%. The market stands at the forefront of a transformative decade that promises to redefine beverage packaging infrastructure and lightweight container excellence across carbonated soft drinks, beer, energy drinks, and ready-to-drink beverage sectors. The market's journey from USD 58.7 billion in 2025 to USD 89.5 billion by 2035 represents substantial growth, demonstrating the accelerating adoption of recyclable metal packaging solutions and sophisticated barrier protection systems across beverage brands, convenience retail, and on-the-go consumption applications.
As per Future Market Insights, certified through ESOMAR corporate membership in global intelligence, the first half of the decade (2025-2030) will witness the market climbing from USD 58.7 billion to approximately USD 72,458 million, adding USD 13,716 million in value, which constitutes 42% of the total forecast growth period. This phase will be characterized by the rapid adoption of lightweight can designs, driven by increasing demand for single-serve formats and enhanced portability requirements worldwide. Superior barrier properties and chilling efficiency will become standard expectations rather than premium options.
The latter half (2030-2035) will witness sustained growth from USD 72,458 million to USD 89.5 billion, representing an addition of USD 16,858 million or 58% of the decade's expansion. This period will be defined by mass market penetration of specialized can formats, integration with comprehensive beverage platforms, and seamless compatibility with existing filling and distribution infrastructure. The market trajectory signals fundamental shifts in how beverage manufacturers and brand owners approach portable packaging solutions, with participants positioned to benefit from sustained demand across multiple beverage segments.
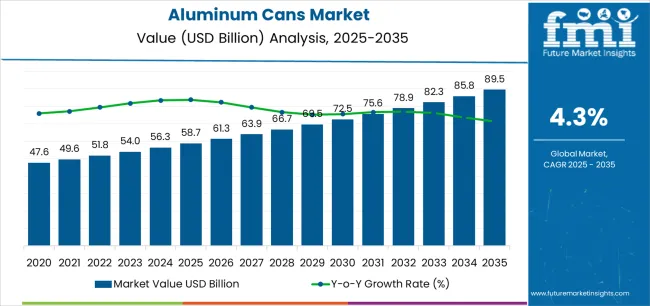
The aluminum cans market demonstrates distinct growth phases with varying market characteristics and competitive dynamics. Between 2025 and 2030, the market progresses through its lightweight packaging adoption phase, expanding from USD 58.7 billion to USD 72,458 million with steady annual increments averaging 4.3% growth. This period showcases the transition from traditional steel containers to advanced aluminum can systems with enhanced graphics capabilities and integrated temperature retention becoming mainstream features.
The 2025-2030 phase adds USD 13,716 million to market value, representing 42% of total decade expansion. Market maturation factors include standardization of can dimensions, declining production costs for thin-wall manufacturing, and increasing beverage brand awareness of aluminum advantages reaching 75-80% effectiveness in portable packaging applications. Competitive landscape evolution during this period features established manufacturers like Ball Corporation and Crown Holdings expanding their production capacity while new entrants focus on specialized slim can formats and enhanced coating technology.
From 2030 to 2035, market dynamics shift toward advanced customization and multi-beverage deployment, with growth accelerating from USD 72,458 million to USD 89.5 billion, adding USD 16,858 million or 58% of total expansion. This phase transition logic centers on universal aluminum can systems, integration with high-speed filling equipment, and deployment across diverse beverage scenarios, becoming standard rather than specialized packaging formats. The competitive environment matures with focus shifting from basic can size to comprehensive barrier performance and compatibility with rapid chilling operations.
| Metric | Value |
|---|---|
| Market Value (2025) | USD 58.7 billion |
| Market Forecast (2035) | USD 89.5 billion |
| Growth Rate | 4.3% CAGR |
| Leading Can Type | Standard 12 oz Cans |
| Primary Application | Carbonated Soft Drinks |
The market demonstrates strong fundamentals with standard 12 oz can systems capturing a dominant share through superior consumer familiarity and established filling infrastructure capabilities. Carbonated soft drinks applications drive primary demand, supported by increasing convenience retail growth requirements and portable consumption management solutions. Geographic expansion remains concentrated in developed markets with established beverage distribution networks, while emerging economies show accelerating adoption rates driven by urbanization projects and rising disposable income activity.
The aluminum cans market represents a compelling intersection of beverage packaging innovation, portable consumption enhancement, and recyclability management. With robust growth projected from USD 58.7 billion in 2025 to USD 89.5 billion by 2035 at a 4.30% CAGR, this market is driven by increasing convenience retail expansion trends, on-the-go consumption requirements, and commercial demand for lightweight, chillable formats.
The market's expansion reflects a fundamental shift in how beverage manufacturers and brand owners approach container infrastructure. Strong growth opportunities exist across diverse applications, from carbonated soft drinks operations requiring carbonation retention to energy drink facilities demanding vibrant graphics solutions. Geographic expansion is particularly pronounced in Asia-Pacific markets, led by China (5.2% CAGR) and India (5.8% CAGR), while established markets in North America and Europe drive innovation and specialized segment development.
The dominance of standard 12 oz cans and carbonated soft drinks applications underscores the importance of proven filling technology and consumer acceptance in driving adoption. Production costs and aluminum price volatility remain key challenges, creating opportunities for companies that can deliver reliable performance while maintaining material efficiency.
Market expansion rests on three fundamental shifts driving adoption across beverage and retail sectors. Convenience consumption creates compelling advantages through aluminum cans that provide comprehensive portability with rapid chilling capability, enabling beverage brands to capture on-the-go occasions and reduce serving time while maintaining product freshness and justifying investment over glass or plastic alternatives. Retail modernization accelerates as beverage companies worldwide seek lightweight packaging systems that deliver shelf efficiency directly to refrigerated display environments, enabling space optimization that aligns with retailer expectations and maximizes distribution density. Recyclability drives adoption from environmentally-conscious consumers requiring closed-loop material solutions that minimize packaging waste while maintaining beverage quality during storage and consumption operations.
The growth faces headwinds from aluminum price fluctuations that differ across commodity markets regarding material availability and raw metal costs, potentially limiting profit margins in price-sensitive beverage categories. Production complexity also persists regarding can forming precision and coating uniformity that may increase quality control requirements in markets with demanding barrier standards.
Primary Classification: The market segments by can type into standard 12 oz cans, slim cans, sleek cans, and specialty formats categories, representing the evolution from traditional beverage containers to customized packaging formats for comprehensive brand operations.
Secondary Breakdown: Application segmentation divides the market into carbonated soft drinks, beer, energy drinks, juice & nectars, ready-to-drink beverages, and others sectors, reflecting distinct requirements for carbonation retention, barrier properties, and chilling efficiency.
Regional Classification: Geographic distribution covers North America, Europe, Asia Pacific, Latin America, and the Middle East & Africa, with developed markets leading consumption while emerging economies show accelerating growth patterns driven by urbanization programs.
The segmentation structure reveals technology progression from standard 12 oz formats toward integrated specialty platforms with enhanced graphics and barrier capabilities, while application diversity spans from soft drink operations to craft beverage facilities requiring comprehensive brand presentation and lightweight protection solutions.
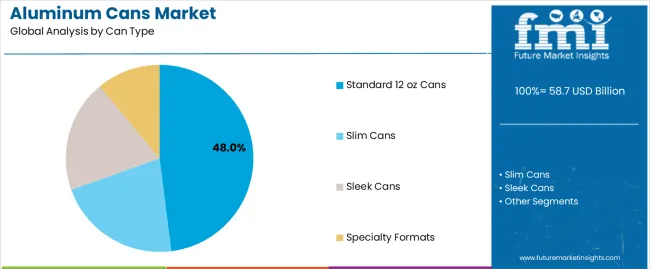
Standard 12 oz cans segment is estimated to account for 48% of the aluminum cans market share in 2025. The segment's leading position stems from its fundamental role as a critical component in mainstream beverage packaging applications and its extensive use across multiple soft drink and beer sectors. Standard 12 oz cans' dominance is attributed to its universal consumer recognition, including established portion control, optimal chilling surface area, and balanced material usage that make it indispensable for mass market beverage operations.
Market Position: Standard 12 oz can systems command the leading position in the aluminum cans market through advanced manufacturing technologies, including comprehensive diameter control, uniform wall thickness, and reliable end seaming performance that enable manufacturers to deploy packaging solutions across diverse beverage environments.
Value Drivers: The segment benefits from beverage brand preference for proven can formats that provide exceptional filling compatibility without requiring specialized equipment investments. Efficient production economics enable deployment in soft drinks, beer, and energy drink applications where material efficiency and consumer familiarity represent critical selection requirements.
Competitive Advantages: Standard 12 oz can systems differentiate through universal filling equipment compatibility, proven shelf stability, and standardized distribution dimensions that enhance beverage operations while maintaining economical material profiles suitable for diverse high-volume packaging applications.
Key market characteristics:
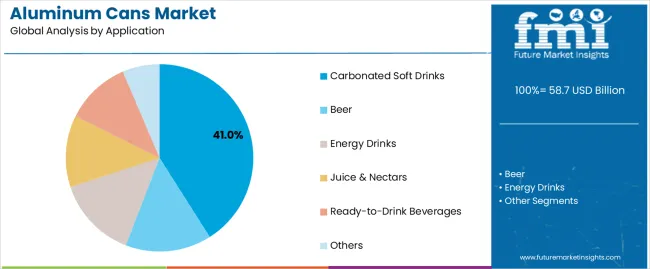
Carbonated soft drinks segment is projected to hold 41% of the aluminum cans market share in 2025. The segment's market leadership is driven by the extensive use of aluminum cans in cola beverages, lemon-lime sodas, flavor varieties, and diet formulations, where metal containers serve as both a carbonation barrier and brand canvas. The carbonated soft drinks industry's consistent investment in portable packaging supports the segment's dominant position.
Market Context: Carbonated soft drinks applications dominate the market due to widespread adoption of single-serve formats and increasing focus on chilled consumption, impulse purchases, and vending machine compatibility that enhance brand accessibility while maintaining carbonation integrity.
Appeal Factors: Beverage manufacturers prioritize barrier performance, graphics quality, and integration with high-speed filling lines that enable coordinated deployment across multiple production facilities. The segment benefits from substantial convenience retail growth and vending standards that emphasize portable packaging for immediate consumption applications.
Growth Drivers: On-the-go lifestyle programs incorporate aluminum cans as standard packaging for fountain alternatives and mobile refreshment. At the same time, brand owner initiatives are increasing demand for eye-catching graphics systems that comply with retail merchandising standards and enhance consumer purchase decisions.
Market Challenges: Sugar taxation initiatives and health consciousness trends may limit deployment flexibility in full-calorie formulations or traditional cola categories.
Application dynamics include:
Growth Accelerators: Convenience retail expansion drives primary adoption as aluminum cans provide exceptional portability capabilities that enable immediate consumption without additional serving vessels, supporting impulse purchases and mobile lifestyle patterns that require ready-to-drink formats. Beverage innovation accelerates market growth as energy drink brands and functional beverage companies seek lightweight packaging solutions that maintain product integrity during distribution while enhancing shelf presence through metallic graphics opportunities. Consumer preferences increase worldwide, creating sustained demand for chillable packaging systems that complement beverage positioning and provide competitive advantages in cold drink differentiation.
Growth Inhibitors: Aluminum price volatility challenges differ across commodity cycles regarding raw material availability and production economics, which may limit market penetration and profitability in cost-sensitive categories with tight pricing structures. Production investment requirements persist regarding can manufacturing equipment and specialized coating lines that may increase capital barriers in emerging markets with limited infrastructure capacity. Market competition from plastic bottles and glass containers creates format concerns between different packaging systems and existing consumer preferences.
Market Evolution Patterns: Adoption accelerates in energy drinks and craft beer sectors where premium positioning justifies material investments, with geographic concentration in developed markets transitioning toward mainstream adoption in emerging economies driven by urbanization and middle-class expansion. Technology development focuses on enhanced barrier coatings, improved lightweighting techniques, and integration with digital printing systems that optimize brand presentation and production efficiency. The market could face disruption if alternative portable packaging or technology innovations significantly challenge aluminum can advantages in beverage applications.
The aluminum cans market demonstrates varied regional dynamics with Growth Leaders including India (5.8% CAGR) and China (5.2% CAGR) driving expansion through urbanization growth and beverage modernization. Steady Performers encompass the USA (4.5% CAGR), Germany (3.8% CAGR), and Japan (3.2% CAGR), benefiting from established beverage sectors and craft drink adoption.
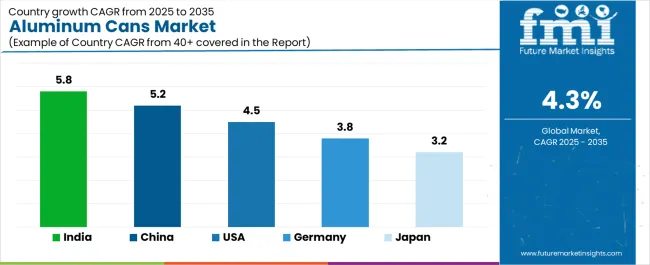
| Country | CAGR (2025-2035) |
|---|---|
| India | 5.8% |
| China | 5.2% |
| USA | 4.5% |
| Germany | 3.8% |
| Japan | 3.2% |
Regional synthesis reveals Asia-Pacific markets leading growth through beverage consumption expansion and convenience retail development, while European countries maintain steady expansion supported by craft beer applications and premium beverage requirements. North American markets show strong growth driven by energy drinks and ready-to-drink cocktail packaging applications.
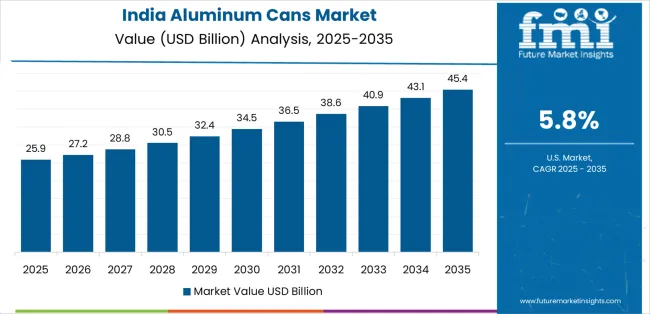
India establishes regional leadership through explosive middle-class expansion and comprehensive beverage market modernization, integrating aluminum cans as standard components in carbonated soft drinks packaging and energy drink applications. The country's 5.8% CAGR through 2035 reflects disposable income growth promoting convenience consumption and domestic manufacturing activity that mandate the use of portable packaging systems in retail operations. Growth concentrates in major metropolitan areas, including Mumbai, Delhi, and Bangalore, where distribution networks showcase integrated aluminum can systems that appeal to young consumers seeking modern beverage experiences and international brand standards.
Indian beverage companies are developing innovative can solutions that combine affordability advantages with aspirational positioning, including compact 250ml formats and bold graphics capabilities.
Strategic Market Indicators:
The Chinese market emphasizes beverage applications, including rapid soft drink development and comprehensive energy drink expansion that increasingly incorporates aluminum cans for brand positioning and distribution efficiency applications. The country is projected to show a 5.2% CAGR through 2035, driven by massive urbanization activity under modernization initiatives and commercial demand for affordable, convenient packaging systems. Chinese beverage manufacturers prioritize production scale with aluminum cans delivering brand appeal through efficient manufacturing economics and established recycling capabilities.
Technology deployment channels include major beverage companies, regional soft drink producers, and international brands that support high-volume usage for domestic and export applications.
Performance Metrics:
The USA market emphasizes advanced can features, including innovative graphics technologies and integration with comprehensive craft beverage platforms that manage product differentiation, brand storytelling, and consumer engagement applications through unified packaging systems. The country is projected to show a 4.5% CAGR through 2035, driven by craft beer expansion under artisanal beverage trends and commercial demand for premium, distinctive packaging systems. American beverage brands prioritize consumer experience with aluminum cans delivering comprehensive brand expression through specialized printing and tactile finishes.
Technology deployment channels include major beverage corporations, craft breweries, and energy drink companies that support custom development for premium operations.
Performance Metrics:
In Bavaria, North Rhine-Westphalia, and Baden-Württemberg, German beverage manufacturers and brewing companies are implementing advanced aluminum can systems to enhance product protection capabilities and support brand differentiation that aligns with purity protocols and retail standards. The German market demonstrates sustained growth with a 3.8% CAGR through 2035, driven by craft beer innovation programs and premium beverage investments that emphasize quality packaging systems for alcoholic and non-alcoholic applications. German filling facilities are prioritizing aluminum can systems that provide exceptional barrier properties while maintaining compliance with deposit return schemes and minimizing material weight, particularly important in premium beer packaging and specialty beverage operations.
Market expansion benefits from deposit legislation programs that mandate recyclable packaging in beverage specifications, creating sustained demand across Germany's beverage and brewing sectors, where material recovery and consumer convenience represent critical requirements.
Strategic Market Indicators:
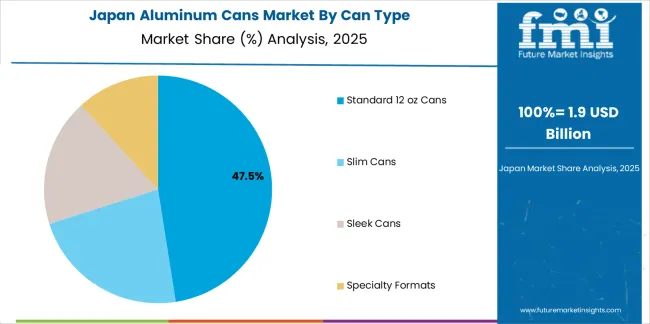
Japan's sophisticated beverage market demonstrates meticulous aluminum can deployment, growing at 3.2% CAGR, with documented operational excellence in product protection and vending machine applications through integration with existing filling systems and quality assurance infrastructure. The country leverages engineering expertise in can manufacturing and coating precision to maintain market leadership. Beverage centers, including Tokyo, Osaka, and Nagoya, showcase advanced installations where aluminum can systems integrate with comprehensive vending platforms and distribution systems to optimize product freshness and consumer convenience.
Japanese beverage manufacturers prioritize can precision and coating consistency in product development, creating demand for premium aluminum can systems with advanced features, including pull-tab innovation and integration with hot/cold vending protocols. The market benefits from established filling infrastructure and willingness to invest in specialized can technologies that provide superior barrier quality and regulatory compliance.
Market Intelligence Brief:
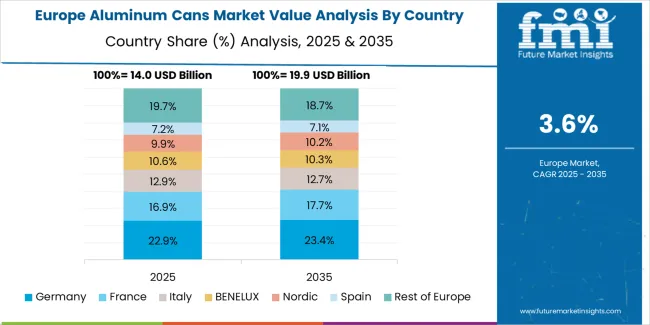
The aluminum cans market in Europe is projected to grow from USD 16,428 million in 2025 to USD 24,167 million by 2035, registering a CAGR of 3.9% over the forecast period. Germany is expected to maintain its leadership position with a 32.4% market share in 2025, declining slightly to 31.8% by 2035, supported by its beverage excellence and major brewing centers, including Bavaria and the Rhineland.
The United Kingdom follows with a 24.7% share in 2025, projected to reach 25.3% by 2035, driven by comprehensive energy drink consumption and craft beer initiatives. France holds a 18.6% share in 2025, expected to maintain 18.9% by 2035 through established soft drink sectors and premium beverage adoption. Spain commands a 12.8% share, while Italy accounts for 8.2% in 2025. The Rest of Europe region is anticipated to gain momentum, expanding its collective share from 3.3% to 3.9% by 2035, attributed to increasing convenience retail development in Eastern European countries and emerging Nordic craft breweries implementing distinctive packaging programs.
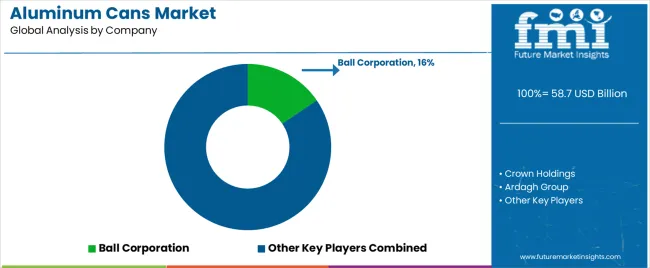
The aluminum cans market operates with moderate concentration, featuring approximately 18-25 participants, where leading companies control roughly 52-58% of the global market share through established filling line relationships and comprehensive production capabilities. Competition emphasizes barrier performance, graphics quality, and filling efficiency rather than price-based rivalry.
Market leaders encompass Ball Corporation, Crown Holdings, and Ardagh Group, which maintain competitive advantages through extensive can manufacturing expertise, global production networks, and comprehensive technical support capabilities that create beverage brand loyalty and support application requirements. These companies leverage decades of metal packaging experience and ongoing light weighting technology investments to develop advanced aluminum can systems with exceptional barrier properties and graphics features.
Specialty challengers include CANPACK, Showa Aluminum Can Corporation, and Toyo Seikan, which compete through specialized beverage innovation focus and efficient production solutions that appeal to craft brewers seeking distinctive formats and custom graphics flexibility. These companies differentiate through design engineering emphasis and specialized coating focus.
Market dynamics favor participants that combine reliable barrier performance with advanced graphics support, including digital printing capabilities and specialty finish options. Competitive pressure intensifies as traditional can manufacturers expand into specialty formats. At the same time, regional producers challenge established players through innovative end designs and cost-effective production targeting emerging beverage segments.
| Item | Value |
|---|---|
| Quantitative Units | USD 58.7 billion |
| Can Type | Standard 12 oz Cans, Slim Cans, Sleek Cans, Specialty Formats |
| Application | Carbonated Soft Drinks, Beer, Energy Drinks, Juice & Nectars, Ready-to-Drink Beverages, Others |
| Regions Covered | North America, Europe, Asia Pacific, Latin America, Middle East & Africa |
| Countries Covered | USA, Germany, Japan, China, India, and 25+ additional countries |
| Key Companies Profiled | Ball Corporation, Crown Holdings, Ardagh Group, CANPACK, Showa Aluminum Can Corporation, Toyo Seikan |
| Additional Attributes | Dollar sales by can type and application categories, regional adoption trends across North America, Europe, and Asia-Pacific, competitive landscape with can manufacturers and beverage fillers, brand owner preferences for barrier properties and graphics quality, integration with filling equipment and distribution systems, innovations in lightweighting technology and coating treatments, and development of specialized portable solutions with enhanced barrier capabilities and chilling features |
The global aluminum cans market is estimated to be valued at USD 58.7 billion in 2025.
The market size for the aluminum cans market is projected to reach USD 89.5 billion by 2035.
The aluminum cans market is expected to grow at a 4.3% CAGR between 2025 and 2035.
The key product types in aluminum cans market are standard 12 oz cans, slim cans, sleek cans and specialty formats.
In terms of application, carbonated soft drinks segment to command 41.0% share in the aluminum cans market in 2025.


Full Research Suite comprises of:
Market outlook & trends analysis
Interviews & case studies
Strategic recommendations
Vendor profiles & capabilities analysis
5-year forecasts
8 regions and 60+ country-level data splits
Market segment data splits
12 months of continuous data updates
DELIVERED AS:
PDF EXCEL ONLINE
Market Share Breakdown of the Aluminum Cans Market
Aluminum Aerosol Cans Market Size and Share Forecast Outlook 2025 to 2035
Competitive Overview of the Aluminum Aerosol Cans Market Share
Beverage Aluminum Cans Market Size and Share Forecast Outlook 2025 to 2035
Market Positioning & Share in Beverage Aluminum Cans Production
Aluminum Casing of the Blade Battery Market Size and Share Forecast Outlook 2025 to 2035
Aluminum ROPP Closure Market Size and Share Forecast Outlook 2025 to 2035
Aluminum Foil Packaging Market Size and Share Forecast Outlook 2025 to 2035
Aluminum Pouches Market Size and Share Forecast Outlook 2025 to 2035
Aluminum Foil Peel-Off Ends Maker Market Size and Share Forecast Outlook 2025 to 2035
Aluminum Foil Tape Market Size and Share Forecast Outlook 2025 to 2035
Aluminum-Free Food Pouch Market Size and Share Forecast Outlook 2025 to 2035
Aluminum-Nickel Catalyst Market Size and Share Forecast Outlook 2025 to 2035
Aluminum Frame Monitors Market Size and Share Forecast Outlook 2025 to 2035
Aluminum Composite Materials Market Size and Share Forecast Outlook 2025 to 2035
Aluminum Coated Thermal Protective Clothing Market Size and Share Forecast Outlook 2025 to 2035
Aluminum Flat Products Market Size and Share Forecast Outlook 2025 to 2035
Aluminum Alloys Market Size and Share Forecast Outlook 2025 to 2035
Aluminum Sheets and Coils Market Size and Share Forecast Outlook 2025 to 2035
Aluminum Foil Containers Market Size and Share Forecast Outlook 2025 to 2035

Thank you!
You will receive an email from our Business Development Manager. Please be sure to check your SPAM/JUNK folder too.
Chat With
MaRIA