Alternative Protein Market Outlook (2023 to 2033)

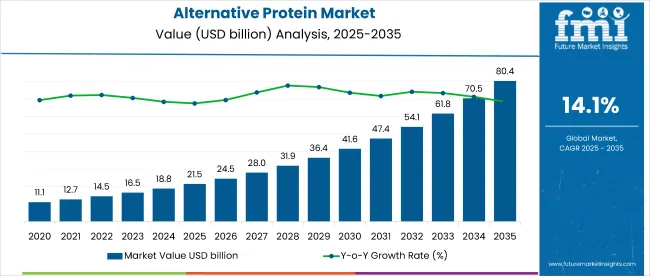
The alternative protein market is estimated to capture a valuation of US$ 76.3 billion in 2023 and is projected to reach US$ 423 billion by 2033. The market is estimated to secure a CAGR of 19% during the forecast period.

Proteins sourced from insects, plants, and microbes are widely used to replace conventional animal-based proteins. Alternative proteins are non-meat proteins obtained from various sources such as plants, fungi, and insects. Alternative proteins are used in dairy-free foods and meat-free diets, such as meat analogs and various animal feed products. Consumers have shown a keen interest in health, ethical considerations, and minimal intake of protein calories to stay healthy daily.

The surge in clean protein consumption, along with increased awareness and adoption of sustainably sourced proteins by consumers, is likely to fuel product demand. Consumers are becoming aware of the importance of clean protein in their daily diet for energy and weight management which is anticipated to positively impact the alternative protein market growth.

Alternative protein provides several health benefits, such as increasing the nutritional constitution of the body and strengthening the immune system, which should increase the global market for food application, which should favor market growth.

Which are the Prominent Drivers of the Global Market?

Animal nutrition is increasing the demand for alternative protein.

Alternative protein is important in the livestock sector as it feeds various animals such as cattle, aquaculture, poultry, swine, pet food, and equine. A higher demand for alternative protein sources for animal feed has been observed due to greater emphasis on lowering the overall cost of feed, which is expected to drive the alternative protein market share. Alternative protein is a key source for animal feed application owing to the high composition of amino acids and vitamins of plant-based proteins.

In addition, animal nutrition has become a key concern across the globe. Epidemics amongst animals are increasing at a rapid scale. To combat the same, livestock owners are investing in alternative proteins that are rich in nutrition and do not negatively impact animal health. Manufacturers of alternative proteins are focusing on innovating different types of plant protein for animals that suit different species and breeds of animals.

Plant-based proteins supply nutrition and taste

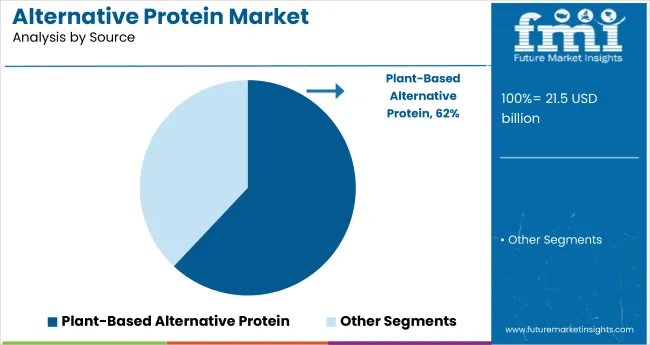
Plant-based protein sources, such as soy protein, are widely used in burger patties, minces, and sausages owing to the acceptable quality attributes of meat analogs in terms of texture & taste. In addition, increasing awareness among consumers regarding the harmful health effects of meat & meat products drives the demand for meat analogs, which is expected to positively influence the global market.

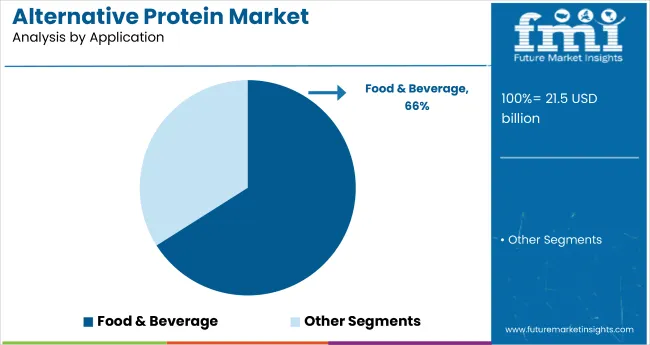
Consumer focus on sustainability, growing health concerns, and the craving for great taste in meat analogs are a few factors driving the demand for meat analogs, which is expected to positively impact the global market growth. Texturized vegetable proteins offer elastic, spongy texture and a wide array of other properties favorable for utilization in analog meat products. Moreover, meat analogs provide better shelf life and safety advantages than meat products. Thus, alternative proteins are used in various food products.

What are the Challenges Faced by the Global Market?

Stringent regulatory compliances, along with the inability to digest protein, hamper growth

Edible insects have a lack of regulatory clarity in the food industry applications. The consequences of consuming edible insects can differ from person to person, thus, complicating the process for approval. It, in turn, restricts the growth of the insect-based protein market.

Furthermore, allergies associated with alternative proteins, such as plant- and insect-based proteins, hamper the market's growth. Moreover, stringent feed regulatory compliances for the livestock industry are creating obstacles to market growth.

Despite the variety of proteins available in the market, all types of protein are not suitable for the livestock industry and humans. It leads to large investments in researching alternative proteins for different species of animals. Although the lactose-intolerant population is demanding alternative proteins, most consumers are still getting accustomed to the taste of the proteins. All these factors are slowing down the progress of the market.

Attributes Details
Market CAGR (2023 to 2033) 19%
Market Valuation (2023) US$ 76.3 billion
Market Valuation (2033) US$ 423 billion

Don't pay for what you don't need

Customize your report by selecting specific countries or regions and save 30%!

Swivel Couplers Market, 2018 to 2022 Historical Sales, Compared to 2023 to 2033 Future Outlook

As per Future Market Insights (FMI), the global market grew at a steady CAGR of 5.8% between 2018 and 2022. The market captured a valuation of US$ 73.4 billion in 2022.

The demand for alternative protein has always been high in the livestock industry and humans. It has led manufacturers of food products to diversify into the global market and satisfy consumer needs. Moreover, innovation has led to the development of various alternative proteins ranging from microbial to plant proteins.

Furthermore, veganism is becoming common across different geographical regions in the world. Owing to this, plant-based proteins such as pea, soy, and nut protein are gaining popularity. Demand for external protein, such as microbial protein, is expected to rise rapidly in the forecast period.

Category-Wise Insights

Health Awareness Escalating Demand for Microbial-based Alternative Protein?

High protein diet increasing demand for microbial-based alternative protein.

The growth of the microbial-based alternative protein market is attributed to the high adoption of sustainable sources for food and animal nutrition. Growing health awareness among consumers for consuming a high-protein diet and rising environmental concerns among the population are expected to increase the consumption of microbial-based protein.

Microbial-based protein sources, such as bacteria, algae, yeast, and fungi, are widely used in food applications. Microbial-based proteins are widely used in dietary supplements as they are a healthy source of vitamins, carotenes, and carbohydrates which should boost microbial-based protein demand. The microbial-based proteins are nutritive protein sources and can be used in various functional foods & beverages, which is expected to stimulate the global market growth.

Special Nutrition Needs Accelerating Adoption of Alternative Proteins in Animal Feed?

Breed and species-specific alternative proteins sufficing nutritional needs for animal feed

Animal feed is expected to be a large contributor to the global market. It is owing to the requirement for the special dietary need of animals. From plant-based pet food to alternative proteins for aquaculture, the demand for animal protein alternatives is vast. Alternative protein manufacturers focus on producing breed and species-specific proteins to obtain better results.

Furthermore, incidences of animal protein alternative allergies have opened doors for manufacturers to innovate newer protein alternatives. Thus, alternative protein companies are expanding their product portfolio for different animals. For these reasons, animal feed is expected to procure a 55% market share in 2022.

Nandini Roy Choudhury

Principal Consultant

Talk to Analyst

Find your sweet spots for generating winning opportunities in this market.

Region-Wise Insights

Countries Forecast Share Between 2023 to 2033
United States 13.4%
Germany 2.7%
Japan 2.9%
Australia 2.6%
Countries Forecast CAGR Between 2023 and 2033
China 5.3%
India 29.5%
United Kingdom 4.5%

Requirement for Animal Nutrition Boosting Sales of Alternative Protein Market in North America?

Nutritious ingredients and food innovation are propelling the demand for alternative protein.

North American consumers are concerned regarding the ingredients used in food products. Sustainability and health impacts play a key role while making choosing alternative proteins. In addition, the growing demand for nutritious ingredients and increasing consumer attention toward preventive healthcare are accelerating the sales of alternative protein, especially in the United States. The United States dominates the global market by securing a share of 13.4% during the forecast period.

Furthermore, an increase in poultry meat consumption for high protein intake and as a less harmful source of animal protein than red meat is driving the demand for poultry feed, which is estimated to escalate the global market revenue. Moreover, significant investments in Research and Development for product innovations in the food & beverage sector and a focus on animal nutrition and health should contribute towards regional industry growth.

Veganism Creating Lucrative Opportunities for Alternative Protein in Europe?

Plant-based protein options serving protein intake

Europe is experiencing a growing trend of veganism. People from the United Kingdom and Germany are inclined to invest in plant-based protein. Plant proteins extracted from soy, peas, lentils, chickpeas, and nuts have penetrated the European market. These proteins are available in a wide variety of flavors and types, attracting consumers on a large scale. The United Kingdom is estimated to capture a CAGR of 4.5% during the forecast period.

Furthermore, the livestock industry present in the European region is contributing to the growth of the market. Livestock owners are investing in different plant-based proteins to keep animals healthy. It, in turn, is creating opportunities for alternative protein markets in the region. Thus, for the above reasons, Europe is expected to possess a 25% market share for alternative proteins in 2022.

Lactose Intolerant Population Investing in Alternative Proteins in Asia Pacific?

Start-ups and international players launching newer products

Countries such as China and India are accelerating the growth of the protein alternative market owing to the growing lactose-intolerant population in the region. In addition, sourcing protein from organic food components is easier in the Asia Pacific owing to the large agriculture sector. Not only is the region manufacturing alternative protein on a large scale, but it is also supplying the same to other regions.

Furthermore, research and development activities and an increase in start-ups innovating different kinds of alternative proteins work in favor of the market. Asia Pacific is comparatively a newer market for alternative proteins. Thus, international players are launching alternative proteins to strengthen their regional presence. Thus, Asia Pacific is expected to procure an 11.7% market share for alternative proteins in 2022. China and India are estimated to secure a CAGR of 5.3% and 29.5%, respectively, by 2033.

Start-Ups for Alternative Protein Market

Key start-up players in the global alternative protein industry are Alver, Amai Proteins, Plantable Foods, Mycorena, Innovopro, Leaf Protein Co, Mushroom Meat Co, Kabocha, Genesea, Meatless Kingdom, Green Rebel Foods, and Umami Limited.

  • In June 2021, Green Rebel Foods unveiled Asia’s plant-based whole-cut steak to meet the region's growing demand for vegan meat. These steaks are cholesterol-free and have fewer saturated fat levels, making them healthy.
  • Leaf Protein Co, a key player in the market, uses properties technology to produce rubisco protein that can be added to plant-based foods, including dairy and meats.

Get the data you need at a Fraction of the cost

Personalize your report by choosing insights you need
and save 40%!

Market Competition

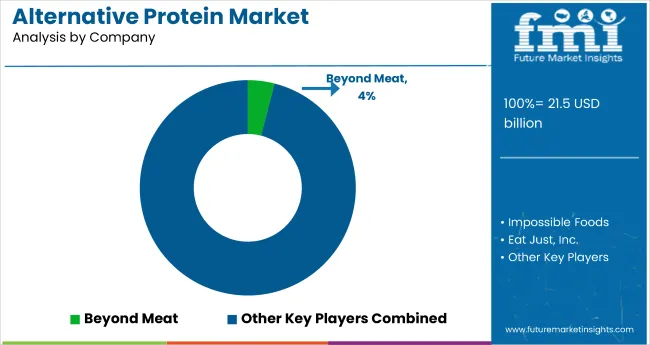
Key players play a vital role in the global market by launching improved products and adopting advanced technologies. These players invest heavily in research and development activities to upsurge the global market.

Other Players in the Global Market are:

  • Cargill Incorporation
  • Royal DSM NV
  • AMCO Proteins
  • Puris
  • Axiom Foods
  • Darling Ingredients
  • Innovafeed
  • Lallemand Inc
  • Hamlet Protein
  • Archer Daniel Midland Company
  • AB Mauri
  • Soja Protein
  • Angel Yeast
  • Calysta Inc.

Market players are focusing on collaborating for strategies such as partnerships, product launch mergers & acquisitions, for applications such as food and animal feed.

Recent Developments in the Global Market are:

  • In December 2021, Royal DSM NV completed the acquisition of Vestkorn Miling, Europe’s leading producer of pea and bean-derived ingredients. Through this acquisition, the company is focusing on expanding its alternative protein portfolio.
  • Axiom Food has launched new versions of VegOtein TX Texturized pea protein for vegan and processed meats. This pea protein can be used in a variety of dishes as it is vegan, healthy, and nutritious.

Scope of Report

Attribute Details
Forecast Period 2023 to 2033
Historical Data Available for 2018 to 2022
Market Analysis US$ billion for Value
Key Countries Covered United States, United Kingdom, Japan, India, China, Australia, Germany
Key Segments Covered Source, Application, Region
Key Companies Profiled Cargill Incorporation; Royal DSM NV; AMCO Proteins; Puris; Axiom Foods; Darling Ingredients; Innovafeed; Lallemand Inc; Hamlet Protein; Archer Daniel Midland Company; AB Mauri; Soja Protein; Angel Yeast; Calysta Inc.
Report Coverage Market Forecast, Company Share Analysis, Competition Intelligence, DROT Analysis, Market Dynamics and Challenges, and Strategic Growth Initiatives
Customization & Pricing Available upon Request

Alternative Protein Market by Category

By Source:

  • Insect-based
  • Microbial-based
    • Bacteria
    • Yeast
    • Algae
    • Fungi
    • Others
  • Plant-based Alternative Protein
    • Soy Protein Isolates
    • Soy Protein Concentrates
    • Fermented Soy Protein
    • Duckweed Protein
    • Others
  • Other Alternative Protein Sources

By Application:

  • Food & Beverage
  • Cattle
  • Aquaculture
  • Animal Feed
  • Pet Food
  • Equine
  • Other Applications

By Region:

  • North America
  • Latin America
  • Europe
  • Asia Pacific
  • Middle East and Africa

Frequently Asked Questions

How is the Alternative Protein Market Growing?

The alternative protein market is predicted to expand at a 19% CAGR through 2033.

Which Sector Drives the Alternative Protein Market?

Animal feed sector drives the alternative protein market.

What is the Future Scope of Growth for the Alternative Protein Market?

The alternative protein market is expected to surpass US$ 423 billion by 2033.

What is the Alternative Protein Market Size?

The alternative protein market is anticipated to be US$ 76.3 billion in 2023.

Which Country Dominates the Alternative Protein Market?

The United States is dominating the global alternative protein market by 2033.

Table of Content

1. Executive Summary

    1.1. Global Market Outlook

    1.2. Demand-side Trends

    1.3. Supply-side Trends

    1.4. Technology Roadmap Analysis

    1.5. Analysis and Recommendations

2. Market Overview

    2.1. Market Coverage / Taxonomy

    2.2. Market Definition / Scope / Limitations

3. Market Background

    3.1. Market Dynamics

        3.1.1. Drivers

        3.1.2. Restraints

        3.1.3. Opportunity

        3.1.4. Trends

    3.2. Scenario Forecast

        3.2.1. Demand in Optimistic Scenario

        3.2.2. Demand in Likely Scenario

        3.2.3. Demand in Conservative Scenario

    3.3. Opportunity Map Analysis

    3.4. Product Life Cycle Analysis

    3.5. Supply Chain Analysis

        3.5.1. Supply Side Participants and their Roles

            3.5.1.1. Producers

            3.5.1.2. Mid-Level Participants (Traders/ Agents/ Brokers)

            3.5.1.3. Wholesalers and Distributors

        3.5.2. Value Added and Value Created at Node in the Supply Chain

        3.5.3. List of Raw Material Suppliers

        3.5.4. List of Existing and Potential Buyer’s

    3.6. Investment Feasibility Matrix

    3.7. Value Chain Analysis

        3.7.1. Profit Margin Analysis

        3.7.2. Wholesalers and Distributors

        3.7.3. Retailers

    3.8. PESTLE and Porter’s Analysis

    3.9. Regulatory Landscape

        3.9.1. By Key Regions

        3.9.2. By Key Countries

    3.10. Regional Parent Market Outlook

    3.11. Production and Consumption Statistics

    3.12. Import and Export Statistics

4. Global Market Analysis 2018 to 2022 and Forecast, 2023 to 2033

    4.1. Historical Market Size Value (US$ Million) & Volume (Tons) Analysis, 2018 to 2022

    4.2. Current and Future Market Size Value (US$ Million) & Volume (Tons) Projections, 2023 to 2033

        4.2.1. Y-o-Y Growth Trend Analysis

        4.2.2. Absolute $ Opportunity Analysis

5. Global Market Analysis 2018 to 2022 and Forecast 2023 to 2033, By Source

    5.1. Introduction / Key Findings

    5.2. Historical Market Size Value (US$ Million) & Volume (Tons) Analysis By Source, 2018 to 2022

    5.3. Current and Future Market Size Value (US$ Million) & Volume (Tons) Analysis and Forecast By Source, 2023 to 2033

        5.3.1. Insect-based

        5.3.2. Microbial-based

            5.3.2.1. Bacteria

            5.3.2.2. Yeast

            5.3.2.3. Algae

            5.3.2.4. Fungi

            5.3.2.5. Others

        5.3.3. Plant-based

            5.3.3.1. Soy Protein Isolates

            5.3.3.2. Soy Protein Concentrates

            5.3.3.3. Fermented Soy Protein

            5.3.3.4. Duckweed Protein

            5.3.3.5. Others

        5.3.4. Others

    5.4. Y-o-Y Growth Trend Analysis By Source, 2018 to 2022

    5.5. Absolute $ Opportunity Analysis By Source, 2023 to 2033

6. Global Market Analysis 2018 to 2022 and Forecast 2023 to 2033, By Application

    6.1. Introduction / Key Findings

    6.2. Historical Market Size Value (US$ Million) & Volume (Tons) Analysis By Application, 2018 to 2022

    6.3. Current and Future Market Size Value (US$ Million) & Volume (Tons) Analysis and Forecast By Application, 2023 to 2033

        6.3.1. Food & Beverage

        6.3.2. Cattle

        6.3.3. Aquaculture

        6.3.4. Animal Feed

        6.3.5. Pet Food

        6.3.6. Equine

        6.3.7. Others

    6.4. Y-o-Y Growth Trend Analysis By Application, 2018 to 2022

    6.5. Absolute $ Opportunity Analysis By Application, 2023 to 2033

7. Global Market Analysis 2018 to 2022 and Forecast 2023 to 2033, By Region

    7.1. Introduction

    7.2. Historical Market Size Value (US$ Million) & Volume (Tons) Analysis By Region, 2018 to 2022

    7.3. Current Market Size Value (US$ Million) & Volume (Tons) Analysis and Forecast By Region, 2023 to 2033

        7.3.1. North America

        7.3.2. Latin America

        7.3.3. Western Europe

        7.3.4. Eastern Europe

        7.3.5. South Asia and Pacific

        7.3.6. East Asia

        7.3.7. Middle East and Africa

    7.4. Market Attractiveness Analysis By Region

8. North America Market Analysis 2018 to 2022 and Forecast 2023 to 2033, By Country

    8.1. Historical Market Size Value (US$ Million) & Volume (Tons) Trend Analysis By Market Taxonomy, 2018 to 2022

    8.2. Market Size Value (US$ Million) & Volume (Tons) Forecast By Market Taxonomy, 2023 to 2033

        8.2.1. By Country

            8.2.1.1. USA

            8.2.1.2. Canada

        8.2.2. By Source

        8.2.3. By Application

    8.3. Market Attractiveness Analysis

        8.3.1. By Country

        8.3.2. By Source

        8.3.3. By Application

    8.4. Key Takeaways

9. Latin America Market Analysis 2018 to 2022 and Forecast 2023 to 2033, By Country

    9.1. Historical Market Size Value (US$ Million) & Volume (Tons) Trend Analysis By Market Taxonomy, 2018 to 2022

    9.2. Market Size Value (US$ Million) & Volume (Tons) Forecast By Market Taxonomy, 2023 to 2033

        9.2.1. By Country

            9.2.1.1. Brazil

            9.2.1.2. Mexico

            9.2.1.3. Rest of Latin America

        9.2.2. By Source

        9.2.3. By Application

    9.3. Market Attractiveness Analysis

        9.3.1. By Country

        9.3.2. By Source

        9.3.3. By Application

    9.4. Key Takeaways

10. Western Europe Market Analysis 2018 to 2022 and Forecast 2023 to 2033, By Country

    10.1. Historical Market Size Value (US$ Million) & Volume (Tons) Trend Analysis By Market Taxonomy, 2018 to 2022

    10.2. Market Size Value (US$ Million) & Volume (Tons) Forecast By Market Taxonomy, 2023 to 2033

        10.2.1. By Country

            10.2.1.1. Germany

            10.2.1.2. UK

            10.2.1.3. France

            10.2.1.4. Spain

            10.2.1.5. Italy

            10.2.1.6. Rest of Western Europe

        10.2.2. By Source

        10.2.3. By Application

    10.3. Market Attractiveness Analysis

        10.3.1. By Country

        10.3.2. By Source

        10.3.3. By Application

    10.4. Key Takeaways

11. Eastern Europe Market Analysis 2018 to 2022 and Forecast 2023 to 2033, By Country

    11.1. Historical Market Size Value (US$ Million) & Volume (Tons) Trend Analysis By Market Taxonomy, 2018 to 2022

    11.2. Market Size Value (US$ Million) & Volume (Tons) Forecast By Market Taxonomy, 2023 to 2033

        11.2.1. By Country

            11.2.1.1. Poland

            11.2.1.2. Russia

            11.2.1.3. Czech Republic

            11.2.1.4. Romania

            11.2.1.5. Rest of Eastern Europe

        11.2.2. By Source

        11.2.3. By Application

    11.3. Market Attractiveness Analysis

        11.3.1. By Country

        11.3.2. By Source

        11.3.3. By Application

    11.4. Key Takeaways

12. South Asia and Pacific Market Analysis 2018 to 2022 and Forecast 2023 to 2033, By Country

    12.1. Historical Market Size Value (US$ Million) & Volume (Tons) Trend Analysis By Market Taxonomy, 2018 to 2022

    12.2. Market Size Value (US$ Million) & Volume (Tons) Forecast By Market Taxonomy, 2023 to 2033

        12.2.1. By Country

            12.2.1.1. India

            12.2.1.2. Bangladesh

            12.2.1.3. Australia

            12.2.1.4. New Zealand

            12.2.1.5. Rest of South Asia and Pacific

        12.2.2. By Source

        12.2.3. By Application

    12.3. Market Attractiveness Analysis

        12.3.1. By Country

        12.3.2. By Source

        12.3.3. By Application

    12.4. Key Takeaways

13. East Asia Market Analysis 2018 to 2022 and Forecast 2023 to 2033, By Country

    13.1. Historical Market Size Value (US$ Million) & Volume (Tons) Trend Analysis By Market Taxonomy, 2018 to 2022

    13.2. Market Size Value (US$ Million) & Volume (Tons) Forecast By Market Taxonomy, 2023 to 2033

        13.2.1. By Country

            13.2.1.1. China

            13.2.1.2. Japan

            13.2.1.3. South Korea

        13.2.2. By Source

        13.2.3. By Application

    13.3. Market Attractiveness Analysis

        13.3.1. By Country

        13.3.2. By Source

        13.3.3. By Application

    13.4. Key Takeaways

14. Middle East and Africa Market Analysis 2018 to 2022 and Forecast 2023 to 2033, By Country

    14.1. Historical Market Size Value (US$ Million) & Volume (Tons) Trend Analysis By Market Taxonomy, 2018 to 2022

    14.2. Market Size Value (US$ Million) & Volume (Tons) Forecast By Market Taxonomy, 2023 to 2033

        14.2.1. By Country

            14.2.1.1. GCC Countries

            14.2.1.2. South Africa

            14.2.1.3. Israel

            14.2.1.4. Rest of MEA

        14.2.2. By Source

        14.2.3. By Application

    14.3. Market Attractiveness Analysis

        14.3.1. By Country

        14.3.2. By Source

        14.3.3. By Application

    14.4. Key Takeaways

15. Key Countries Market Analysis

    15.1. USA

        15.1.1. Pricing Analysis

        15.1.2. Market Share Analysis, 2022

            15.1.2.1. By Source

            15.1.2.2. By Application

    15.2. Canada

        15.2.1. Pricing Analysis

        15.2.2. Market Share Analysis, 2022

            15.2.2.1. By Source

            15.2.2.2. By Application

    15.3. Brazil

        15.3.1. Pricing Analysis

        15.3.2. Market Share Analysis, 2022

            15.3.2.1. By Source

            15.3.2.2. By Application

    15.4. Mexico

        15.4.1. Pricing Analysis

        15.4.2. Market Share Analysis, 2022

            15.4.2.1. By Source

            15.4.2.2. By Application

    15.5. Germany

        15.5.1. Pricing Analysis

        15.5.2. Market Share Analysis, 2022

            15.5.2.1. By Source

            15.5.2.2. By Application

    15.6. UK

        15.6.1. Pricing Analysis

        15.6.2. Market Share Analysis, 2022

            15.6.2.1. By Source

            15.6.2.2. By Application

    15.7. France

        15.7.1. Pricing Analysis

        15.7.2. Market Share Analysis, 2022

            15.7.2.1. By Source

            15.7.2.2. By Application

    15.8. Spain

        15.8.1. Pricing Analysis

        15.8.2. Market Share Analysis, 2022

            15.8.2.1. By Source

            15.8.2.2. By Application

    15.9. Italy

        15.9.1. Pricing Analysis

        15.9.2. Market Share Analysis, 2022

            15.9.2.1. By Source

            15.9.2.2. By Application

    15.10. Poland

        15.10.1. Pricing Analysis

        15.10.2. Market Share Analysis, 2022

            15.10.2.1. By Source

            15.10.2.2. By Application

    15.11. Russia

        15.11.1. Pricing Analysis

        15.11.2. Market Share Analysis, 2022

            15.11.2.1. By Source

            15.11.2.2. By Application

    15.12. Czech Republic

        15.12.1. Pricing Analysis

        15.12.2. Market Share Analysis, 2022

            15.12.2.1. By Source

            15.12.2.2. By Application

    15.13. Romania

        15.13.1. Pricing Analysis

        15.13.2. Market Share Analysis, 2022

            15.13.2.1. By Source

            15.13.2.2. By Application

    15.14. India

        15.14.1. Pricing Analysis

        15.14.2. Market Share Analysis, 2022

            15.14.2.1. By Source

            15.14.2.2. By Application

    15.15. Bangladesh

        15.15.1. Pricing Analysis

        15.15.2. Market Share Analysis, 2022

            15.15.2.1. By Source

            15.15.2.2. By Application

    15.16. Australia

        15.16.1. Pricing Analysis

        15.16.2. Market Share Analysis, 2022

            15.16.2.1. By Source

            15.16.2.2. By Application

    15.17. New Zealand

        15.17.1. Pricing Analysis

        15.17.2. Market Share Analysis, 2022

            15.17.2.1. By Source

            15.17.2.2. By Application

    15.18. China

        15.18.1. Pricing Analysis

        15.18.2. Market Share Analysis, 2022

            15.18.2.1. By Source

            15.18.2.2. By Application

    15.19. Japan

        15.19.1. Pricing Analysis

        15.19.2. Market Share Analysis, 2022

            15.19.2.1. By Source

            15.19.2.2. By Application

    15.20. South Korea

        15.20.1. Pricing Analysis

        15.20.2. Market Share Analysis, 2022

            15.20.2.1. By Source

            15.20.2.2. By Application

    15.21. GCC Countries

        15.21.1. Pricing Analysis

        15.21.2. Market Share Analysis, 2022

            15.21.2.1. By Source

            15.21.2.2. By Application

    15.22. South Africa

        15.22.1. Pricing Analysis

        15.22.2. Market Share Analysis, 2022

            15.22.2.1. By Source

            15.22.2.2. By Application

    15.23. Israel

        15.23.1. Pricing Analysis

        15.23.2. Market Share Analysis, 2022

            15.23.2.1. By Source

            15.23.2.2. By Application

16. Market Structure Analysis

    16.1. Competition Dashboard

    16.2. Competition Benchmarking

    16.3. Market Share Analysis of Top Players

        16.3.1. By Regional

        16.3.2. By Source

        16.3.3. By Application

17. Competition Analysis

    17.1. Competition Deep Dive

        17.1.1. Cargill Incorporation

            17.1.1.1. Overview

            17.1.1.2. Product Portfolio

            17.1.1.3. Profitability by Market Segments

            17.1.1.4. Sales Footprint

            17.1.1.5. Strategy Overview

                17.1.1.5.1. Marketing Strategy

                17.1.1.5.2. Product Strategy

                17.1.1.5.3. Channel Strategy

        17.1.2. Royal DSM NV

            17.1.2.1. Overview

            17.1.2.2. Product Portfolio

            17.1.2.3. Profitability by Market Segments

            17.1.2.4. Sales Footprint

            17.1.2.5. Strategy Overview

                17.1.2.5.1. Marketing Strategy

                17.1.2.5.2. Product Strategy

                17.1.2.5.3. Channel Strategy

        17.1.3. AMCO Proteins

            17.1.3.1. Overview

            17.1.3.2. Product Portfolio

            17.1.3.3. Profitability by Market Segments

            17.1.3.4. Sales Footprint

            17.1.3.5. Strategy Overview

                17.1.3.5.1. Marketing Strategy

                17.1.3.5.2. Product Strategy

                17.1.3.5.3. Channel Strategy

        17.1.4. Puris

            17.1.4.1. Overview

            17.1.4.2. Product Portfolio

            17.1.4.3. Profitability by Market Segments

            17.1.4.4. Sales Footprint

            17.1.4.5. Strategy Overview

                17.1.4.5.1. Marketing Strategy

                17.1.4.5.2. Product Strategy

                17.1.4.5.3. Channel Strategy

        17.1.5. Axiom Foods

            17.1.5.1. Overview

            17.1.5.2. Product Portfolio

            17.1.5.3. Profitability by Market Segments

            17.1.5.4. Sales Footprint

            17.1.5.5. Strategy Overview

                17.1.5.5.1. Marketing Strategy

                17.1.5.5.2. Product Strategy

                17.1.5.5.3. Channel Strategy

        17.1.6. Darling Ingredients

            17.1.6.1. Overview

            17.1.6.2. Product Portfolio

            17.1.6.3. Profitability by Market Segments

            17.1.6.4. Sales Footprint

            17.1.6.5. Strategy Overview

                17.1.6.5.1. Marketing Strategy

                17.1.6.5.2. Product Strategy

                17.1.6.5.3. Channel Strategy

        17.1.7. Innovafeed

            17.1.7.1. Overview

            17.1.7.2. Product Portfolio

            17.1.7.3. Profitability by Market Segments

            17.1.7.4. Sales Footprint

            17.1.7.5. Strategy Overview

                17.1.7.5.1. Marketing Strategy

                17.1.7.5.2. Product Strategy

                17.1.7.5.3. Channel Strategy

        17.1.8. Lallemand Inc.

            17.1.8.1. Overview

            17.1.8.2. Product Portfolio

            17.1.8.3. Profitability by Market Segments

            17.1.8.4. Sales Footprint

            17.1.8.5. Strategy Overview

                17.1.8.5.1. Marketing Strategy

                17.1.8.5.2. Product Strategy

                17.1.8.5.3. Channel Strategy

        17.1.9. Hamlet Protein

            17.1.9.1. Overview

            17.1.9.2. Product Portfolio

            17.1.9.3. Profitability by Market Segments

            17.1.9.4. Sales Footprint

            17.1.9.5. Strategy Overview

                17.1.9.5.1. Marketing Strategy

                17.1.9.5.2. Product Strategy

                17.1.9.5.3. Channel Strategy

        17.1.10. Archer Daniel Midland Company

            17.1.10.1. Overview

            17.1.10.2. Product Portfolio

            17.1.10.3. Profitability by Market Segments

            17.1.10.4. Sales Footprint

            17.1.10.5. Strategy Overview

                17.1.10.5.1. Marketing Strategy

                17.1.10.5.2. Product Strategy

                17.1.10.5.3. Channel Strategy

        17.1.11. AB Mauri

            17.1.11.1. Overview

            17.1.11.2. Product Portfolio

            17.1.11.3. Profitability by Market Segments

            17.1.11.4. Sales Footprint

            17.1.11.5. Strategy Overview

                17.1.11.5.1. Marketing Strategy

                17.1.11.5.2. Product Strategy

                17.1.11.5.3. Channel Strategy

        17.1.12. Soja Protein

            17.1.12.1. Overview

            17.1.12.2. Product Portfolio

            17.1.12.3. Profitability by Market Segments

            17.1.12.4. Sales Footprint

            17.1.12.5. Strategy Overview

                17.1.12.5.1. Marketing Strategy

                17.1.12.5.2. Product Strategy

                17.1.12.5.3. Channel Strategy

        17.1.13. Ingredion

            17.1.13.1. Overview

            17.1.13.2. Product Portfolio

            17.1.13.3. Profitability by Market Segments

            17.1.13.4. Sales Footprint

            17.1.13.5. Strategy Overview

                17.1.13.5.1. Marketing Strategy

                17.1.13.5.2. Product Strategy

                17.1.13.5.3. Channel Strategy

        17.1.14. Ynsect

            17.1.14.1. Overview

            17.1.14.2. Product Portfolio

            17.1.14.3. Profitability by Market Segments

            17.1.14.4. Sales Footprint

            17.1.14.5. Strategy Overview

                17.1.14.5.1. Marketing Strategy

                17.1.14.5.2. Product Strategy

                17.1.14.5.3. Channel Strategy

        17.1.15. Angel Yeast

            17.1.15.1. Overview

            17.1.15.2. Product Portfolio

            17.1.15.3. Profitability by Market Segments

            17.1.15.4. Sales Footprint

            17.1.15.5. Strategy Overview

                17.1.15.5.1. Marketing Strategy

                17.1.15.5.2. Product Strategy

                17.1.15.5.3. Channel Strategy

        17.1.16. Calysta Inc.

            17.1.16.1. Overview

            17.1.16.2. Product Portfolio

            17.1.16.3. Profitability by Market Segments

            17.1.16.4. Sales Footprint

            17.1.16.5. Strategy Overview

                17.1.16.5.1. Marketing Strategy

                17.1.16.5.2. Product Strategy

                17.1.16.5.3. Channel Strategy

18. Assumptions & Acronyms Used

19. Research Methodology

Recommendations

Food and Beverage

Plant-Based Protein Market

October 2024

REP-GB-11442

306 pages

Food and Beverage

Soy Protein Isolate Market

March 2024

REP-GB-5832

350 pages

Explore Food and Beverage Insights

View Reports
Future Market Insights

Alternative Protein Market

Schedule a Call