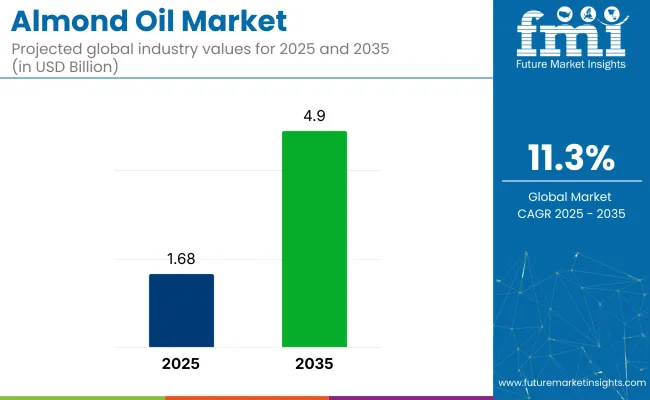
The anticipated value of the almond oil market in 2023 is projected to reach US$ 1.356 billion, with estimates indicating a substantial increase to US$ 3.9 billion by 2033. From 2023 to 2033, the global almond oil industry is forecasted to experience a CAGR of 11.0%.
Growth is attributed to the government organizations, such as the FDA, which have initiated initiatives to increase the use of natural ingredients in food, pharmaceuticals, and cosmetics.
Almond oil extracted from sweet or bitter almonds is an excellent source of unsaturated fatty acids and phytosterols. It contains more vitamin E than other nut oils and has excellent moisturizing properties.
The market's growth is driven by a rise in the production of aromatherapy products, an increase in customers' preference toward cosmetic products containing natural ingredients, and urbanization. Moreover, growth in applications of almond oil in the pharmaceutical industry.
Changes in lifestyles and rise in disposable incomes are other factors that supplement the growth of the almond oil market growth. However, the high price of almond oil may hinder market growth. Nevertheless, the increase in demand from emerging economies such as China and India and government regulations supporting using natural and organic ingredients in cosmetic formulations provide great opportunities for market growth.
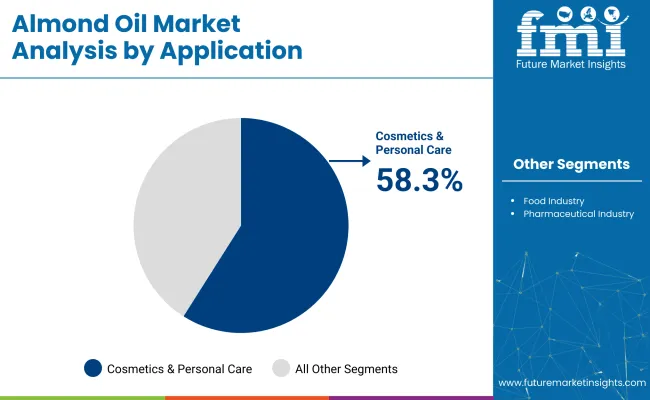
The almond oil industry gained much traction in recent years owing to extensive applications in the cosmetics & personal care industry. Since the previous decade, there has been an increased tilt toward natural and organic ingredient formulations.
On the contrary, excessive almond oil consumption or usage may lead to weight gain, increased cholesterol, or the possibility of developing allergic reactions.
Almond Oil Market (2018 to 2022)
Attributes | Details |
---|---|
Market HCAGR | 3.5% |
Market Size - 2018 | US$ 1.13 billion |
Market Size - 2022 | US$ 1.303 billion |
Almond Oil Market (2023 to 2033)
Attributes | Details |
---|---|
Market CAGR | 11% |
Market Size - 2023 | US$ 1.356 billion |
Market Size - 2033 | US$ 3.9 billion |
Don't pay for what you don't need
Customize your report by selecting specific countries or regions and save 30%!
The almond oil market witnessed significant growth between 2018 and 2022. Increasing consumer awareness about the health benefits of almond oil, such as its high vitamin E content and potential for improving skin and hair health, drove the market expansion. The growing demand for natural and organic cosmetic products further fueled the market growth.
The almond oil industry is expected to continue its upward trajectory. Factors such as rising disposable incomes, changing lifestyles, and the growing preference for natural and sustainable skincare products are anticipated to expand the market in the coming years.
Trailblazers of Success: Prominent Drivers Shaping the Demand for Almond Oil
The reduced consumption of beverages out-of-home premises and the disruption of a supply chain is one of the key factors expected to boost the market growth of almond oil during the forecast period.
In the forthcoming years, the consumption of almond oil is expected to increase as people use almond oil in the cosmetics industry as an excipient, reepithelization agent, lubricant, and sebum-restoring agent, which is another factor that is anticipated to accelerate the market growth of almond oil over the analysis period.
Almond oil does not cause side effects, as it is of natural origin. Unlike synthetic oil, naturally produced almond oil neither affects the body functions nor leaves toxic residues in the body, which, in turn, is expected to propel the use of almond oil in cosmetic formulations across the globe.
Government organizations, such as FDA, have initiated initiatives to increase the use of natural ingredients in food, pharmaceuticals, and cosmetics. Favorable government regulations have paved the way for new entrants and expanded the market penetration of existing stakeholders.
Favorable government initiatives and regulations are anticipated to offer lucrative growth opportunities to almond oil manufacturers. All these factors are expected to fuel the growth of the almond oil market during the forecast period.
From Orchard to Bottle: Overcoming Hurdles in the Almond Oil Industry
Despite its extensive applications across various industries, the almond oil market needs challenges or obstacles. The high cost of almond oil is one of the key factors expected to impede the market growth of almond oil during the forecast period.
Despite Spain being a leading almond producer in Europe and the state of California in the United States, North America, and Europe find it expensive to source almond oil. This is mostly due to an inhospitable climate across most regions of the continents.
The ideal temperature for cultivating almonds ranges from 30 to 35o C, and cool winters for plant growth and kernel filling. While almond flowers can typically tolerate low temperatures up to -2.2 o C, blossoms at the petal fall stage are damaged at 0.5 o C to -1.1 o C. Hence, they need to rely on imports of almond oil, which are often costly.
Excessive almond oil consumption or usage may lead to weight gain, increased cholesterol, or the possibility of developing allergic reactions. The symptoms of an allergic reaction caused due to almond oil might include nausea, diarrhea, difficulty breathing, and difficulty swallowing.
Attributes | Details |
---|---|
United States Market Share - 2023 | 21.10% |
Australia Market Share - 2023 | 2.3% |
North America is expected to hold significant growth opportunities for almond oil and reach a share of 25.5% in 2023. In the forthcoming decade, the almond oil market in North America is anticipated to receive impetus as consumers gravitate towards consuming more natural or organic food products. The shift towards organic is especially prevalent in the cosmetics industry, with dawning consumer awareness regarding the adverse impacts of chemical cosmetics and concerns about animal cruelty.
Almond oil formulations are incorporated into the pharmaceutical industry due to their purported anti-inflammatory, immunity-boosting, and anti-hepatotoxicity effects. Studies have linked almond oil consumption with improvements in bowel activity, thus, proving an effective antidote to irritable bowel syndrome. Furthermore, almond oil consumption reduces chronic cancer risk and elevates levels of so-called good cholesterol.
Attributes | Details |
---|---|
Japan Market Share - 2023 | 4.5% |
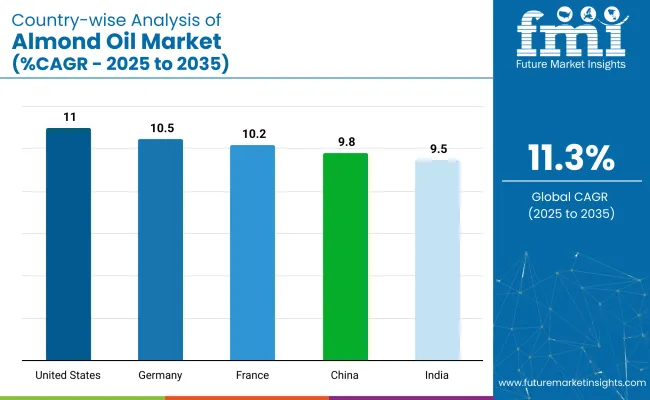
China Market CAGR (2023 to 2023) | 9.8% |
India Market CAGR (2023 to 2023) | 11.5% |
Asia Pacific is expected to grow with lucrative growth opportunities and reach a significant share of 23.4% in 2023. The almond oil industry in the Asia Pacific is a speedy-growing region in terms of revenue and volume in the global almond oil business. An increase in consumers' health concerns in developing countries, such as India and China, is expected to fuel the growth of the Asia Pacific almond oil industry.
The increase in almond oil as an essential oil in various applications such as pharmaceuticals and aromatherapy has contributed to the region's market growth.
The market is expected to surge rapidly in Asia Pacific, attributed to the region's dominant position concerning almond and almond oil production. Given almond oil's extensive moisturizing properties, applications abound in the cosmetics & personal care industry.
Attributes | Details |
---|---|
Germany Market Share - 2023 | 8% |
United Kingdom Market CAGR (2023 to 2023) | 12.5% |
Regarding regional platforms, Europe holds an enormous market share in the almond oil industry. The region is expected to surge to over 34.6% share from 2023 to 2033.
Germany may emerge as the most promising almond oil investment destination in forthcoming years. In contrast, given its dominant position, Spain is expected to lead the market throughout the region. Besides being used in cosmetic formulations, almond oil is consumed in its pure form throughout the region.
With a rising proportion of the population becoming gluten intolerant, healthcare practitioners are advocating the consumption of almond oil. Hence, its popularity is increasing throughout the region. The disease affects an estimated 1% of adults and children in Europe. A flourishing organic personal care sector, fueled by growing awareness regarding the benefits of natural and chemical-free ingredients, is expected to open new avenues.
The Middle East & Africa are expected to provide significant growth opportunities for the almond oil industry and reach a share of 12.3% in 2023.
The contributing factors to the market's growth in the region are its gluten-free quality and increasing popularity in the usage of almonds for producing food products such as bakery, breakfast cereals, snacks, and others. In addition, investing more in research and development to utilize almonds in this region contributes to its growth.
Segment | Type |
---|---|
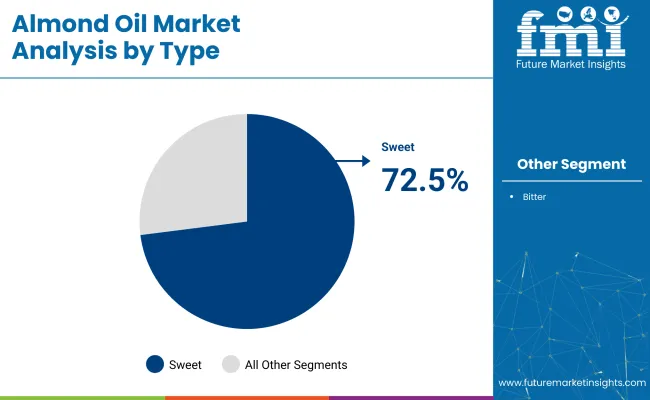
Segment Name | Sweet Almond Oil |
Segment Share | 60.30% |
The significant product category, sweet oil, is to develop at a CAGR of 13.3% due to its expanding use in the pharmaceutical, personal care, and cosmetics industries. Almond oil is a fantastic source of copper, magnesium, phosphorus, and vitamin E. Antioxidants are abundant in them, strengthening immunity and reducing inflammation. In addition to treating mouth, bladder, uterus, spleen, and breast cancers, it can also be used as a moderate laxative. It is frequently used to treat dry, chapped, and irritated skin in cosmetic products.
A 39.7% market share was held by bitter almond oil in 2023. Although this version is purified to remove these dangerous ingredients before usage, it still contains poisonous compounds. This kind of almond oil has several health advantages, including the ability to prevent the formation of fungi, alleviate pain and muscle spasms, eliminate intestinal worms and germs, have a calming effect, and function as a purgative. The substance can also flavor edibles after the poisons are removed.
Segment | Distribution Channel |
---|---|
Segment Name | Hypermarkets/Supermarkets |
Segment Share | 35.60% |
The almond oil market is segmented into several categories: hypermarkets and supermarkets, food specialty stores, pharmacies, cosmetic discounters, and other retail channels. From 2023 to 2033, the hypermarkets/supermarkets sector is expected to dominate, accounting for a sizable share and rising at a substantial CAGR of 13.2%.
Sales through these distribution channels are projected to increase with almond oil availability in hypermarkets, supermarkets, food specialty stores, pharmacies, and cosmetic discounters. Sales of almond oil have surged due to medical professionals advising its usage in treating skin conditions like psoriasis or acne.
Segment | End Use |
---|---|
Segment Name | Commercial Use |
Segment Share | 68.30% |
Get the data you need at a Fraction of the cost
Personalize your report by choosing insights you need
and save 40%!
There are many vital almond oil manufacturers in the almond oil industry, such as Tropical Almond, AAK, Flora, Go Jaivik Ingredients, Orgatma Organic Science, PR Enterprises, HaaliAgro, and AOS Products, among others, that are working hand-in-hand to provide the best-in-class Acrylic BoxCleaes for enhancing the global arena.
Many global start-ups in the almond oil business are stepping forward to match the requirements of the Almond Oil domain.
How can Manufacturers Scale their Businesses in the Almond Oil Market?
Due to numerous domestic and international competitors, the market needs to be more cohesive. To increase their consumer base, seasoned almond oil manufacturers and recent newcomers are introducing specialized products with added nutritional benefits. The almond oil manufacturers’ creative strategies are intended to improve their position in the market.
Leading almond oil manufacturers are expanding their geographic reach to achieve maximum technological penetration and client reach, particularly in industrialized nations. Other crucial success aspects that businesses have been concentrating on include establishing research and development centers and strategic alliances with investment firms to provide new creative technology in response to client demand. The almond oil manufacturers may likely focus on technological innovation geared towards underserved markets, particularly emerging nations.
Prominent Almond Oil Manufacturers
Company | Bajaj Consumer Care Ltd. |
---|---|
Strategy | Launch |
Details | In June 2022, Bajaj Consumer Care Ltd. announced its plans to launch new products in different categories under its flagship Bajaj Almond Drops brand as it seeks to tap into the equity of the popular hair oil label, according to a top company official. |
Company | Blue Diamond Growers |
---|---|
Strategy | Partnership |
Details | In February 2019, Blue Diamond Growers declared its partnership with Grupo Lala Sign. This partnership results in the distribution and sales of Almond Breeze. |
Europe is likely to lead the almond oil industry.
The market size is estimated to cross US$ 3.9 billion by 2033.
The almond oil industry is likely to record a value of US$ 1.356 billion in 2023.
The almond oil industry is likely to secure a CAGR of 11% through 2033.
The primary consumer of almond oil is the cosmetics industry.
1. Executive Summary
1.1. Global Market Outlook
1.2. Demand-side Trends
1.3. Supply-side Trends
1.4. Technology Roadmap Analysis
1.5. Analysis and Recommendations
2. Market Overview
2.1. Market Coverage / Taxonomy
2.2. Market Definition / Scope / Limitations
3. Market Background
3.1. Market Dynamics
3.1.1. Drivers
3.1.2. Restraints
3.1.3. Opportunity
3.1.4. Trends
3.2. Scenario Forecast
3.2.1. Demand in Optimistic Scenario
3.2.2. Demand in Likely Scenario
3.2.3. Demand in Conservative Scenario
3.3. Opportunity Map Analysis
3.4. Product Life Cycle Analysis
3.5. Supply Chain Analysis
3.5.1. Supply Side Participants and their Roles
3.5.1.1. Producers
3.5.1.2. Mid-Level Participants (Traders/ Agents/ Brokers)
3.5.1.3. Wholesalers and Distributors
3.5.2. Value Added and Value Created at Node in the Supply Chain
3.5.3. List of Raw Material Suppliers
3.5.4. List of Existing and Potential Buyer’s
3.6. Investment Feasibility Matrix
3.7. Value Chain Analysis
3.7.1. Profit Margin Analysis
3.7.2. Wholesalers and Distributors
3.7.3. Retailers
3.8. PESTLE and Porter’s Analysis
3.9. Regulatory Landscape
3.9.1. By Key Regions
3.9.2. By Key Countries
3.10. Regional Parent Market Outlook
3.11. Production and Consumption Statistics
3.12. Import and Export Statistics
4. Global Market Analysis 2018 to 2022 and Forecast, 2023 to 2033
4.1. Historical Market Size Value (US$ Million) & Volume (Liters) Analysis, 2018 to 2022
4.2. Current and Future Market Size Value (US$ Million) & Volume (Liters) Projections, 2023 to 2033
4.2.1. Y-o-Y Growth Trend Analysis
4.2.2. Absolute $ Opportunity Analysis
5. Global Market Analysis 2018 to 2022 and Forecast 2023 to 2033, By Type
5.1. Introduction / Key Findings
5.2. Historical Market Size Value (US$ Million) & Volume (Liters) Analysis By Type, 2018 to 2022
5.3. Current and Future Market Size Value (US$ Million) & Volume (Liters) Analysis and Forecast By Type, 2023 to 2033
5.3.1. Sweet
5.3.2. Bitter
5.4. Y-o-Y Growth Trend Analysis By Type, 2018 to 2022
5.5. Absolute $ Opportunity Analysis By Type, 2023 to 2033
6. Global Market Analysis 2018 to 2022 and Forecast 2023 to 2033, By Application
6.1. Introduction / Key Findings
6.2. Historical Market Size Value (US$ Million) & Volume (Liters) Analysis By Application, 2018 to 2022
6.3. Current and Future Market Size Value (US$ Million) & Volume (Liters) Analysis and Forecast By Application, 2023 to 2033
6.3.1. Cosmetics & Personal Care Products
6.3.2. Food Industry
6.3.3. Pharmaceutical Industry
6.4. Y-o-Y Growth Trend Analysis By Application, 2018 to 2022
6.5. Absolute $ Opportunity Analysis By Application, 2023 to 2033
7. Global Market Analysis 2018 to 2022 and Forecast 2023 to 2033, By End-Use
7.1. Introduction / Key Findings
7.2. Historical Market Size Value (US$ Million) & Volume (Liters) Analysis By End-Use, 2018 to 2022
7.3. Current and Future Market Size Value (US$ Million) & Volume (Liters) Analysis and Forecast By End-Use, 2023 to 2033
7.3.1. Commercial
7.3.2. Household
7.4. Y-o-Y Growth Trend Analysis By End-Use, 2018 to 2022
7.5. Absolute $ Opportunity Analysis By End-Use, 2023 to 2033
8. Global Market Analysis 2018 to 2022 and Forecast 2023 to 2033, By Distribution Channel
8.1. Introduction / Key Findings
8.2. Historical Market Size Value (US$ Million) & Volume (Liters) Analysis By Distribution Channel, 2018 to 2022
8.3. Current and Future Market Size Value (US$ Million) & Volume (Liters) Analysis and Forecast By Distribution Channel, 2023 to 2033
8.3.1. Hypermarkets/Supermarkets
8.3.2. Wholesaler/Distributor
8.3.3. Departmental Stores
8.3.4. Online Retail Stores
8.4. Y-o-Y Growth Trend Analysis By Distribution Channel, 2018 to 2022
8.5. Absolute $ Opportunity Analysis By Distribution Channel, 2023 to 2033
9. Global Market Analysis 2018 to 2022 and Forecast 2023 to 2033, By Region
9.1. Introduction
9.2. Historical Market Size Value (US$ Million) & Volume (Liters) Analysis By Region, 2018 to 2022
9.3. Current Market Size Value (US$ Million) & Volume (Liters) Analysis and Forecast By Region, 2023 to 2033
9.3.1. North America
9.3.2. Latin America
9.3.3. Western Europe
9.3.4. Eastern Europe
9.3.5. South Asia and Pacific
9.3.6. East Asia
9.3.7. Middle East and Africa
9.4. Market Attractiveness Analysis By Region
10. North America Market Analysis 2018 to 2022 and Forecast 2023 to 2033, By Country
10.1. Historical Market Size Value (US$ Million) & Volume (Liters) Trend Analysis By Market Taxonomy, 2018 to 2022
10.2. Market Size Value (US$ Million) & Volume (Liters) Forecast By Market Taxonomy, 2023 to 2033
10.2.1. By Country
10.2.1.1. USA
10.2.1.2. Canada
10.2.2. By Type
10.2.3. By Application
10.2.4. By End-Use
10.2.5. By Distribution Channel
10.3. Market Attractiveness Analysis
10.3.1. By Country
10.3.2. By Type
10.3.3. By Application
10.3.4. By End-Use
10.3.5. By Distribution Channel
10.4. Key Takeaways
11. Latin America Market Analysis 2018 to 2022 and Forecast 2023 to 2033, By Country
11.1. Historical Market Size Value (US$ Million) & Volume (Liters) Trend Analysis By Market Taxonomy, 2018 to 2022
11.2. Market Size Value (US$ Million) & Volume (Liters) Forecast By Market Taxonomy, 2023 to 2033
11.2.1. By Country
11.2.1.1. Brazil
11.2.1.2. Mexico
11.2.1.3. Rest of Latin America
11.2.2. By Type
11.2.3. By Application
11.2.4. By End-Use
11.2.5. By Distribution Channel
11.3. Market Attractiveness Analysis
11.3.1. By Country
11.3.2. By Type
11.3.3. By Application
11.3.4. By End-Use
11.3.5. By Distribution Channel
11.4. Key Takeaways
12. Western Europe Market Analysis 2018 to 2022 and Forecast 2023 to 2033, By Country
12.1. Historical Market Size Value (US$ Million) & Volume (Liters) Trend Analysis By Market Taxonomy, 2018 to 2022
12.2. Market Size Value (US$ Million) & Volume (Liters) Forecast By Market Taxonomy, 2023 to 2033
12.2.1. By Country
12.2.1.1. Germany
12.2.1.2. UK
12.2.1.3. France
12.2.1.4. Spain
12.2.1.5. Italy
12.2.1.6. Rest of Western Europe
12.2.2. By Type
12.2.3. By Application
12.2.4. By End-Use
12.2.5. By Distribution Channel
12.3. Market Attractiveness Analysis
12.3.1. By Country
12.3.2. By Type
12.3.3. By Application
12.3.4. By End-Use
12.3.5. By Distribution Channel
12.4. Key Takeaways
13. Eastern Europe Market Analysis 2018 to 2022 and Forecast 2023 to 2033, By Country
13.1. Historical Market Size Value (US$ Million) & Volume (Liters) Trend Analysis By Market Taxonomy, 2018 to 2022
13.2. Market Size Value (US$ Million) & Volume (Liters) Forecast By Market Taxonomy, 2023 to 2033
13.2.1. By Country
13.2.1.1. Poland
13.2.1.2. Russia
13.2.1.3. Czech Republic
13.2.1.4. Romania
13.2.1.5. Rest of Eastern Europe
13.2.2. By Type
13.2.3. By Application
13.2.4. By End-Use
13.2.5. By Distribution Channel
13.3. Market Attractiveness Analysis
13.3.1. By Country
13.3.2. By Type
13.3.3. By Application
13.3.4. By End-Use
13.3.5. By Distribution Channel
13.4. Key Takeaways
14. South Asia and Pacific Market Analysis 2018 to 2022 and Forecast 2023 to 2033, By Country
14.1. Historical Market Size Value (US$ Million) & Volume (Liters) Trend Analysis By Market Taxonomy, 2018 to 2022
14.2. Market Size Value (US$ Million) & Volume (Liters) Forecast By Market Taxonomy, 2023 to 2033
14.2.1. By Country
14.2.1.1. India
14.2.1.2. Bangladesh
14.2.1.3. Australia
14.2.1.4. New Zealand
14.2.1.5. Rest of South Asia and Pacific
14.2.2. By Type
14.2.3. By Application
14.2.4. By End-Use
14.2.5. By Distribution Channel
14.3. Market Attractiveness Analysis
14.3.1. By Country
14.3.2. By Type
14.3.3. By Application
14.3.4. By End-Use
14.3.5. By Distribution Channel
14.4. Key Takeaways
15. East Asia Market Analysis 2018 to 2022 and Forecast 2023 to 2033, By Country
15.1. Historical Market Size Value (US$ Million) & Volume (Liters) Trend Analysis By Market Taxonomy, 2018 to 2022
15.2. Market Size Value (US$ Million) & Volume (Liters) Forecast By Market Taxonomy, 2023 to 2033
15.2.1. By Country
15.2.1.1. China
15.2.1.2. Japan
15.2.1.3. South Korea
15.2.2. By Type
15.2.3. By Application
15.2.4. By End-Use
15.2.5. By Distribution Channel
15.3. Market Attractiveness Analysis
15.3.1. By Country
15.3.2. By Type
15.3.3. By Application
15.3.4. By End-Use
15.3.5. By Distribution Channel
15.4. Key Takeaways
16. Middle East and Africa Market Analysis 2018 to 2022 and Forecast 2023 to 2033, By Country
16.1. Historical Market Size Value (US$ Million) & Volume (Liters) Trend Analysis By Market Taxonomy, 2018 to 2022
16.2. Market Size Value (US$ Million) & Volume (Liters) Forecast By Market Taxonomy, 2023 to 2033
16.2.1. By Country
16.2.1.1. GCC Countries
16.2.1.2. South Africa
16.2.1.3. Israel
16.2.1.4. Rest of MEA
16.2.2. By Type
16.2.3. By Application
16.2.4. By End-Use
16.2.5. By Distribution Channel
16.3. Market Attractiveness Analysis
16.3.1. By Country
16.3.2. By Type
16.3.3. By Application
16.3.4. By End-Use
16.3.5. By Distribution Channel
16.4. Key Takeaways
17. Key Countries Market Analysis
17.1. USA
17.1.1. Pricing Analysis
17.1.2. Market Share Analysis, 2022
17.1.2.1. By Type
17.1.2.2. By Application
17.1.2.3. By End-Use
17.1.2.4. By Distribution Channel
17.2. Canada
17.2.1. Pricing Analysis
17.2.2. Market Share Analysis, 2022
17.2.2.1. By Type
17.2.2.2. By Application
17.2.2.3. By End-Use
17.2.2.4. By Distribution Channel
17.3. Brazil
17.3.1. Pricing Analysis
17.3.2. Market Share Analysis, 2022
17.3.2.1. By Type
17.3.2.2. By Application
17.3.2.3. By End-Use
17.3.2.4. By Distribution Channel
17.4. Mexico
17.4.1. Pricing Analysis
17.4.2. Market Share Analysis, 2022
17.4.2.1. By Type
17.4.2.2. By Application
17.4.2.3. By End-Use
17.4.2.4. By Distribution Channel
17.5. Germany
17.5.1. Pricing Analysis
17.5.2. Market Share Analysis, 2022
17.5.2.1. By Type
17.5.2.2. By Application
17.5.2.3. By End-Use
17.5.2.4. By Distribution Channel
17.6. UK
17.6.1. Pricing Analysis
17.6.2. Market Share Analysis, 2022
17.6.2.1. By Type
17.6.2.2. By Application
17.6.2.3. By End-Use
17.6.2.4. By Distribution Channel
17.7. France
17.7.1. Pricing Analysis
17.7.2. Market Share Analysis, 2022
17.7.2.1. By Type
17.7.2.2. By Application
17.7.2.3. By End-Use
17.7.2.4. By Distribution Channel
17.8. Spain
17.8.1. Pricing Analysis
17.8.2. Market Share Analysis, 2022
17.8.2.1. By Type
17.8.2.2. By Application
17.8.2.3. By End-Use
17.8.2.4. By Distribution Channel
17.9. Italy
17.9.1. Pricing Analysis
17.9.2. Market Share Analysis, 2022
17.9.2.1. By Type
17.9.2.2. By Application
17.9.2.3. By End-Use
17.9.2.4. By Distribution Channel
17.10. Poland
17.10.1. Pricing Analysis
17.10.2. Market Share Analysis, 2022
17.10.2.1. By Type
17.10.2.2. By Application
17.10.2.3. By End-Use
17.10.2.4. By Distribution Channel
17.11. Russia
17.11.1. Pricing Analysis
17.11.2. Market Share Analysis, 2022
17.11.2.1. By Type
17.11.2.2. By Application
17.11.2.3. By End-Use
17.11.2.4. By Distribution Channel
17.12. Czech Republic
17.12.1. Pricing Analysis
17.12.2. Market Share Analysis, 2022
17.12.2.1. By Type
17.12.2.2. By Application
17.12.2.3. By End-Use
17.12.2.4. By Distribution Channel
17.13. Romania
17.13.1. Pricing Analysis
17.13.2. Market Share Analysis, 2022
17.13.2.1. By Type
17.13.2.2. By Application
17.13.2.3. By End-Use
17.13.2.4. By Distribution Channel
17.14. India
17.14.1. Pricing Analysis
17.14.2. Market Share Analysis, 2022
17.14.2.1. By Type
17.14.2.2. By Application
17.14.2.3. By End-Use
17.14.2.4. By Distribution Channel
17.15. Bangladesh
17.15.1. Pricing Analysis
17.15.2. Market Share Analysis, 2022
17.15.2.1. By Type
17.15.2.2. By Application
17.15.2.3. By End-Use
17.15.2.4. By Distribution Channel
17.16. Australia
17.16.1. Pricing Analysis
17.16.2. Market Share Analysis, 2022
17.16.2.1. By Type
17.16.2.2. By Application
17.16.2.3. By End-Use
17.16.2.4. By Distribution Channel
17.17. New Zealand
17.17.1. Pricing Analysis
17.17.2. Market Share Analysis, 2022
17.17.2.1. By Type
17.17.2.2. By Application
17.17.2.3. By End-Use
17.17.2.4. By Distribution Channel
17.18. China
17.18.1. Pricing Analysis
17.18.2. Market Share Analysis, 2022
17.18.2.1. By Type
17.18.2.2. By Application
17.18.2.3. By End-Use
17.18.2.4. By Distribution Channel
17.19. Japan
17.19.1. Pricing Analysis
17.19.2. Market Share Analysis, 2022
17.19.2.1. By Type
17.19.2.2. By Application
17.19.2.3. By End-Use
17.19.2.4. By Distribution Channel
17.20. South Korea
17.20.1. Pricing Analysis
17.20.2. Market Share Analysis, 2022
17.20.2.1. By Type
17.20.2.2. By Application
17.20.2.3. By End-Use
17.20.2.4. By Distribution Channel
17.21. GCC Countries
17.21.1. Pricing Analysis
17.21.2. Market Share Analysis, 2022
17.21.2.1. By Type
17.21.2.2. By Application
17.21.2.3. By End-Use
17.21.2.4. By Distribution Channel
17.22. South Africa
17.22.1. Pricing Analysis
17.22.2. Market Share Analysis, 2022
17.22.2.1. By Type
17.22.2.2. By Application
17.22.2.3. By End-Use
17.22.2.4. By Distribution Channel
17.23. Israel
17.23.1. Pricing Analysis
17.23.2. Market Share Analysis, 2022
17.23.2.1. By Type
17.23.2.2. By Application
17.23.2.3. By End-Use
17.23.2.4. By Distribution Channel
18. Market Structure Analysis
18.1. Competition Dashboard
18.2. Competition Benchmarking
18.3. Market Share Analysis of Top Players
18.3.1. By Regional
18.3.2. By Type
18.3.3. By Application
18.3.4. By End-Use
18.3.5. By Distribution Channel
19. Competition Analysis
19.1. Competition Deep Dive
19.1.1. AOS Products Private Limited
19.1.1.1. Overview
19.1.1.2. Product Portfolio
19.1.1.3. Profitability by Market Segments
19.1.1.4. Sales Footprint
19.1.1.5. Strategy Overview
19.1.1.5.1. Marketing Strategy
19.1.1.5.2. Product Strategy
19.1.1.5.3. Channel Strategy
19.1.2. Ashwin Fine Chemicals & Pharmaceuticals
19.1.2.1. Overview
19.1.2.2. Product Portfolio
19.1.2.3. Profitability by Market Segments
19.1.2.4. Sales Footprint
19.1.2.5. Strategy Overview
19.1.2.5.1. Marketing Strategy
19.1.2.5.2. Product Strategy
19.1.2.5.3. Channel Strategy
19.1.3. Blue Diamond Growers Inc
19.1.3.1. Overview
19.1.3.2. Product Portfolio
19.1.3.3. Profitability by Market Segments
19.1.3.4. Sales Footprint
19.1.3.5. Strategy Overview
19.1.3.5.1. Marketing Strategy
19.1.3.5.2. Product Strategy
19.1.3.5.3. Channel Strategy
19.1.4. Caloy Quality Natural Oils
19.1.4.1. Overview
19.1.4.2. Product Portfolio
19.1.4.3. Profitability by Market Segments
19.1.4.4. Sales Footprint
19.1.4.5. Strategy Overview
19.1.4.5.1. Marketing Strategy
19.1.4.5.2. Product Strategy
19.1.4.5.3. Channel Strategy
19.1.5. Eden Botanicals
19.1.5.1. Overview
19.1.5.2. Product Portfolio
19.1.5.3. Profitability by Market Segments
19.1.5.4. Sales Footprint
19.1.5.5. Strategy Overview
19.1.5.5.1. Marketing Strategy
19.1.5.5.2. Product Strategy
19.1.5.5.3. Channel Strategy
19.1.6. Jiangxi Baicao Pharmaceutical Co., Ltd.
19.1.6.1. Overview
19.1.6.2. Product Portfolio
19.1.6.3. Profitability by Market Segments
19.1.6.4. Sales Footprint
19.1.6.5. Strategy Overview
19.1.6.5.1. Marketing Strategy
19.1.6.5.2. Product Strategy
19.1.6.5.3. Channel Strategy
19.1.7. Jiangxi Xuesong Natural Medicinal Oil Co., Ltd.
19.1.7.1. Overview
19.1.7.2. Product Portfolio
19.1.7.3. Profitability by Market Segments
19.1.7.4. Sales Footprint
19.1.7.5. Strategy Overview
19.1.7.5.1. Marketing Strategy
19.1.7.5.2. Product Strategy
19.1.7.5.3. Channel Strategy
19.1.8. Liberty Vegetable Oil Company
19.1.8.1. Overview
19.1.8.2. Product Portfolio
19.1.8.3. Profitability by Market Segments
19.1.8.4. Sales Footprint
19.1.8.5. Strategy Overview
19.1.8.5.1. Marketing Strategy
19.1.8.5.2. Product Strategy
19.1.8.5.3. Channel Strategy
19.1.9. Mountain Ocean
19.1.9.1. Overview
19.1.9.2. Product Portfolio
19.1.9.3. Profitability by Market Segments
19.1.9.4. Sales Footprint
19.1.9.5. Strategy Overview
19.1.9.5.1. Marketing Strategy
19.1.9.5.2. Product Strategy
19.1.9.5.3. Channel Strategy
19.1.10. NOW Foods
19.1.10.1. Overview
19.1.10.2. Product Portfolio
19.1.10.3. Profitability by Market Segments
19.1.10.4. Sales Footprint
19.1.10.5. Strategy Overview
19.1.10.5.1. Marketing Strategy
19.1.10.5.2. Product Strategy
19.1.10.5.3. Channel Strategy
20. Assumptions & Acronyms Used
21. Research Methodology
Explore Food and Beverage Insights
View Reports