Allergen-free Food Market Forecast and Outlook 2025 to 2035

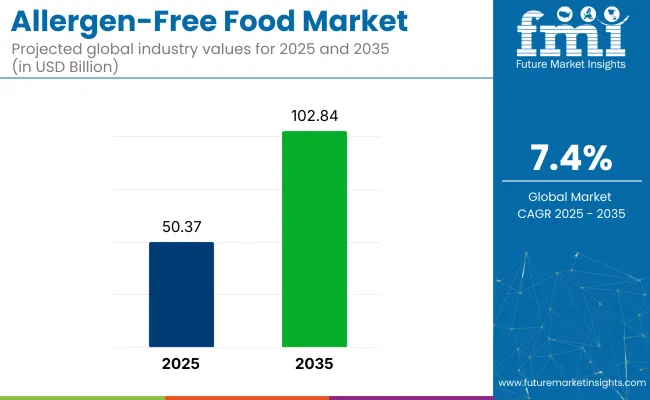
The global allergen-free food market is valued at USD 50.3 billion in 2025 and is anticipated to expand significantly to USD 102.8 billion by 2035, which shows a CAGR of 7.4% during the forecast period. This substantial market growth reflects the global shift towards healthier eating habits and the heightened demand for food products catering to individuals with specific dietary needs.

The market includes a wide range of allergen-free foods such as snacks, bakery items, dairy alternatives, and beverages, all designed to address allergies and intolerances like gluten, lactose, soy, nuts, and other common allergens. As the prevalence of food allergies rises worldwide, the importance of allergen-free labeling and certified safe products has become more critical to ensure consumer confidence and safety.

The market’s momentum is further accelerated by the growing health-conscious population, particularly in developed regions, where consumers are willing to pay premium prices for products perceived as clean-label and functional. Additionally, government regulations regarding allergen labeling and food safety standards have been tightened, pushing manufacturers to reformulate existing products and introduce new allergen-free alternatives.

The demand for dairy-free, nut-free, gluten-free, and sugar-free offerings is expanding beyond individuals with allergies to include those who are proactively avoiding allergens for perceived health benefits, thus broadening the consumer base. Moreover, the use of fermentation-based processes in developing allergen-free proteins is emerging as a transformative technology, allowing producers to create highly digestible, nutritious, and textured food options without triggering common allergic reactions.

Retail and distribution channels are also transforming the market landscape. Supermarkets, hypermarkets, and e-commerce platforms are dedicating entire sections to allergen-free products, while private-label offerings by giants such as Tesco, Whole Foods, and Walmart are intensifying market competition.

Subscription-based online meal kits and snack boxes that cater specifically to allergen-sensitive consumers are gaining traction, reflecting changing consumer buying patterns favoring convenience and customization. The combination of these driving factors, rising food intolerance prevalence, supportive regulatory frameworks, technological innovation in food processing, and evolving retail strategies, will continue to propel the allergen-free food market over the coming few years.

Metric  Value 
Industry Size (2025E)  USD 50.3 billion
Industry Value (2035F)  USD 102.8 billion
CAGR (2025 to 2035)  7.4%

Semi Annual Market Update

The below table presents a comparative assessment of the variation in CAGR over six months for the base year (2024) and current year (2025) for the global industry. This analysis reveals crucial shifts in market performance and indicates revenue realization patterns, thus providing stakeholders with a better vision of the growth trajectory over the year. The first half of the year, or H1, spans from January to June. The second half, H2, includes the months from July to December.

Particular Value CAGR
H1 2024 6.9% (2024 to 2034)
H2 2024 7.3% (2024 to 2034)
H1 2025 7.2% (2025 to 2035)
H2 2025 7.5% (2025 to 2035)

The global industry's predicted compound annual growth rate (CAGR) over a semi-annual period from 2025 to 2035 is shown in the above table. The business is anticipated to grow at a CAGR of 6.9% in the first half (H1) of 2024 and then slightly faster at 7.3% in the second half (H2) of the same year.

The CAGR is anticipated to decrease somewhat to 7.2% in the first half of 2025 and continues to grow at 7.5% in the second half. The industry saw a decline of 35 basis points in the first half (H1 2025) and an increase of 46 basis points in the second half (H2 2025).

Analyzing Allergen-Free Food Market by Top Investment Segments

Beverages: The Liquid Leader in Allergen-Free Innovation

Segment Value Share (2025)
Beverages (Product Type) 40%

The allergen-free beverages segment is fueled by its multifunctionality, with more and more functional drinks coming into the picture. The allergic consumers are looking for alternatives such as nut-free plant-based milks, hypoallergenic protein shakes, and allergen-free gut-health beverages.

Companies like Ripple Foods, Oatly, and Silk have set the stage for dairy-free drinks, besides the fact that allergen-friendly sports and meal replacement drinks are still in expansion mode. The entrants are doing pea protein, oat-based formulations, and microbiome-supporting prebiotic blends.

Exclusively marketed allergen-free drink aisles are making the rounds in the retailers, while the boom goes to the online subscriptions for allergen-free beverages. The segment's convenience, portability, and association with health-conscious trends combine to qualify it as the market leader, especially in fitness, meal replacement, and plant-based nutrition.

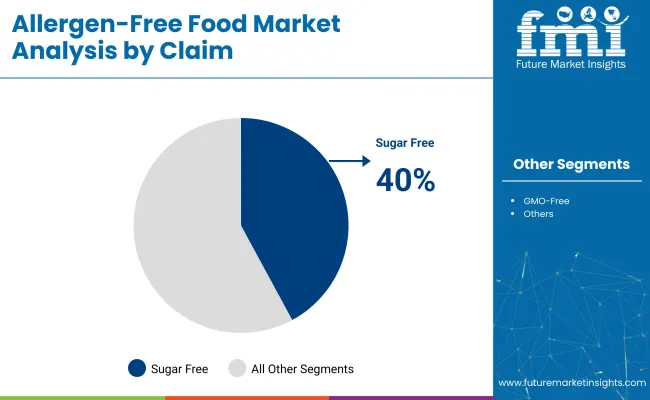
Sugar-Free: The Cross-Segment Winner in Allergen-Free Foods

Segment Value Share (2025)
Sugar Free (Claim) 40%

Gone are the days of allergen-free foods of sugar. Now, people have a choice of products that not only avoid allergens but also help to cut away sugar, artificial sweeteners, and high-GI ingredients.

Firms like Lily’s Sweets, Hu Kitchen, and No Sugar Company are the movers and shakers in the field with their innovative sugar-free chocolates, snacks, and beverages made possible with monk fruit, allulose, and stevia. The sugar-free confectionery, bakery, and beverages segments prove to be the strongest, characterized by the overlapping of the sugar-sensitive with the allergy-conscious consumers.

Vendors are bringing in more shelf space for sugar-free "free-from" products, while the producers are improving the taste profiles using naturally fermented sweeteners. Making use of diabetic-friendly seals of approval and sports advertisements, sugar-free allergen-free products have broken through the mass-market category from the initial niche due to health-conscious consumers.

Key Industry Highlights

Ultra-Processed Free-From Foods under Scrutiny

Consumers are convinced that ultra-processed, allergen-free foods are not the best choice for them as they have a lot of chemicals in stabilizers, gums, emulsifiers, and synthetic flavor enhancers to avoid. The growing knowledge about the gut health of consumers and the popularity of the “real food” movement have created a demand for more organic, whole-ingredient allergen-free food options.

This trend is forcing manufacturers to reformulate the product line with clean-label ingredients only, wherein artificial preservatives are not used at all and are substituted with natural binders such as psyllium husk, flaxseed, and fruit extracts. The main companies are adopting transparency as a way of securing the trust of their customers again by informing them of the sources of the products and the processing methods used.

Some of them are additionally looking into cold-pressed, freeze-dried, or sprouted formulations that also help keeping nutritional value intact and the product shelf-stable with no excessive additives. Added by baked goods and dairy alternatives, the trend is shaping premium allergen-free product launches.

Cross-Contamination-Free Certification Becomes a Market Differentiator

The problem of cross-contamination in shared production facilities, which has long been a struggle, continues to be a challenge for allergen-free brands. Consumers who are facing serious allergies are searching for reassurance apart from just the ordinary regulatory compliance. Out of such desire has arisen a trend of the third-party certifications like "Certified Allergen-Free", which give the guarantee that the goods are produced in dedicated allergen-free facilities.

Manufacturers have now gone the extra mile by investing in exclusive production lines, separate processing units, and advanced air filters to stave off contamination. Retailers and foodservice providers have followed suit by preferring the brands that have stricter testing protocols, which in turn, is pushing the market to strive for cleaner supply chain transparency.

Brands such as Enjoy Life Foods and MadeGood are funnelling their marketing efforts in this area by promoting their product as being manufactured in an allergen-free facility, thus, setting an industry standard for the safety of the new product. As a consequence, products that could ensure the complete absence of allergens have started commanding the premium price.

Rise of "Hidden Allergen-Free" Labels Beyond the Big 8 Allergens

In the first instance, regulators have focused on the “Big 8” allergens (milk, eggs, fish, shellfish, tree nuts, peanuts, wheat, and soy), but now the customers' worries have outgrown them. A new segment has come on the market which demands products not containing sesame, mustard, sulfites, celery, and lupin as these fall under the category of food intolerance.

Recognizing this demand, governments, such as the USA FDA, have recently classified sesame as a priority allergen, thus, making it even more essential for companies to reformulate their recipes and renew their labeling standards. Today, the leading manufacturers of food products are implementing innovative strategies to deal with allergens; additionally, they are diversifying the product range by the introduction of new "free-from" allergens like sesame.

This is made possible by the incorporation of AI-based allergen tracking systems which ensure the compliance of all the ingredients in the production process. By doing so, they win a loyal customer base among niche segments with allergies, thus, laying foundations for the growth of this allergen-free segment.

Fermentation-Based and Microbial-Derived Alternatives for Allergen-Free Formulations

Traditionally, allergen-free formulations were made using only plant-based options, however, brands are turning to fermentation and microbial-derived proteins to enhance product quality while avoiding common allergens like soy, nuts, and dairy.

Companies are using precision fermentation in the manufacturing of egg, dairy, and protein substitutes which don't have to rely on the common plant-based ingredients that cause allergies like almond or soy milk. This is reshaping food innovation in allergen-free baked goods, dairy-free cheeses, and protein powders.

Startups such as Perfect Day and The Every Company are the first movers in the field of microbial-derived proteins that are developed exclusively for the mainstream market. Players of a large scale are directing their investments into the technology of fermented protein as this could be the way of making new-line allergen-free foods that are similar in taste and performance to the standard counterparts without compromising safety and nutrition.

Beverages Are Driving Beyond Solid Foods

These days, beverages, which have been responsible for the innovation of a lot more allergen-free options, are now seen as a major addition to the growth of this category. Demand is increasing for choices like nut-free, dairy-free, soy-free, and gluten-free, which in turn, is driving the functional drinks innovation substantially in the areas of plant-based protein shakes, hypoallergenic sports nutrition drinks, and gut-health functional beverages.

The brands are concentrating on allergen-free RTD (Ready-to-Drink) protein shakes, cold-pressed juices, and plant-based milk alternatives that cater to both allergy sufferers and the growing health-conscious consumer base. Companies like Ripple Foods and Koia have spearheaded the allergen-free beverage movement, marking themselves out as players in this space.

They ensure that production processes are free from cross contamination. The transformation towards single-serve allergen-free beverage formats that can be distributed on airports, vending machines, sports clubs and many more, accelerates the mainstream acceptance of these products.

Pharma-Inspired Allergen-Free Functional Foods

The movement of medical nutrition and allergen-free food innovation is giving birth to a new category of pharmaceutical-inspired functional foods which are aimed at people with severe allergies, chronic inflammation, and autoimmune conditions.

Physicians and nutritionists are now prescribing the allergen-free diets like the way drugs are prescribed which results in the introduction of products with tertiary proven health benefits. This tendency drives the development of nutrient-fortified allergen-free meal replacements, hypoallergenic meal kits, and functional snack bars specifically formulated for atopic dermatitis, gut health, and immune support.

Main leaders Neocate (Nutricia) and Kate Farms are not only expanding their distribution to regular retail but also keeping their clinical-grade formulations allergen-free. The association of these products to the medical field also enforces solid partnerships with hospitals, pediatricians, and dieticians which consequentially leads to a higher penetration in the healthcare channel retail.

Market Concentration

The worldwide allergen-free food market is somewhat centralized, with a combination of Tier 1 multinational corporations (MNCs), Tier 2 regional players, and Tier 3 niche brands, controlling the market dynamics. The Tier 1 players such as Nestlé, Danone, General Mills, Mondelēz International, and The Kraft Heinz Company mainly take the lead due to their global distribution networks, efficient allergen-free R&D, and dedicated allergen-free production lines.

These enterprises are at the forefront of innovation in the sugar-free, dairy-free, and nut-free sectors, managing to gain brand trust and retail power to get ahead of the competition. They are progressing along the path of acquisitions (e.g., Nestlé acquiring allergen-free brands) as well as partnership contracts with retailers for private labels.

Tier 2 companies like Enjoy Life Foods, MadeGood, and Free2b Foods, are wholly concentrated on certain allergen-free segments, with goods that feature clean-label and are organic certified. They contend mainly through specialty retail, DTC (direct-to-consumer) e-commerce models, and regional grocery chains. Due to the rapid growth of the personalized allergen-free choices, these brands are catching up fast but they lack the wide distribution network normally possessed by Tier 1 companies.

Tier 3 players are composed of small-scale brands and emerging startups like Partake Foods, No Sugar Company, and QOA, which are disrupting the market with innovative formulations, plant-based alternatives, and precision fermentation-derived allergen-free products. A number of Tier 3 companies work either online or with health food stores exclusively, they prefer using social media and influencer marketing for building their brand.

The market garnishing a finer structure, retailers like Tesco, Sainsbury’s, and Whole Foods introducing, private-label allergen-free lines, which in turn are toughening competition for the smaller brands. The future would be witnessed by conglomeration where large enterprises shall acquire niche brands and enter into newly blossomed allergen-free sectors.

Country wise Insights

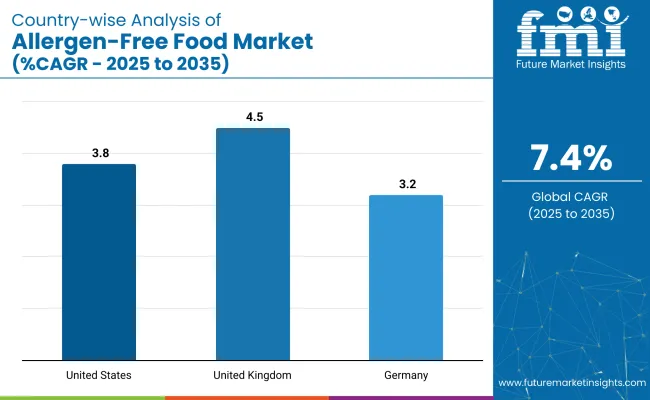
The following table shows the estimated growth rates of the top three countries. The United States, United Kingdom, and Germany are set to exhibit high consumption, with projected CAGRs of 3.8%, 4.5%, and 3.2% respectively, through 2035.

Countries CAGR 2025 to 2035
United States 3.8%
United Kingdom 4.5%
Germany 3.2%

United States

Pharma-Food Synergy: The Rise of Medical-Backed Allergen-Free Nutrition

The USA market is observing a paradigm shift in the sector of allergen-free foods which are moving closer to medical nutrition creating a new category of clinically formulated allergen-free foods. This is a movement spearheaded by companies like Kate Farms, Neocate (Nutricia), and Else Nutrition that are offering doctor-recommended, hypoallergenic meal replacements and pediatric formulas.

This initiative is advancing through endorsements from doctors, insurance payments towards allergen-free medical foods, and FDA-regulated functional claims. Patients with gut problems and immune system diseases are trending toward allergen-free products most of which are bio-engineered for them.

The companies are now directing their focus to the prescription-style allergen-free meal kits, fortified hypoallergenic protein powders, and nutritionally complete allergen-free snacks. The expansion of distribution channels has been facilitated by partnerships with hospitals, clinics, and dietitians who are making these products available in sectors other than retail into pharmaceutical and e-commerce healthcare platforms.

United Kingdom

Retail-Led Revolution: Supermarket Domination of Allergen-Free Innovation

The major driving force behind the UK allergen-free market is the private-label innovation which is being advanced by the major supermarket chains, which is why Tesсo, Sainsbury's, and Mark & Spencer are the main players-the most powerful ones.

In sharp contrast to the situation in other countries where independent brands dominate, UK supermarkets are the ones who fuel the rise of the free-from segment by setting a wider exclusive allergen-free product range. Tesco's "Free From" and Sainsbury's "Deliciously Free From" ranges include vegan cheeses without milk, bakery products without eggs, pies without nuts, thus covering the basic nutritional issues faced by consumers.

Besides, retailors have also completed their work while incorporating solely allergen-free sections, online delivery platforms, and AI-driven allergen filters, enabling the customers for dietary customization of their shopping process. The advancement of this trend can be observed in the modificatons in pricing strategies, supplier collaborations, and direct consumer engagement which make retailers, not manufacturers, the real trendsetters.

Germany

Microbial-Derived Allergen-Free Proteins Redefining Dairy & Egg Alternatives

Germany is undergoing a transformation with the help of microbial ingredients, pushing aside the use of common allergen-free plant-based items. Driven by the top biotech companies such as Formo, Vly Foods, and QOA, the production of precision fermentation-based dairy-free and egg-free products is getting more popular, thereby, replicating harmlessness and soy sauce cheese and egg yolk without the normal allergens.

In contrast to the traditional alternatives such as soy and almond, these innovations are free from the risk of cross-allergenicity and at the same time ofrecen un perfil nutricional superior.

The preference of German consumers for scientific-based, sustainable food technologies has accelerated R&D in microbial caseins, fermentation-derived whey, and allergen-free chocolate formulations. Big companies like Nestlé and Danone Germany are cooperating with biotech, thus paving the way for new lactose-free, nut-free, and egg-free functional foods which will be manufactured in the future with the help of these companies.

Competition Outlook

The global allergen-free food market is observing phase two of the industrial revolution with larger manufacturers using product innovation, clean-label transparency, and targeted marketing to increase their market share. The dominant forces in this field namely Nestlé, Danone, General Mills, and Enjoy Life Foods, established themselves through constant R&D, exclusive allergen-free facilities, and expanded retail partnerships.

Brands look to also add undeclared allergen-free products, such as those free of sesame and sulfites, to their mixed list. Companies are also focusing on precision fermentation for dairy-free proteins (Perfect Day, Formo), sugar-free alternatives using monk fruit and allulose, and meal replacement allergen-free beverages (Kate Farms, Ripple Foods).

Grocery chains like Tesco and Sainsbury's are eyeing to raise the level of competition with a wider range of private-label allergen-free products. The latest product addition was General Mills' gluten-free cereals and No Sugar Company’s nut-free keto bars while keeping inline with the propagandizing of clean-label and sugar-free policies.

Leading Manufacturers

  • Nestlé S.A.
  • Danone S.A.
  • Unilever PLC
  • General Mills Inc.
  • The Kraft Heinz Company
  • Mondelēz International, Inc.
  • Conagra Brands, Inc.
  • Kellogg Company
  • The Hain Celestial Group, Inc.
  • Tyson Foods, Inc.
  • Blue Diamond Growers
  • Chobani LLC
  • Grupo Bimbo, S.A.B. de C.V.

Key Segments of the Report

By Nature:

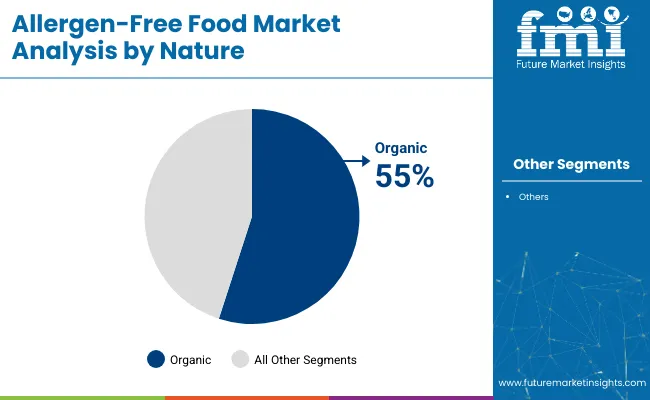
Organic, Conventional

By Product Type:

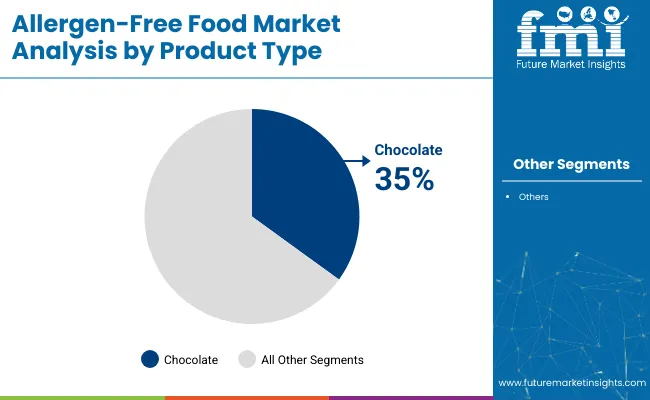
Chocolate, Beverages, Processed Meat & Poultry, Others

By Claim:

Sugar-Free, GMO-Free, Others

By Region:

Industry analysis has been carried out in key countries of North America, Latin America, Europe, Middle East and Africa, East Asia, South Asia, and Oceania

Table of Content

  1. Executive Summary
  2. Industry Introduction, including Taxonomy and Market Definition
  3. Trends and Success Factors, including Macro-economic Factors, Market Dynamics, and Recent Industry Developments
  4. Global Market Demand Analysis 2020 to 2024 and Forecast 2025 to 2035, including Historical Analysis and Future Projections
  5. Pricing Analysis
  6. Global Market Analysis 2020 to 2024 and Forecast 2025 to 2035
    • Nature
    • Product Type
    • Claim
  7. By Nature
    • Organic
    • Conventional
  8. By Product Type
    • Chocolate
    • Beverages
    • Processed Meat & Poultry
    • Others
  9. By Claim
    • Sugar-Free
    • GMO-Free
    • Others
  10. By Region
    • North America
    • Latin America
    • Western Europe
    • Eastern Europe
    • East Asia
    • South Asia & Pacific
    • Central Asia
    • Russia and Belarus
    • Balkan & Baltic Countries
    • Middle East and Africa
  11. North America Sales Analysis 2020 to 2024 and Forecast 2025 to 2035, by Key Segments and Countries
  12. Latin America Sales Analysis 2020 to 2024 and Forecast 2025 to 2035, by Key Segments and Countries
  13. Western Europe Sales Analysis 2020 to 2024 and Forecast 2025 to 2035, by Key Segments and Countries
  14. Eastern Europe Sales Analysis 2020 to 2024 and Forecast 2025 to 2035, by Key Segments and Countries
  15. East Asia Sales Analysis 2020 to 2024 and Forecast 2025 to 2035, by Key Segments and Countries
  16. South Asia & Pacific Sales Analysis 2020 to 2024 and Forecast 2025 to 2035, by Key Segments and Countries
  17. Central Asia Sales Analysis 2020 to 2024 and Forecast 2025 to 2035, by Key Segments and Countries
  18. Russia and Belarus Sales Analysis 2020 to 2024 and Forecast 2025 to 2035, by Key Segments and Countries
  19. Balkan & Baltic Countries Sales Analysis 2020 to 2024 and Forecast 2025 to 2035, by Key Segments and Countries
  20. Middle East and Africa Sales Analysis 2020 to 2024 and Forecast 2025 to 2035, by Key Segments and Countries
  21. Sales Forecast to 2035 by Nature, Product Type, and Claim for 30 Countries
  22. Competitive Assessment, Company Share Analysis by Key Players, and Competition Dashboard
  23. Company Profile
    • Nestlé S.A.
    • Danone S.A.
    • Unilever PLC
    • General Mills Inc.
    • The Kraft Heinz Company
    • Mondelēz International, Inc.
    • Conagra Brands, Inc.
    • Kellogg Company
    • The Hain Celestial Group, Inc.
    • Tyson Foods, Inc.

List of Tables

Table 1: Global Market Value (US$ Million) Forecast by Region, 2019 to 2034

Table 2: Global Market Volume (Unit Pack) Forecast by Region, 2019 to 2034

Table 3: Global Market Value (US$ Million) Forecast by Nature, 2019 to 2034

Table 4: Global Market Volume (Unit Pack) Forecast by Nature, 2019 to 2034

Table 5: Global Market Value (US$ Million) Forecast by Product Type, 2019 to 2034

Table 6: Global Market Volume (Unit Pack) Forecast by Product Type, 2019 to 2034

Table 7: Global Market Value (US$ Million) Forecast by Claim, 2019 to 2034

Table 8: Global Market Volume (Unit Pack) Forecast by Claim, 2019 to 2034

Table 9: Global Market Value (US$ Million) Forecast by Sales Channel, 2019 to 2034

Table 10: Global Market Volume (Unit Pack) Forecast by Sales Channel, 2019 to 2034

Table 11: North America Market Value (US$ Million) Forecast by Country, 2019 to 2034

Table 12: North America Market Volume (Unit Pack) Forecast by Country, 2019 to 2034

Table 13: North America Market Value (US$ Million) Forecast by Nature, 2019 to 2034

Table 14: North America Market Volume (Unit Pack) Forecast by Nature, 2019 to 2034

Table 15: North America Market Value (US$ Million) Forecast by Product Type, 2019 to 2034

Table 16: North America Market Volume (Unit Pack) Forecast by Product Type, 2019 to 2034

Table 17: North America Market Value (US$ Million) Forecast by Claim, 2019 to 2034

Table 18: North America Market Volume (Unit Pack) Forecast by Claim, 2019 to 2034

Table 19: North America Market Value (US$ Million) Forecast by Sales Channel, 2019 to 2034

Table 20: North America Market Volume (Unit Pack) Forecast by Sales Channel, 2019 to 2034

Table 21: Latin America Market Value (US$ Million) Forecast by Country, 2019 to 2034

Table 22: Latin America Market Volume (Unit Pack) Forecast by Country, 2019 to 2034

Table 23: Latin America Market Value (US$ Million) Forecast by Nature, 2019 to 2034

Table 24: Latin America Market Volume (Unit Pack) Forecast by Nature, 2019 to 2034

Table 25: Latin America Market Value (US$ Million) Forecast by Product Type, 2019 to 2034

Table 26: Latin America Market Volume (Unit Pack) Forecast by Product Type, 2019 to 2034

Table 27: Latin America Market Value (US$ Million) Forecast by Claim, 2019 to 2034

Table 28: Latin America Market Volume (Unit Pack) Forecast by Claim, 2019 to 2034

Table 29: Latin America Market Value (US$ Million) Forecast by Sales Channel, 2019 to 2034

Table 30: Latin America Market Volume (Unit Pack) Forecast by Sales Channel, 2019 to 2034

Table 31: Western Europe Market Value (US$ Million) Forecast by Country, 2019 to 2034

Table 32: Western Europe Market Volume (Unit Pack) Forecast by Country, 2019 to 2034

Table 33: Western Europe Market Value (US$ Million) Forecast by Nature, 2019 to 2034

Table 34: Western Europe Market Volume (Unit Pack) Forecast by Nature, 2019 to 2034

Table 35: Western Europe Market Value (US$ Million) Forecast by Product Type, 2019 to 2034

Table 36: Western Europe Market Volume (Unit Pack) Forecast by Product Type, 2019 to 2034

Table 37: Western Europe Market Value (US$ Million) Forecast by Claim, 2019 to 2034

Table 38: Western Europe Market Volume (Unit Pack) Forecast by Claim, 2019 to 2034

Table 39: Western Europe Market Value (US$ Million) Forecast by Sales Channel, 2019 to 2034

Table 40: Western Europe Market Volume (Unit Pack) Forecast by Sales Channel, 2019 to 2034

Table 41: Eastern Europe Market Value (US$ Million) Forecast by Country, 2019 to 2034

Table 42: Eastern Europe Market Volume (Unit Pack) Forecast by Country, 2019 to 2034

Table 43: Eastern Europe Market Value (US$ Million) Forecast by Nature, 2019 to 2034

Table 44: Eastern Europe Market Volume (Unit Pack) Forecast by Nature, 2019 to 2034

Table 45: Eastern Europe Market Value (US$ Million) Forecast by Product Type, 2019 to 2034

Table 46: Eastern Europe Market Volume (Unit Pack) Forecast by Product Type, 2019 to 2034

Table 47: Eastern Europe Market Value (US$ Million) Forecast by Claim, 2019 to 2034

Table 48: Eastern Europe Market Volume (Unit Pack) Forecast by Claim, 2019 to 2034

Table 49: Eastern Europe Market Value (US$ Million) Forecast by Sales Channel, 2019 to 2034

Table 50: Eastern Europe Market Volume (Unit Pack) Forecast by Sales Channel, 2019 to 2034

Table 51: South Asia and Pacific Market Value (US$ Million) Forecast by Country, 2019 to 2034

Table 52: South Asia and Pacific Market Volume (Unit Pack) Forecast by Country, 2019 to 2034

Table 53: South Asia and Pacific Market Value (US$ Million) Forecast by Nature, 2019 to 2034

Table 54: South Asia and Pacific Market Volume (Unit Pack) Forecast by Nature, 2019 to 2034

Table 55: South Asia and Pacific Market Value (US$ Million) Forecast by Product Type, 2019 to 2034

Table 56: South Asia and Pacific Market Volume (Unit Pack) Forecast by Product Type, 2019 to 2034

Table 57: South Asia and Pacific Market Value (US$ Million) Forecast by Claim, 2019 to 2034

Table 58: South Asia and Pacific Market Volume (Unit Pack) Forecast by Claim, 2019 to 2034

Table 59: South Asia and Pacific Market Value (US$ Million) Forecast by Sales Channel, 2019 to 2034

Table 60: South Asia and Pacific Market Volume (Unit Pack) Forecast by Sales Channel, 2019 to 2034

Table 61: East Asia Market Value (US$ Million) Forecast by Country, 2019 to 2034

Table 62: East Asia Market Volume (Unit Pack) Forecast by Country, 2019 to 2034

Table 63: East Asia Market Value (US$ Million) Forecast by Nature, 2019 to 2034

Table 64: East Asia Market Volume (Unit Pack) Forecast by Nature, 2019 to 2034

Table 65: East Asia Market Value (US$ Million) Forecast by Product Type, 2019 to 2034

Table 66: East Asia Market Volume (Unit Pack) Forecast by Product Type, 2019 to 2034

Table 67: East Asia Market Value (US$ Million) Forecast by Claim, 2019 to 2034

Table 68: East Asia Market Volume (Unit Pack) Forecast by Claim, 2019 to 2034

Table 69: East Asia Market Value (US$ Million) Forecast by Sales Channel, 2019 to 2034

Table 70: East Asia Market Volume (Unit Pack) Forecast by Sales Channel, 2019 to 2034

Table 71: Middle East and Africa Market Value (US$ Million) Forecast by Country, 2019 to 2034

Table 72: Middle East and Africa Market Volume (Unit Pack) Forecast by Country, 2019 to 2034

Table 73: Middle East and Africa Market Value (US$ Million) Forecast by Nature, 2019 to 2034

Table 74: Middle East and Africa Market Volume (Unit Pack) Forecast by Nature, 2019 to 2034

Table 75: Middle East and Africa Market Value (US$ Million) Forecast by Product Type, 2019 to 2034

Table 76: Middle East and Africa Market Volume (Unit Pack) Forecast by Product Type, 2019 to 2034

Table 77: Middle East and Africa Market Value (US$ Million) Forecast by Claim, 2019 to 2034

Table 78: Middle East and Africa Market Volume (Unit Pack) Forecast by Claim, 2019 to 2034

Table 79: Middle East and Africa Market Value (US$ Million) Forecast by Sales Channel, 2019 to 2034

Table 80: Middle East and Africa Market Volume (Unit Pack) Forecast by Sales Channel, 2019 to 2034

List of Figures

Figure 1: Global Market Value (US$ Million) by Nature, 2024 to 2034

Figure 2: Global Market Value (US$ Million) by Product Type, 2024 to 2034

Figure 3: Global Market Value (US$ Million) by Claim, 2024 to 2034

Figure 4: Global Market Value (US$ Million) by Sales Channel, 2024 to 2034

Figure 5: Global Market Value (US$ Million) by Region, 2024 to 2034

Figure 6: Global Market Value (US$ Million) Analysis by Region, 2019 to 2034

Figure 7: Global Market Volume (Unit Pack) Analysis by Region, 2019 to 2034

Figure 8: Global Market Value Share (%) and BPS Analysis by Region, 2024 to 2034

Figure 9: Global Market Y-o-Y Growth (%) Projections by Region, 2024 to 2034

Figure 10: Global Market Value (US$ Million) Analysis by Nature, 2019 to 2034

Figure 11: Global Market Volume (Unit Pack) Analysis by Nature, 2019 to 2034

Figure 12: Global Market Value Share (%) and BPS Analysis by Nature, 2024 to 2034

Figure 13: Global Market Y-o-Y Growth (%) Projections by Nature, 2024 to 2034

Figure 14: Global Market Value (US$ Million) Analysis by Product Type, 2019 to 2034

Figure 15: Global Market Volume (Unit Pack) Analysis by Product Type, 2019 to 2034

Figure 16: Global Market Value Share (%) and BPS Analysis by Product Type, 2024 to 2034

Figure 17: Global Market Y-o-Y Growth (%) Projections by Product Type, 2024 to 2034

Figure 18: Global Market Value (US$ Million) Analysis by Claim, 2019 to 2034

Figure 19: Global Market Volume (Unit Pack) Analysis by Claim, 2019 to 2034

Figure 20: Global Market Value Share (%) and BPS Analysis by Claim, 2024 to 2034

Figure 21: Global Market Y-o-Y Growth (%) Projections by Claim, 2024 to 2034

Figure 22: Global Market Value (US$ Million) Analysis by Sales Channel, 2019 to 2034

Figure 23: Global Market Volume (Unit Pack) Analysis by Sales Channel, 2019 to 2034

Figure 24: Global Market Value Share (%) and BPS Analysis by Sales Channel, 2024 to 2034

Figure 25: Global Market Y-o-Y Growth (%) Projections by Sales Channel, 2024 to 2034

Figure 26: Global Market Attractiveness by Nature, 2024 to 2034

Figure 27: Global Market Attractiveness by Product Type, 2024 to 2034

Figure 28: Global Market Attractiveness by Claim, 2024 to 2034

Figure 29: Global Market Attractiveness by Sales Channel, 2024 to 2034

Figure 30: Global Market Attractiveness by Region, 2024 to 2034

Figure 31: North America Market Value (US$ Million) by Nature, 2024 to 2034

Figure 32: North America Market Value (US$ Million) by Product Type, 2024 to 2034

Figure 33: North America Market Value (US$ Million) by Claim, 2024 to 2034

Figure 34: North America Market Value (US$ Million) by Sales Channel, 2024 to 2034

Figure 35: North America Market Value (US$ Million) by Country, 2024 to 2034

Figure 36: North America Market Value (US$ Million) Analysis by Country, 2019 to 2034

Figure 37: North America Market Volume (Unit Pack) Analysis by Country, 2019 to 2034

Figure 38: North America Market Value Share (%) and BPS Analysis by Country, 2024 to 2034

Figure 39: North America Market Y-o-Y Growth (%) Projections by Country, 2024 to 2034

Figure 40: North America Market Value (US$ Million) Analysis by Nature, 2019 to 2034

Figure 41: North America Market Volume (Unit Pack) Analysis by Nature, 2019 to 2034

Figure 42: North America Market Value Share (%) and BPS Analysis by Nature, 2024 to 2034

Figure 43: North America Market Y-o-Y Growth (%) Projections by Nature, 2024 to 2034

Figure 44: North America Market Value (US$ Million) Analysis by Product Type, 2019 to 2034

Figure 45: North America Market Volume (Unit Pack) Analysis by Product Type, 2019 to 2034

Figure 46: North America Market Value Share (%) and BPS Analysis by Product Type, 2024 to 2034

Figure 47: North America Market Y-o-Y Growth (%) Projections by Product Type, 2024 to 2034

Figure 48: North America Market Value (US$ Million) Analysis by Claim, 2019 to 2034

Figure 49: North America Market Volume (Unit Pack) Analysis by Claim, 2019 to 2034

Figure 50: North America Market Value Share (%) and BPS Analysis by Claim, 2024 to 2034

Figure 51: North America Market Y-o-Y Growth (%) Projections by Claim, 2024 to 2034

Figure 52: North America Market Value (US$ Million) Analysis by Sales Channel, 2019 to 2034

Figure 53: North America Market Volume (Unit Pack) Analysis by Sales Channel, 2019 to 2034

Figure 54: North America Market Value Share (%) and BPS Analysis by Sales Channel, 2024 to 2034

Figure 55: North America Market Y-o-Y Growth (%) Projections by Sales Channel, 2024 to 2034

Figure 56: North America Market Attractiveness by Nature, 2024 to 2034

Figure 57: North America Market Attractiveness by Product Type, 2024 to 2034

Figure 58: North America Market Attractiveness by Claim, 2024 to 2034

Figure 59: North America Market Attractiveness by Sales Channel, 2024 to 2034

Figure 60: North America Market Attractiveness by Country, 2024 to 2034

Figure 61: Latin America Market Value (US$ Million) by Nature, 2024 to 2034

Figure 62: Latin America Market Value (US$ Million) by Product Type, 2024 to 2034

Figure 63: Latin America Market Value (US$ Million) by Claim, 2024 to 2034

Figure 64: Latin America Market Value (US$ Million) by Sales Channel, 2024 to 2034

Figure 65: Latin America Market Value (US$ Million) by Country, 2024 to 2034

Figure 66: Latin America Market Value (US$ Million) Analysis by Country, 2019 to 2034

Figure 67: Latin America Market Volume (Unit Pack) Analysis by Country, 2019 to 2034

Figure 68: Latin America Market Value Share (%) and BPS Analysis by Country, 2024 to 2034

Figure 69: Latin America Market Y-o-Y Growth (%) Projections by Country, 2024 to 2034

Figure 70: Latin America Market Value (US$ Million) Analysis by Nature, 2019 to 2034

Figure 71: Latin America Market Volume (Unit Pack) Analysis by Nature, 2019 to 2034

Figure 72: Latin America Market Value Share (%) and BPS Analysis by Nature, 2024 to 2034

Figure 73: Latin America Market Y-o-Y Growth (%) Projections by Nature, 2024 to 2034

Figure 74: Latin America Market Value (US$ Million) Analysis by Product Type, 2019 to 2034

Figure 75: Latin America Market Volume (Unit Pack) Analysis by Product Type, 2019 to 2034

Figure 76: Latin America Market Value Share (%) and BPS Analysis by Product Type, 2024 to 2034

Figure 77: Latin America Market Y-o-Y Growth (%) Projections by Product Type, 2024 to 2034

Figure 78: Latin America Market Value (US$ Million) Analysis by Claim, 2019 to 2034

Figure 79: Latin America Market Volume (Unit Pack) Analysis by Claim, 2019 to 2034

Figure 80: Latin America Market Value Share (%) and BPS Analysis by Claim, 2024 to 2034

Figure 81: Latin America Market Y-o-Y Growth (%) Projections by Claim, 2024 to 2034

Figure 82: Latin America Market Value (US$ Million) Analysis by Sales Channel, 2019 to 2034

Figure 83: Latin America Market Volume (Unit Pack) Analysis by Sales Channel, 2019 to 2034

Figure 84: Latin America Market Value Share (%) and BPS Analysis by Sales Channel, 2024 to 2034

Figure 85: Latin America Market Y-o-Y Growth (%) Projections by Sales Channel, 2024 to 2034

Figure 86: Latin America Market Attractiveness by Nature, 2024 to 2034

Figure 87: Latin America Market Attractiveness by Product Type, 2024 to 2034

Figure 88: Latin America Market Attractiveness by Claim, 2024 to 2034

Figure 89: Latin America Market Attractiveness by Sales Channel, 2024 to 2034

Figure 90: Latin America Market Attractiveness by Country, 2024 to 2034

Figure 91: Western Europe Market Value (US$ Million) by Nature, 2024 to 2034

Figure 92: Western Europe Market Value (US$ Million) by Product Type, 2024 to 2034

Figure 93: Western Europe Market Value (US$ Million) by Claim, 2024 to 2034

Figure 94: Western Europe Market Value (US$ Million) by Sales Channel, 2024 to 2034

Figure 95: Western Europe Market Value (US$ Million) by Country, 2024 to 2034

Figure 96: Western Europe Market Value (US$ Million) Analysis by Country, 2019 to 2034

Figure 97: Western Europe Market Volume (Unit Pack) Analysis by Country, 2019 to 2034

Figure 98: Western Europe Market Value Share (%) and BPS Analysis by Country, 2024 to 2034

Figure 99: Western Europe Market Y-o-Y Growth (%) Projections by Country, 2024 to 2034

Figure 100: Western Europe Market Value (US$ Million) Analysis by Nature, 2019 to 2034

Figure 101: Western Europe Market Volume (Unit Pack) Analysis by Nature, 2019 to 2034

Figure 102: Western Europe Market Value Share (%) and BPS Analysis by Nature, 2024 to 2034

Figure 103: Western Europe Market Y-o-Y Growth (%) Projections by Nature, 2024 to 2034

Figure 104: Western Europe Market Value (US$ Million) Analysis by Product Type, 2019 to 2034

Figure 105: Western Europe Market Volume (Unit Pack) Analysis by Product Type, 2019 to 2034

Figure 106: Western Europe Market Value Share (%) and BPS Analysis by Product Type, 2024 to 2034

Figure 107: Western Europe Market Y-o-Y Growth (%) Projections by Product Type, 2024 to 2034

Figure 108: Western Europe Market Value (US$ Million) Analysis by Claim, 2019 to 2034

Figure 109: Western Europe Market Volume (Unit Pack) Analysis by Claim, 2019 to 2034

Figure 110: Western Europe Market Value Share (%) and BPS Analysis by Claim, 2024 to 2034

Figure 111: Western Europe Market Y-o-Y Growth (%) Projections by Claim, 2024 to 2034

Figure 112: Western Europe Market Value (US$ Million) Analysis by Sales Channel, 2019 to 2034

Figure 113: Western Europe Market Volume (Unit Pack) Analysis by Sales Channel, 2019 to 2034

Figure 114: Western Europe Market Value Share (%) and BPS Analysis by Sales Channel, 2024 to 2034

Figure 115: Western Europe Market Y-o-Y Growth (%) Projections by Sales Channel, 2024 to 2034

Figure 116: Western Europe Market Attractiveness by Nature, 2024 to 2034

Figure 117: Western Europe Market Attractiveness by Product Type, 2024 to 2034

Figure 118: Western Europe Market Attractiveness by Claim, 2024 to 2034

Figure 119: Western Europe Market Attractiveness by Sales Channel, 2024 to 2034

Figure 120: Western Europe Market Attractiveness by Country, 2024 to 2034

Figure 121: Eastern Europe Market Value (US$ Million) by Nature, 2024 to 2034

Figure 122: Eastern Europe Market Value (US$ Million) by Product Type, 2024 to 2034

Figure 123: Eastern Europe Market Value (US$ Million) by Claim, 2024 to 2034

Figure 124: Eastern Europe Market Value (US$ Million) by Sales Channel, 2024 to 2034

Figure 125: Eastern Europe Market Value (US$ Million) by Country, 2024 to 2034

Figure 126: Eastern Europe Market Value (US$ Million) Analysis by Country, 2019 to 2034

Figure 127: Eastern Europe Market Volume (Unit Pack) Analysis by Country, 2019 to 2034

Figure 128: Eastern Europe Market Value Share (%) and BPS Analysis by Country, 2024 to 2034

Figure 129: Eastern Europe Market Y-o-Y Growth (%) Projections by Country, 2024 to 2034

Figure 130: Eastern Europe Market Value (US$ Million) Analysis by Nature, 2019 to 2034

Figure 131: Eastern Europe Market Volume (Unit Pack) Analysis by Nature, 2019 to 2034

Figure 132: Eastern Europe Market Value Share (%) and BPS Analysis by Nature, 2024 to 2034

Figure 133: Eastern Europe Market Y-o-Y Growth (%) Projections by Nature, 2024 to 2034

Figure 134: Eastern Europe Market Value (US$ Million) Analysis by Product Type, 2019 to 2034

Figure 135: Eastern Europe Market Volume (Unit Pack) Analysis by Product Type, 2019 to 2034

Figure 136: Eastern Europe Market Value Share (%) and BPS Analysis by Product Type, 2024 to 2034

Figure 137: Eastern Europe Market Y-o-Y Growth (%) Projections by Product Type, 2024 to 2034

Figure 138: Eastern Europe Market Value (US$ Million) Analysis by Claim, 2019 to 2034

Figure 139: Eastern Europe Market Volume (Unit Pack) Analysis by Claim, 2019 to 2034

Figure 140: Eastern Europe Market Value Share (%) and BPS Analysis by Claim, 2024 to 2034

Figure 141: Eastern Europe Market Y-o-Y Growth (%) Projections by Claim, 2024 to 2034

Figure 142: Eastern Europe Market Value (US$ Million) Analysis by Sales Channel, 2019 to 2034

Figure 143: Eastern Europe Market Volume (Unit Pack) Analysis by Sales Channel, 2019 to 2034

Figure 144: Eastern Europe Market Value Share (%) and BPS Analysis by Sales Channel, 2024 to 2034

Figure 145: Eastern Europe Market Y-o-Y Growth (%) Projections by Sales Channel, 2024 to 2034

Figure 146: Eastern Europe Market Attractiveness by Nature, 2024 to 2034

Figure 147: Eastern Europe Market Attractiveness by Product Type, 2024 to 2034

Figure 148: Eastern Europe Market Attractiveness by Claim, 2024 to 2034

Figure 149: Eastern Europe Market Attractiveness by Sales Channel, 2024 to 2034

Figure 150: Eastern Europe Market Attractiveness by Country, 2024 to 2034

Figure 151: South Asia and Pacific Market Value (US$ Million) by Nature, 2024 to 2034

Figure 152: South Asia and Pacific Market Value (US$ Million) by Product Type, 2024 to 2034

Figure 153: South Asia and Pacific Market Value (US$ Million) by Claim, 2024 to 2034

Figure 154: South Asia and Pacific Market Value (US$ Million) by Sales Channel, 2024 to 2034

Figure 155: South Asia and Pacific Market Value (US$ Million) by Country, 2024 to 2034

Figure 156: South Asia and Pacific Market Value (US$ Million) Analysis by Country, 2019 to 2034

Figure 157: South Asia and Pacific Market Volume (Unit Pack) Analysis by Country, 2019 to 2034

Figure 158: South Asia and Pacific Market Value Share (%) and BPS Analysis by Country, 2024 to 2034

Figure 159: South Asia and Pacific Market Y-o-Y Growth (%) Projections by Country, 2024 to 2034

Figure 160: South Asia and Pacific Market Value (US$ Million) Analysis by Nature, 2019 to 2034

Figure 161: South Asia and Pacific Market Volume (Unit Pack) Analysis by Nature, 2019 to 2034

Figure 162: South Asia and Pacific Market Value Share (%) and BPS Analysis by Nature, 2024 to 2034

Figure 163: South Asia and Pacific Market Y-o-Y Growth (%) Projections by Nature, 2024 to 2034

Figure 164: South Asia and Pacific Market Value (US$ Million) Analysis by Product Type, 2019 to 2034

Figure 165: South Asia and Pacific Market Volume (Unit Pack) Analysis by Product Type, 2019 to 2034

Figure 166: South Asia and Pacific Market Value Share (%) and BPS Analysis by Product Type, 2024 to 2034

Figure 167: South Asia and Pacific Market Y-o-Y Growth (%) Projections by Product Type, 2024 to 2034

Figure 168: South Asia and Pacific Market Value (US$ Million) Analysis by Claim, 2019 to 2034

Figure 169: South Asia and Pacific Market Volume (Unit Pack) Analysis by Claim, 2019 to 2034

Figure 170: South Asia and Pacific Market Value Share (%) and BPS Analysis by Claim, 2024 to 2034

Figure 171: South Asia and Pacific Market Y-o-Y Growth (%) Projections by Claim, 2024 to 2034

Figure 172: South Asia and Pacific Market Value (US$ Million) Analysis by Sales Channel, 2019 to 2034

Figure 173: South Asia and Pacific Market Volume (Unit Pack) Analysis by Sales Channel, 2019 to 2034

Figure 174: South Asia and Pacific Market Value Share (%) and BPS Analysis by Sales Channel, 2024 to 2034

Figure 175: South Asia and Pacific Market Y-o-Y Growth (%) Projections by Sales Channel, 2024 to 2034

Figure 176: South Asia and Pacific Market Attractiveness by Nature, 2024 to 2034

Figure 177: South Asia and Pacific Market Attractiveness by Product Type, 2024 to 2034

Figure 178: South Asia and Pacific Market Attractiveness by Claim, 2024 to 2034

Figure 179: South Asia and Pacific Market Attractiveness by Sales Channel, 2024 to 2034

Figure 180: South Asia and Pacific Market Attractiveness by Country, 2024 to 2034

Figure 181: East Asia Market Value (US$ Million) by Nature, 2024 to 2034

Figure 182: East Asia Market Value (US$ Million) by Product Type, 2024 to 2034

Figure 183: East Asia Market Value (US$ Million) by Claim, 2024 to 2034

Figure 184: East Asia Market Value (US$ Million) by Sales Channel, 2024 to 2034

Figure 185: East Asia Market Value (US$ Million) by Country, 2024 to 2034

Figure 186: East Asia Market Value (US$ Million) Analysis by Country, 2019 to 2034

Figure 187: East Asia Market Volume (Unit Pack) Analysis by Country, 2019 to 2034

Figure 188: East Asia Market Value Share (%) and BPS Analysis by Country, 2024 to 2034

Figure 189: East Asia Market Y-o-Y Growth (%) Projections by Country, 2024 to 2034

Figure 190: East Asia Market Value (US$ Million) Analysis by Nature, 2019 to 2034

Figure 191: East Asia Market Volume (Unit Pack) Analysis by Nature, 2019 to 2034

Figure 192: East Asia Market Value Share (%) and BPS Analysis by Nature, 2024 to 2034

Figure 193: East Asia Market Y-o-Y Growth (%) Projections by Nature, 2024 to 2034

Figure 194: East Asia Market Value (US$ Million) Analysis by Product Type, 2019 to 2034

Figure 195: East Asia Market Volume (Unit Pack) Analysis by Product Type, 2019 to 2034

Figure 196: East Asia Market Value Share (%) and BPS Analysis by Product Type, 2024 to 2034

Figure 197: East Asia Market Y-o-Y Growth (%) Projections by Product Type, 2024 to 2034

Figure 198: East Asia Market Value (US$ Million) Analysis by Claim, 2019 to 2034

Figure 199: East Asia Market Volume (Unit Pack) Analysis by Claim, 2019 to 2034

Figure 200: East Asia Market Value Share (%) and BPS Analysis by Claim, 2024 to 2034

Figure 201: East Asia Market Y-o-Y Growth (%) Projections by Claim, 2024 to 2034

Figure 202: East Asia Market Value (US$ Million) Analysis by Sales Channel, 2019 to 2034

Figure 203: East Asia Market Volume (Unit Pack) Analysis by Sales Channel, 2019 to 2034

Figure 204: East Asia Market Value Share (%) and BPS Analysis by Sales Channel, 2024 to 2034

Figure 205: East Asia Market Y-o-Y Growth (%) Projections by Sales Channel, 2024 to 2034

Figure 206: East Asia Market Attractiveness by Nature, 2024 to 2034

Figure 207: East Asia Market Attractiveness by Product Type, 2024 to 2034

Figure 208: East Asia Market Attractiveness by Claim, 2024 to 2034

Figure 209: East Asia Market Attractiveness by Sales Channel, 2024 to 2034

Figure 210: East Asia Market Attractiveness by Country, 2024 to 2034

Figure 211: Middle East and Africa Market Value (US$ Million) by Nature, 2024 to 2034

Figure 212: Middle East and Africa Market Value (US$ Million) by Product Type, 2024 to 2034

Figure 213: Middle East and Africa Market Value (US$ Million) by Claim, 2024 to 2034

Figure 214: Middle East and Africa Market Value (US$ Million) by Sales Channel, 2024 to 2034

Figure 215: Middle East and Africa Market Value (US$ Million) by Country, 2024 to 2034

Figure 216: Middle East and Africa Market Value (US$ Million) Analysis by Country, 2019 to 2034

Figure 217: Middle East and Africa Market Volume (Unit Pack) Analysis by Country, 2019 to 2034

Figure 218: Middle East and Africa Market Value Share (%) and BPS Analysis by Country, 2024 to 2034

Figure 219: Middle East and Africa Market Y-o-Y Growth (%) Projections by Country, 2024 to 2034

Figure 220: Middle East and Africa Market Value (US$ Million) Analysis by Nature, 2019 to 2034

Figure 221: Middle East and Africa Market Volume (Unit Pack) Analysis by Nature, 2019 to 2034

Figure 222: Middle East and Africa Market Value Share (%) and BPS Analysis by Nature, 2024 to 2034

Figure 223: Middle East and Africa Market Y-o-Y Growth (%) Projections by Nature, 2024 to 2034

Figure 224: Middle East and Africa Market Value (US$ Million) Analysis by Product Type, 2019 to 2034

Figure 225: Middle East and Africa Market Volume (Unit Pack) Analysis by Product Type, 2019 to 2034

Figure 226: Middle East and Africa Market Value Share (%) and BPS Analysis by Product Type, 2024 to 2034

Figure 227: Middle East and Africa Market Y-o-Y Growth (%) Projections by Product Type, 2024 to 2034

Figure 228: Middle East and Africa Market Value (US$ Million) Analysis by Claim, 2019 to 2034

Figure 229: Middle East and Africa Market Volume (Unit Pack) Analysis by Claim, 2019 to 2034

Figure 230: Middle East and Africa Market Value Share (%) and BPS Analysis by Claim, 2024 to 2034

Figure 231: Middle East and Africa Market Y-o-Y Growth (%) Projections by Claim, 2024 to 2034

Figure 232: Middle East and Africa Market Value (US$ Million) Analysis by Sales Channel, 2019 to 2034

Figure 233: Middle East and Africa Market Volume (Unit Pack) Analysis by Sales Channel, 2019 to 2034

Figure 234: Middle East and Africa Market Value Share (%) and BPS Analysis by Sales Channel, 2024 to 2034

Figure 235: Middle East and Africa Market Y-o-Y Growth (%) Projections by Sales Channel, 2024 to 2034

Figure 236: Middle East and Africa Market Attractiveness by Nature, 2024 to 2034

Figure 237: Middle East and Africa Market Attractiveness by Product Type, 2024 to 2034

Figure 238: Middle East and Africa Market Attractiveness by Claim, 2024 to 2034

Figure 239: Middle East and Africa Market Attractiveness by Sales Channel, 2024 to 2034

Figure 240: Middle East and Africa Market Attractiveness by Country, 2024 to 2034

Frequently Asked Questions

How big is the allergen-free food market?

The industry is valued at USD 50.3 billion in 2025.

At what rate is the allergen-free food market expected to grow during the forecast period?

The market is poised to grow at 7.4% CAGR during the study period.

What is the projected market size of the global allergen-free food market by 2035?

The global allergen-free food market is expected to reach USD 102.8 billion by 2035, growing at a CAGR of 7.4% from 2025.

Which companies are leading the allergen-free food market?

Major players include Nestlé, Danone, General Mills, Mondelēz International, Enjoy Life Foods, MadeGood, and Free2b Foods, with increasing competition from biotech-driven startups.

What are the key factors driving the growth of the allergen-free food market?

The market is driven by rising food allergies, stricter labeling regulations, increasing demand for clean-label and sugar-free options, and advancements in precision fermentation-based allergen-free ingredients.

Explore Similar Insights

Future Market Insights

Allergen-Free Food Market