Algae Products Market Size, Share, and Forecast Outlook 2025 to 2035

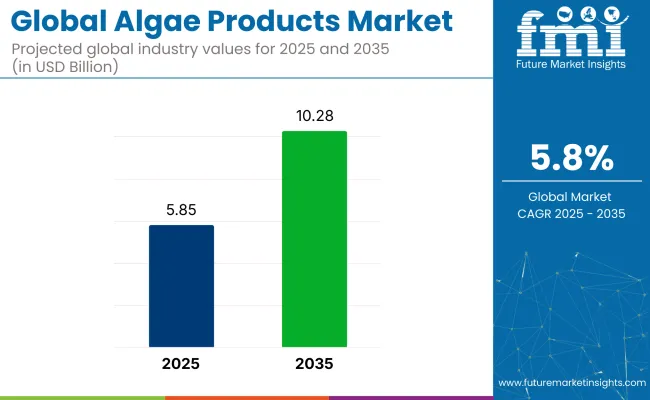
The global algae products market is projected to rise from USD 5.85 billion in 2025 to USD 10.28 billion by 2035, reflecting a CAGR of 5.8%. India, with a 6.5% CAGR, is expected to be the fastest-growing region, driven by rising demand for sustainable products and increasing investments in the algae industry.
Quick Stats for the Algae Products Market

  • Market Value (2025): USD 5.85 billion
  • Forecast Value (2035): USD 10.28 billion
  • Market Analysis CAGR: 5.8%
  • Leading Segment in 2035: Liquid (~55% share)
  • Key Growth Region: India (fastest-growing market with 6.5% CAGR)
  • Key Players: Algae Systems LLC, Euglena Co., Cyanotech Corporation, Cargill, DSM, Kerry.

Algae Products Market

Attributes Description
Estimated Industry Size (2025E) USD 5.85 billion
Projected Industry Value (2035F) USD 10.28 billion
Value-based CAGR (2025 to 2035) 5.8%

This growth is driven by the increasing recognition of algae products as sustainable, nutrient-dense, and environmentally friendly alternatives in various industries, including health and wellness, biofuels, and food & beverages.

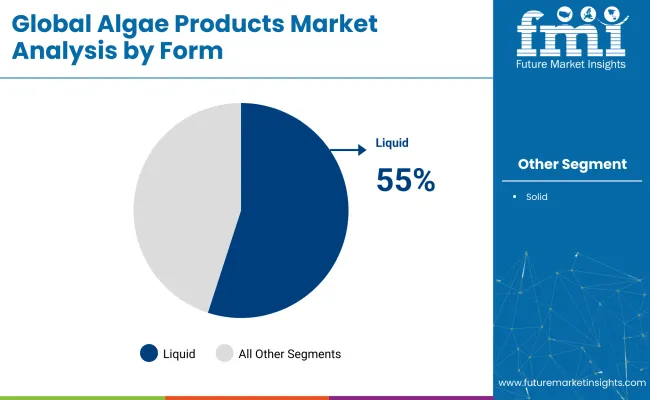
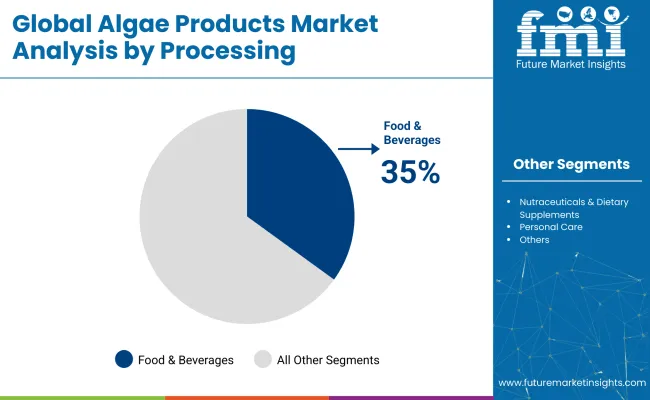
Liquid forms are expected to dominate the market, with an estimated 55.0% of the market share in 2025. Liquid products are mostly used in the health and wellness industry, particularly in dietary supplements. The food & beverages segment is expected to lead the processing category with 35.0% of the market share in 2025. Algae is increasingly incorporated into functional foods and beverages due to its high content of proteins, vitamins, and antioxidants.

Constant innovations and launches keep the industry active. DSM-Firmenich launched Life’s® DHA B54-0100, a naturally potent DHA algal oil with exceptional sensory appeal.This product delivers 545 mg of DHA and 80 mg of EPA per gram, enabling the development of smaller, more cost-effective capsules with higher DHA concentrations.

The industry accounts a specific share within its parent markets. In the food and beverage market, the algae products market contributes around 1-3%, driven by increasing consumer demand for natural and nutrient-dense ingredients. Within the nutraceutical market, the share is estimated at 5-7%, as algae-based supplements are gaining popularity for their health benefits, particularly omega-3 fatty acids.

In the cosmetic and personal care market, algae products account for approximately 2-4%, as they are used in skincare and haircare products for their moisturizing and antioxidant properties. The animal feed marketsees a share of 3-5%, with algae being utilized in animal nutrition. In the pharmaceutical market, the share is around 1-2%, as algae-derived compounds are used in certain therapeutic applications.

Analyzing Algae Products Market by Key Segments

Algae products market analysis by top investment segments. Segmentation has been done by product type into lipids, carrageenan, alginate, algal protein, carotenoids, and others; by form into solid and liquid; by source into green algae, brown algae, blue-green algae, red algae, yellow-brown algae, and others, by processing into food and beverages, nutraceuticals and dietary supplements, personal care, feed, pharmaceuticals, and others, by region into North America, Latin America, Western Europe, Eastern Europe, Balkans and Baltic, Russia and Belarus, Central Asia, East Asia, South Asia and Pacific, and the Middle East and Africa.

Algal Lipids Driving Market Sales with 25.5% Share

The lipids segment is expected to account for 25.5% of the market share in 2025. Algae-derived lipids are gaining traction due to their sustainable and eco-friendly nature, offering a renewable source of bioactive compounds.

  • Algal lipids are highly valued for their applications in biofuels, cosmetics, and nutraceuticals. The growing consumer demand for cleaner, greener products is fueling the popularity of algae lipids, which have high lipid yields without environmental pollution.
  • Advances in biotechnology and algae culture techniques by companies such as Solazyme and Algenol have improved lipid extraction methods, making production more cost-efficient and scalable. This innovation is driving the segment’s growth, with expected compounded annual growth of 4.8% from 2025 to 2035.

Brown Algae Segment Expands with 24.5% Market Share

The brown algae segment is projected to hold 24.5% of the market share in 2025. Brown algae is rich in bioactive compounds like fucoidan and alginate, which provide numerous health benefits, including anti-inflammatory and antioxidant properties.

  • The incorporation of brown algae into nutraceuticals, pharmaceuticals, and cosmetics is contributing to its growing market share. Companies like Marinova and Algatech are taking the market forward with cutting-edge extraction technologies to enhance the bioavailability and efficacy of these bioactive substances.
  • The food industry’s adoption of brown algae as a natural thickener and dietary enhancer is also propelling market growth, particularly as consumers seek sustainable and renewable alternatives to synthetic ingredients.

Liquid Form Segment Leads with 55.0% Market Share

The liquid form segment is expected to dominate with 55.0% of the market share in 2025. The liquid form offers versatility and ease of incorporation into various applications, particularly in food, beverages, and personal care products.
  • Liquid algae extracts are used in the production of functional beverages, supplements, and skincare formulations, providing a natural source of essential nutrients, antioxidants, and omega-3 fatty acids. The ease of use and faster absorption rates of liquid products drive their popularity among consumers and manufacturers.
  • The growing demand for liquid form, combined with their proven health benefits and eco-friendly production processes, is solidifying this form as the dominating segment.

Algae Products Market Analysis By Form

Food & Beverages Processing Leads with 35.0% Market Share

The food & beverages processing segment is expected to hold 35.0% of the market share in 2025. Algae’s versatility in the food industry ranging from natural flavorings and thickeners to health supplements continues to drive its adoption.
  • Consumers demand more plant-based, sustainable, and functional ingredients, algae is emerging as a key player in the food and beverage sectors. Algae extracts are used to enhance the nutritional profile of drinks, snacks, and dietary supplements, with particular focus on omega-3 enrichment.
  • The segment’s growth is propelled by the rising awareness of the environmental benefits of algae-based ingredients, which are renewable, non-GMO, and contribute to more sustainable food systems.

Algae Products Market Analysis By Processing

Algae Products Market Dynamics

The industry is driven by increasing consumer demand for plant-based, nutrient-rich ingredients across various industries. However, challenges such as high production costs and scalability issues continue to impact the market's expansion.

Rising Demand for Plant-Based, Nutrient-Rich Ingredients

The growth in this industry is driven by the increasing consumer preference for plant-based, nutrient-rich ingredients in food, beverages, and personal care products. Algae, particularly microalgae like spirulina and chlorella, are rich in proteins, vitamins, minerals, and omega-3 fatty acids, making them attractive alternatives to traditional animal-based ingredients.

The growing awareness of the health benefits associated with algae, such as immune system support and cardiovascular health, is fueling their incorporation into various products. The shift towards vegan and vegetarian diets is propelling the demand for algae-based ingredients, as they provide sustainable and nutrient-dense options for consumers seeking plant-based alternatives.

High Production Costs and Scalability Challenges

Despite the growing demand, the industry faces challenges related to high production costs and scalability issues. The cultivation of algae requires specialized infrastructure, controlled environments, and energy inputs. Achieving large-scale production while maintaining consistent quality is challenging.

The complexity of algae cultivation, harvesting, and processing necessitates a good investment in research and development to improve efficiency and reduce costs. Competition from other plant-based ingredients and the need for specialized processing techniques complicate the scalability. Addressing these challenges is crucial for the sustainable growth and competitiveness.
Analyzing Top Countries Formulating, Distributing, and Supplying Algae Products

Country Wise Analysis Of Algae Products Market

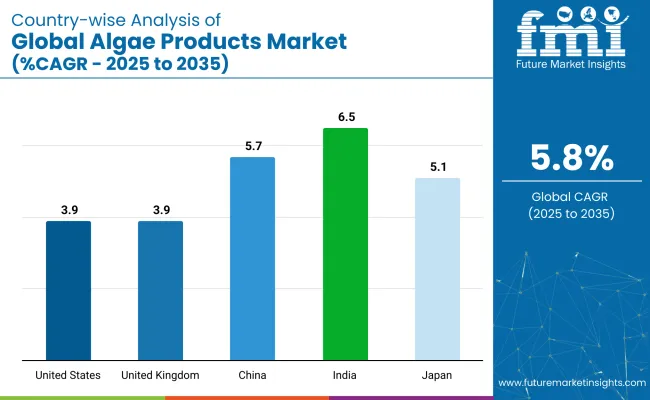
Countries Projected CAGR (2025 to 2035)
United States 3.9%
United Kingdom 3.9%
China 5.7%
India 6.5%
Japan 5.1%

The United States and United Kingdom in the OECD group, are witnessing steady growth. The United States, growing at a 3.9% CAGR, is driven by rising demand for renewable energy, plant-based omega-3 supplements, and functional foods.

Innovations from companies like Heliae Development and Sapphire Energy are pushing algae-based biofertilizers and biofuels. UK, expected to grow at 3.9% CAGR, has a high production of clean-label products. UK’s strong biotechnological foundation is fostering innovation in algae cultivation and processing.

India leads with a projected 6.5% CAGRin the BRICS group, fueled by increasing demand for plant-based nutrition and sustainable agriculture. Algae products are gaining traction in aquaculture, pharmaceuticals, and plant-based nutrition. China, with a 5.7% CAGR, is heavily investing in algae-based biofuels and food ingredients, particularly for health-conscious consumers.

The country is also leveraging e-commerce for strong sales growth. In ASEAN, Japan shows solid growth at 5.1% CAGR, with its focus on longevity, cognitive health, and sustainable innovations. Japan’s advanced extraction technologies and eco-friendly solutions are driving algae product adoption across industries.

In-depth Analysis of the United States Algae Products Market

The USA is projected to grow at a CAGR of 3.9% from 2025 to 2035, driven by increasing demand for renewable energy, plant-based omega-3 supplements, and functional foods. Heliae Development is producing algae-based biofertilizers that improve soil quality and crop yields, boosting organic farming. Terravia is introducing algae-based protein snacks and powders, meeting the demand for plant-based, nutrient-dense foods.

  • Sapphire Energy is advancing algae-based biofuels as a cleaner alternative to petroleum.
  • The USA government’s push for renewable energy sources, particularly algae biofuels, is helping drive innovation in the sector.
  • A high interest in vegetarian diets and plant-based omega-3 supplements is expanding the algae products market in health-conscious communities.

United Kingdom Algae Products Market Growth Analysis

The UK algae products market is expected to grow at a CAGR of 3.9% from 2025 to 2035, driven by the country’s focus on clean-label dietary supplements, and innovative algae applications. Companies like Algome are creating algae-based biofuels and bioplastics to reduce carbon emissions and plastic waste. The UK food sector is incorporating algae-based ingredients such as natural food colors and dietary supplements.

  • UK’s biotechnological base is supporting the development of advanced algae cultivation and processing technologies.
  • A high demand for eco-friendly and organic algae products is seen in the UK.

Future Outlook of the China Algae Products Market

China’s algae products market is projected to grow at a CAGR of 5.7% from 2025 to 2035, driven by rising demand for plant-based and sustainable food ingredients, as well as government initiatives. China is investing heavily in algae-based biofuels as part of its strategy to reduce fossil fuel dependence. Algae-based omega-3 supplements and functional food ingredients are gaining popularity in China’s health food sector.

  • The Chinese aquaculture industry is increasingly adopting algae as a feed component to enhance fish health and sustainability.
  • Algae products are seeing strong sales growth through e-commerce platforms, particularly in premium supplements.

India Algae Products Market Growth Analysis

India is projected to grow at a CAGR of 6.5% from 2025 to 2035, supported by increasing awareness of health, plant-based nutrition, and sustainable agriculture.Algae-based feeds are gaining traction in India’s aquaculture industry to improve fish health and growth.India’s pharmaceutical industry is incorporating algae to produce omega-3 supplements and other functional health products. India is exploring algae fibers for biodegradable and eco-friendly fabrics in the textile industry.

  • The rise of plant-based nutrition in India is boosting demand for algae-based protein supplements.
  • India’s investment in sustainable food production and algae extraction supports the growing industry.

Japan Algae Products Market Growth Outlook

Japan’s algae products market is expected to grow at a CAGR of 5.1% from 2025 to 2035, driven by the country’s interest in longevity, health, and eco-friendly innovations. Algae oil is used to support cognitive health, cardiovascular function, and anti-aging in Japan’s aging population. The demand for algae-based omega-3 supplements is increasing due to their high bioavailability and health benefits.

  • Algae-based supplements are gaining popularity in Japan, especially for improving brain health and preventing cognitive decline.
  • Japanese companies are using enzyme-assisted extraction and nano-encapsulation technologies to improve algae oil stability.

Leading Suppliers in the Algae Products Market

This sector is highly competitive, with companies fighting for market share through innovation and collaboration. Key players like Corbion and DSM are investing heavily in R&D to develop high-value, consumer-oriented products, such as algae-derived omega-3 fatty acids, providing an environmentally friendly alternative to fish oil.

Manufacturers are increasingly forming alliances and joint ventures to strengthen their market presence; for example, AlgaEnergy has partnered with Yokogawa Electric Corporation to enhance production and distribution capabilities. While large firms dominate with a large market share and resources, smaller companies like Algama and Notpla focus on niche markets and emerging technologies.

Recent Algae Products Industry News

  • Euglena Co., Ltd. and Petronas Research have formed a partnership to develop microalgae technology, including cultivation, harvesting, extraction, and by-product usage. This collaboration aims to enhance sustainable biofuel production and other algae-based applications.
  • Cargill introduced its Specialized Nutrition category at Vitafoods Asia 2024, providing innovative, science-backed nutritional solutions aimed at positively impacting people's health and well-being across all life stages. This includes algae-based ingredients for various applications.

Key Players

  • Algae Systems LLC
  • euglena Co.
  • Cyanotech Corporation
  • Cargill
  • DSM
  • Kerry
  • Cargill
  • Corbion
  • BIOPROCESS ALGAE, LLC.
  • BASF
  • Others

Report Coverage and Scope Summary

Report Attributes Key Insights
Estimated Market Value (2025) USD 5.85 billion
Projected Market Value (2035) USD 10.28 billion
CAGR (2025 to 2035) 5.8%
Base Year for Estimation 2024
Historical Period 2020 to 2024
Forecast Period 2025 to 2035
Quantitative Units Revenue in USD billion
Product Type Lipids, Carrageenan, Alginate, Algal Protein, Carotenoids, Others
Form Solid, Liquid
Source Green Algae, Brown Algae, Blue-Green Algae, Red Algae, Yellow-Brown Algae, Others
Processing Food & Beverages, Nutraceuticals & Dietary Supplements, Personal Care, Feed, Pharmaceuticals, Others
Region North America, Latin America, Western Europe, Eastern Europe, Balkans & Baltic, Russia & Belarus, Central Asia, East Asia, South Asia & Pacific, Middle East & Africa
Countries Covered United States, Canada, Mexico, Brazil, Argentina, Germany, France, United Kingdom, Italy, Spain, Netherlands, China, India, Japan, South Korea, ANZ, GCC Countries, South Africa
Key Players Algae Systems LLC, Euglena Co., Cyanotech Corporation, Cargill, DSM, Kerry, Cargill, Corbion, BIOPROCESS ALGAE, LLC., BASF, Others
Additional Attributes Dollar sales, CAGR trends, product type segmentation, grade-based demand, application segment growth, competitor dollar sales & market share, regional growth patterns, sales channel trends

Key Segments

By Product Type:

Lipids, Carrageenan, Alginate, Algal Protein, Carotenoids, and Others.

By Form:

Solid and Liquid.

By Source:

Green Algae, Brown Algae, blue-green algae, Red Algae, Yellow-Brown Algae, and Others.

By Application:

Food & Beverages, Nutraceuticals & Dietary Supplements, Personal Care, Feed, Pharmaceuticals, and Others.

By Region:

North America, Latin America, Western Europe, Eastern Europe, Balkans & Baltic, Russia & Belarus, Central Asia, East Asia, South Asia & Pacific, and the Middle East & Africa.

Table of Content

  1. Executive Summary
  2. Industry Introduction, Including Taxonomy and Market Definition
  3. Market Trends and Success Factors, Including Macro-economic Factors, Market Dynamics, and Recent Industry Developments
  4. Global Market Demand Analysis 2020 to 2024 and Forecast 2025 to 2035, including Historical Analysis and Future Projections
  5. Pricing Analysis
  6. Global Market Analysis 2020 to 2024 and Forecast 2025 to 2035
    • Product Type
    • Form
    • Source
    • Application
    • Region
  7. Global Market Analysis 2020 to 2024 and Forecast 2025 to 2035, by Product Type
    • Lipids
    • Carrageenan
    • Alginate
    • Algal Protein
    • Cartenoids
    • Others
  8. Global Market Analysis 2020 to 2024 and Forecast 2025 to 2035, by Form
    • Solid
    • Liquid
  9. Global Market Analysis 2020 to 2024 and Forecast 2025 to 2035, by Source
    • Green Algae
    • Brown Algae
    • Blu-Green Algae
    • Red Algae
    • Yellow-Brown Algae
    • Others
  10. Global Market Analysis 2020 to 2024 and Forecast 2025 to 2035, by Application
    • Food & Beverages
    • Nutraceuticals & Dietary Supplements
    • Personal Care
    • Feed
    • Pharmaceuticals
    • Others
  11. Global Market Analysis 2020 to 2024 and Forecast 2025 to 2035, by Region
    • North America
    • Latin America
    • Western Europe
    • Eastern Europe
    • Balkans & Baltic
    • Russia & Belarus
    • Central Asia
    • East Asia
    • South Asia & Pacific
    • Middle East & Africa
  12. North America Sales Analysis 2020 to 2024 and Forecast 2025 to 2035, by Key Segments and Countries
  13. Latin America Sales Analysis 2020 to 2024 and Forecast 2025 to 2035, by Key Segments and Countries
  14. Western Europe Sales Analysis 2020 to 2024 and Forecast 2025 to 2035, by Key Segments and Countries
  15. Eastern Europe Sales Analysis 2020 to 2024 and Forecast 2025 to 2035, by Key Segments and Countries
  16. Balkans & Baltic Sales Analysis 2020 to 2024 and Forecast 2025 to 2035, by Key Segments and Countries
  17. Russia & Belarus Sales Analysis 2020 to 2024 and Forecast 2025 to 2035, by Key Segments and Countries
  18. Central Asia Sales Analysis 2020 to 2024 and Forecast 2025 to 2035, by Key Segments and Countries
  19. East Asia Sales Analysis 2020 to 2024 and Forecast 2025 to 2035, by Key Segments and Countries
  20. South Asia & Pacific Sales Analysis 2020 to 2024 and Forecast 2025 to 2035, by Key Segments and Countries
  21. Middle East & Africa Sales Analysis 2020 to 2024 and Forecast 2025 to 2035, by Key Segments and Countries
  22. Sales Forecast 2025 to 2035 by Product Type, Form, Source, and Application for 30 Countries
  23. Competition Outlook, including Market Structure Analysis, Company Share Analysis by Key Players, and Competition Dashboard
  24. Company Profile
    • Algae Systems LLC
    • euglena Co.
    • Cyanotech Corporation
    • Cargill
    • DSM
    • Kerry
    • Cargill
    • Corbion
    • BIOPROCESS ALGAE, LLC.
    • BASF
    • Others

List of Tables

  • Table 1: Global Market Value (USD Billion) Forecast by Region, 2020 to 2035
  • Table 2: Global Market Volume (Unit) Forecast by Region, 2020 to 2035
  • Table 3: Global Market Value (USD Billion) Forecast by Product Type, 2020 to 2035
  • Table 4: Global Market Volume (Unit) Forecast by Product Type, 2020 to 2035
  • Table 5: Global Market Value (USD Billion) Forecast by Form, 2020 to 2035
  • Table 6: Global Market Volume (Unit) Forecast by Form, 2020 to 2035
  • Table 7: Global Market Value (USD Billion) Forecast by Source, 2020 to 2035
  • Table 8: Global Market Volume (Unit) Forecast by Source, 2020 to 2035
  • Table 9: Global Market Value (USD Billion) Forecast by Application, 2020 to 2035
  • Table 10: Global Market Volume (Unit) Forecast by Application, 2020 to 2035
  • Table 11: North America Market Value (USD Billion) Forecast by Region, 2020 to 2035
  • Table 12: North America Market Volume (Unit) Forecast by Region, 2020 to 2035
  • Table 13: North America Market Value (USD Billion) Forecast by Product Type, 2020 to 2035
  • Table 14: North America Market Volume (Unit) Forecast by Product Type, 2020 to 2035
  • Table 15: North America Market Value (USD Billion) Forecast by Form, 2020 to 2035
  • Table 16: North America Market Volume (Unit) Forecast by Form, 2020 to 2035
  • Table 17: North America Market Value (USD Billion) Forecast by Source, 2020 to 2035
  • Table 18: North America Market Volume (Unit) Forecast by Source, 2020 to 2035
  • Table 19: North America Market Value (USD Billion) Forecast by Application, 2020 to 2035
  • Table 20: North America Market Volume (Unit) Forecast by Application, 2020 to 2035
  • Table 21: Latin America Market Value (USD Billion) Forecast by Region, 2020 to 2035
  • Table 22: Latin America Market Volume (Unit) Forecast by Region, 2020 to 2035
  • Table 23: Latin America Market Value (USD Billion) Forecast by Product Type, 2020 to 2035
  • Table 24: Latin America Market Volume (Unit) Forecast by Product Type, 2020 to 2035
  • Table 25: Latin America Market Value (USD Billion) Forecast by Form, 2020 to 2035
  • Table 26: Latin America Market Volume (Unit) Forecast by Form, 2020 to 2035
  • Table 27: Latin America Market Value (USD Billion) Forecast by Source, 2020 to 2035
  • Table 28: Latin America Market Volume (Unit) Forecast by Source, 2020 to 2035
  • Table 29: Latin America Market Value (USD Billion) Forecast by Application, 2020 to 2035
  • Table 30: Latin America Market Volume (Unit) Forecast by Application, 2020 to 2035
  • Table 31: Western Europe Market Value (USD Billion) Forecast by Region, 2020 to 2035
  • Table 32: Western Europe Market Volume (Unit) Forecast by Region, 2020 to 2035
  • Table 33: Western Europe Market Value (USD Billion) Forecast by Product Type, 2020 to 2035
  • Table 34: Western Europe Market Volume (Unit) Forecast by Product Type, 2020 to 2035
  • Table 35: Western Europe Market Value (USD Billion) Forecast by Form, 2020 to 2035
  • Table 36: Western Europe Market Volume (Unit) Forecast by Form, 2020 to 2035
  • Table 37: Western Europe Market Value (USD Billion) Forecast by Source, 2020 to 2035
  • Table 38: Western Europe Market Volume (Unit) Forecast by Source, 2020 to 2035
  • Table 39: Western Europe Market Value (USD Billion) Forecast by Application, 2020 to 2035
  • Table 40: Western Europe Market Volume (Unit) Forecast by Application, 2020 to 2035
  • Table 41: Eastern Europe Market Value (USD Billion) Forecast by Region, 2020 to 2035
  • Table 42: Eastern Europe Market Volume (Unit) Forecast by Region, 2020 to 2035
  • Table 43: Eastern Europe Market Value (USD Billion) Forecast by Product Type, 2020 to 2035
  • Table 44: Eastern Europe Market Volume (Unit) Forecast by Product Type, 2020 to 2035
  • Table 45: Eastern Europe Market Value (USD Billion) Forecast by Form, 2020 to 2035
  • Table 46: Eastern Europe Market Volume (Unit) Forecast by Form, 2020 to 2035
  • Table 47: Eastern Europe Market Value (USD Billion) Forecast by Source, 2020 to 2035
  • Table 48: Eastern Europe Market Volume (Unit) Forecast by Source, 2020 to 2035
  • Table 49: Eastern Europe Market Value (USD Billion) Forecast by Application, 2020 to 2035
  • Table 50: Eastern Europe Market Volume (Unit) Forecast by Application, 2020 to 2035
  • Table 51: Balkan & Baltics Market Value (USD Billion) Forecast by Region, 2020 to 2035
  • Table 52: Balkan & Baltics Market Volume (Unit) Forecast by Region, 2020 to 2035
  • Table 53: Balkan & Baltics Market Value (USD Billion) Forecast by Product Type, 2020 to 2035
  • Table 54: Balkan & Baltics Market Volume (Unit) Forecast by Product Type, 2020 to 2035
  • Table 55: Balkan & Baltics Market Value (USD Billion) Forecast by Form, 2020 to 2035
  • Table 56: Balkan & Baltics Market Volume (Unit) Forecast by Form, 2020 to 2035
  • Table 57: Balkan & Baltics Market Value (USD Billion) Forecast by Source, 2020 to 2035
  • Table 58: Balkan & Baltics Market Volume (Unit) Forecast by Source, 2020 to 2035
  • Table 59: Balkan & Baltics Market Value (USD Billion) Forecast by Application, 2020 to 2035
  • Table 60: Balkan & Baltics Market Volume (Unit) Forecast by Application, 2020 to 2035
  • Table 61: Russia & Belarus Market Value (USD Billion) Forecast by Region, 2020 to 2035
  • Table 62: Russia & Belarus Market Volume (Unit) Forecast by Region, 2020 to 2035
  • Table 63: Russia & Belarus Market Value (USD Billion) Forecast by Product Type, 2020 to 2035
  • Table 64: Russia & Belarus Market Volume (Unit) Forecast by Product Type, 2020 to 2035
  • Table 65: Russia & Belarus Market Value (USD Billion) Forecast by Form, 2020 to 2035
  • Table 66: Russia & Belarus Market Volume (Unit) Forecast by Form, 2020 to 2035
  • Table 67: Russia & Belarus Market Value (USD Billion) Forecast by Source, 2020 to 2035
  • Table 68: Russia & Belarus Market Volume (Unit) Forecast by Source, 2020 to 2035
  • Table 69: Russia & Belarus Market Value (USD Billion) Forecast by Application, 2020 to 2035
  • Table 70: Russia & Belarus Market Volume (Unit) Forecast by Application, 2020 to 2035
  • Table 71: Central Asia Market Value (USD Billion) Forecast by Region, 2020 to 2035
  • Table 72: Central Asia Market Volume (Unit) Forecast by Region, 2020 to 2035
  • Table 73: Central Asia Market Value (USD Billion) Forecast by Product Type, 2020 to 2035
  • Table 74: Central Asia Market Volume (Unit) Forecast by Product Type, 2020 to 2035
  • Table 75: Central Asia Market Value (USD Billion) Forecast by Form, 2020 to 2035
  • Table 76: Central Asia Market Volume (Unit) Forecast by Form, 2020 to 2035
  • Table 77: Central Asia Market Value (USD Billion) Forecast by Source, 2020 to 2035
  • Table 78: Central Asia Market Volume (Unit) Forecast by Source, 2020 to 2035
  • Table 79: Central Asia Market Value (USD Billion) Forecast by Application, 2020 to 2035
  • Table 80: Central Asia Market Volume (Unit) Forecast by Application, 2020 to 2035
  • Table 81: East Asia Market Value (USD Billion) Forecast by Region, 2020 to 2035
  • Table 82: East Asia Market Volume (Unit) Forecast by Region, 2020 to 2035
  • Table 83: East Asia Market Value (USD Billion) Forecast by Product Type, 2020 to 2035
  • Table 84: East Asia Market Volume (Unit) Forecast by Product Type, 2020 to 2035
  • Table 85: East Asia Market Value (USD Billion) Forecast by Form, 2020 to 2035
  • Table 86: East Asia Market Volume (Unit) Forecast by Form, 2020 to 2035
  • Table 87: East Asia Market Value (USD Billion) Forecast by Source, 2020 to 2035
  • Table 88: East Asia Market Volume (Unit) Forecast by Source, 2020 to 2035
  • Table 89: East Asia Market Value (USD Billion) Forecast by Application, 2020 to 2035
  • Table 90: East Asia Market Volume (Unit) Forecast by Application, 2020 to 2035
  • Table 91: South Asia & Pacific Market Value (USD Billion) Forecast by Region, 2020 to 2035
  • Table 92: South Asia & Pacific Market Volume (Unit) Forecast by Region, 2020 to 2035
  • Table 93: South Asia & Pacific Market Value (USD Billion) Forecast by Product Type, 2020 to 2035
  • Table 94: South Asia & Pacific Market Volume (Unit) Forecast by Product Type, 2020 to 2035
  • Table 95: South Asia & Pacific Market Value (USD Billion) Forecast by Form, 2020 to 2035
  • Table 96: South Asia & Pacific Market Volume (Unit) Forecast by Form, 2020 to 2035
  • Table 97: South Asia & Pacific Market Value (USD Billion) Forecast by Source, 2020 to 2035
  • Table 98: South Asia & Pacific Market Volume (Unit) Forecast by Source, 2020 to 2035
  • Table 99: South Asia & Pacific Market Value (USD Billion) Forecast by Application, 2020 to 2035
  • Table 100: South Asia & Pacific Market Volume (Unit) Forecast by Application, 2020 to 2035
  • Table 101: Middle East & Africa Market Value (USD Billion) Forecast by Region, 2020 to 2035
  • Table 102: Middle East & Africa Market Volume (Unit) Forecast by Region, 2020 to 2035
  • Table 103: Middle East & Africa Market Value (USD Billion) Forecast by Product Type, 2020 to 2035
  • Table 104: Middle East & Africa Market Volume (Unit) Forecast by Product Type, 2020 to 2035
  • Table 105: Middle East & Africa Market Value (USD Billion) Forecast by Form, 2020 to 2035
  • Table 106: Middle East & Africa Market Volume (Unit) Forecast by Form, 2020 to 2035
  • Table 107: Middle East & Africa Market Value (USD Billion) Forecast by Source, 2020 to 2035
  • Table 108: Middle East & Africa Market Volume (Unit) Forecast by Source, 2020 to 2035
  • Table 109: Middle East & Africa Market Value (USD Billion) Forecast by Application, 2020 to 2035
  • Table 110: Middle East & Africa Market Volume (Unit) Forecast by Application, 2020 to 2035

List of Figures

  • Figure 1: Global Market Value (USD million) by Product Type, 2025 to 2035
  • Figure 2: Global Market Value (USD million) by Form, 2025 to 2035
  • Figure 3: Global Market Value (USD million) by Source, 2025 to 2035
  • Figure 4: Global Market Value (USD million) by Application, 2025 to 2035
  • Figure 5: Global Market Value (USD million) by Country, 2025 to 2035
  • Figure 6: Global Market Value (USD million) Analysis by Country, 2020 to 2035
  • Figure 7: Global Market Volume (Unit) Analysis by Country, 2020 to 2035
  • Figure 8: Global Market Value Share (%) and BPS Analysis by Country, 2025 to 2035
  • Figure 9: Global Market Y-o-Y Growth (%) Projections by Country, 2025 to 2035
  • Figure 10: Global Market Value (USD million) Analysis by Product Type, 2020 to 2035
  • Figure 11: Global Market Volume (Unit) Analysis by Product Type, 2020 to 2035
  • Figure 12: Global Market Value Share (%) and BPS Analysis by Product Type, 2025 to 2035
  • Figure 13: Global Market Y-o-Y Growth (%) Projections by Product Type, 2025 to 2035
  • Figure 14: Global Market Value (USD million) Analysis by Form, 2020 to 2035
  • Figure 15: Global Market Volume (Unit) Analysis by Form, 2020 to 2035
  • Figure 16: Global Market Value Share (%) and BPS Analysis by Form, 2025 to 2035
  • Figure 17: Global Market Y-o-Y Growth (%) Projections by Form, 2025 to 2035
  • Figure 18: Global Market Value (USD million) Analysis by Source, 2020 to 2035
  • Figure 19: Global Market Volume (Unit) Analysis by Source, 2020 to 2035
  • Figure 20: Global Market Value Share (%) and BPS Analysis by Source, 2025 to 2035
  • Figure 21: Global Market Y-o-Y Growth (%) Projections by Source, 2025 to 2035
  • Figure 22: Global Market Value (USD million) Analysis by Application, 2020 to 2035
  • Figure 23: Global Market Volume (Unit) Analysis by Application, 2020 to 2035
  • Figure 24: Global Market Value Share (%) and BPS Analysis by Application, 2025 to 2035
  • Figure 25: Global Market Y-o-Y Growth (%) Projections by Application, 2025 to 2035
  • Figure 26: Global Market Attractiveness by Product Type, 2025 to 2035
  • Figure 27: Global Market Attractiveness by Form, 2025 to 2035
  • Figure 28: Global Market Attractiveness by Source, 2025 to 2035
  • Figure 29: Global Market Attractiveness by Application, 2025 to 2035
  • Figure 30: Global Market Attractiveness by Country, 2025 to 2035
  • Figure 31: North America Market Value (USD million) by Product Type, 2025 to 2035
  • Figure 32: North America Market Value (USD million) by Form, 2025 to 2035
  • Figure 33: North America Market Value (USD million) by Source, 2025 to 2035
  • Figure 34: North America Market Value (USD million) by Application, 2025 to 2035
  • Figure 35: North America Market Value (USD million) by Country, 2025 to 2035
  • Figure 36: North America Market Value (USD million) Analysis by Country, 2020 to 2035
  • Figure 37: North America Market Volume (Unit) Analysis by Country, 2020 to 2035
  • Figure 38: North America Market Value Share (%) and BPS Analysis by Country, 2025 to 2035
  • Figure 39: North America Market Y-o-Y Growth (%) Projections by Country, 2025 to 2035
  • Figure 40: North America Market Value (USD million) Analysis by Product Type, 2020 to 2035
  • Figure 41: North America Market Volume (Unit) Analysis by Product Type, 2020 to 2035
  • Figure 42: North America Market Value Share (%) and BPS Analysis by Product Type, 2025 to 2035
  • Figure 43: North America Market Y-o-Y Growth (%) Projections by Product Type, 2025 to 2035
  • Figure 44: North America Market Value (USD million) Analysis by Form, 2020 to 2035
  • Figure 45: North America Market Volume (Unit) Analysis by Form, 2020 to 2035
  • Figure 46: North America Market Value Share (%) and BPS Analysis by Form, 2025 to 2035
  • Figure 47: North America Market Y-o-Y Growth (%) Projections by Form, 2025 to 2035
  • Figure 48: North America Market Value (USD million) Analysis by Source, 2020 to 2035
  • Figure 49: North America Market Volume (Unit) Analysis by Source, 2020 to 2035
  • Figure 50: North America Market Value Share (%) and BPS Analysis by Source, 2025 to 2035
  • Figure 51: North America Market Y-o-Y Growth (%) Projections by Source, 2025 to 2035
  • Figure 52: North America Market Value (USD million) Analysis by Application, 2020 to 2035
  • Figure 53: North America Market Volume (Unit) Analysis by Application, 2020 to 2035
  • Figure 54: North America Market Value Share (%) and BPS Analysis by Application, 2025 to 2035
  • Figure 55: North America Market Y-o-Y Growth (%) Projections by Application, 2025 to 2035
  • Figure 56: North America Market Attractiveness by Product Type, 2025 to 2035
  • Figure 57: North America Market Attractiveness by Form, 2025 to 2035
  • Figure 58: North America Market Attractiveness by Source, 2025 to 2035
  • Figure 59: North America Market Attractiveness by Application, 2025 to 2035
  • Figure 60: North America Market Attractiveness by Country, 2025 to 2035
  • Figure 61: Latin America Market Value (USD million) by Product Type, 2025 to 2035
  • Figure 62: Latin America Market Value (USD million) by Form, 2025 to 2035
  • Figure 63: Latin America Market Value (USD million) by Source, 2025 to 2035
  • Figure 64: Latin America Market Value (USD million) by Application, 2025 to 2035
  • Figure 65: Latin America Market Value (USD million) by Country, 2025 to 2035
  • Figure 66: Latin America Market Value (USD million) Analysis by Country, 2020 to 2035
  • Figure 67: Latin America Market Volume (Unit) Analysis by Country, 2020 to 2035
  • Figure 68: Latin America Market Value Share (%) and BPS Analysis by Country, 2025 to 2035
  • Figure 69: Latin America Market Y-o-Y Growth (%) Projections by Country, 2025 to 2035
  • Figure 70: Latin America Market Value (USD million) Analysis by Product Type, 2020 to 2035
  • Figure 71: Latin America Market Volume (Unit) Analysis by Product Type, 2020 to 2035
  • Figure 72: Latin America Market Value Share (%) and BPS Analysis by Product Type, 2025 to 2035
  • Figure 73: Latin America Market Y-o-Y Growth (%) Projections by Product Type, 2025 to 2035
  • Figure 74: Latin America Market Value (USD million) Analysis by Form, 2020 to 2035
  • Figure 75: Latin America Market Volume (Unit) Analysis by Form, 2020 to 2035
  • Figure 76: Latin America Market Value Share (%) and BPS Analysis by Form, 2025 to 2035
  • Figure 77: Latin America Market Y-o-Y Growth (%) Projections by Form, 2025 to 2035
  • Figure 78: Latin America Market Value (USD million) Analysis by Source, 2020 to 2035
  • Figure 79: Latin America Market Volume (Unit) Analysis by Source, 2020 to 2035
  • Figure 80: Latin America Market Value Share (%) and BPS Analysis by Source, 2025 to 2035
  • Figure 81: Latin America Market Y-o-Y Growth (%) Projections by Source, 2025 to 2035
  • Figure 82: Latin America Market Value (USD million) Analysis by Application, 2020 to 2035
  • Figure 83: Latin America Market Volume (Unit) Analysis by Application, 2020 to 2035
  • Figure 84: Latin America Market Value Share (%) and BPS Analysis by Application, 2025 to 2035
  • Figure 85: Latin America Market Y-o-Y Growth (%) Projections by Application, 2025 to 2035
  • Figure 86: Latin America Market Attractiveness by Product Type, 2025 to 2035
  • Figure 87: Latin America Market Attractiveness by Form, 2025 to 2035
  • Figure 88: Latin America Market Attractiveness by Source, 2025 to 2035
  • Figure 89: Latin America Market Attractiveness by Application, 2025 to 2035
  • Figure 90: Latin America Market Attractiveness by Country, 2025 to 2035
  • Figure 91: Western Europe Market Value (USD million) by Product Type, 2025 to 2035
  • Figure 92: Western Europe Market Value (USD million) by Form, 2025 to 2035
  • Figure 93: Western Europe Market Value (USD million) by Source, 2025 to 2035
  • Figure 94: Western Europe Market Value (USD million) by Application, 2025 to 2035
  • Figure 95: Western Europe Market Value (USD million) by Country, 2025 to 2035
  • Figure 96: Western Europe Market Value (USD million) Analysis by Country, 2020 to 2035
  • Figure 97: Western Europe Market Volume (Unit) Analysis by Country, 2020 to 2035
  • Figure 98: Western Europe Market Value Share (%) and BPS Analysis by Country, 2025 to 2035
  • Figure 99: Western Europe Market Y-o-Y Growth (%) Projections by Country, 2025 to 2035
  • Figure 100: Western Europe Market Value (USD million) Analysis by Product Type, 2020 to 2035
  • Figure 101: Western Europe Market Volume (Unit) Analysis by Product Type, 2020 to 2035
  • Figure 102: Western Europe Market Value Share (%) and BPS Analysis by Product Type, 2025 to 2035
  • Figure 103: Western Europe Market Y-o-Y Growth (%) Projections by Product Type, 2025 to 2035
  • Figure 104: Western Europe Market Value (USD million) Analysis by Form, 2020 to 2035
  • Figure 105: Western Europe Market Volume (Unit) Analysis by Form, 2020 to 2035
  • Figure 106: Western Europe Market Value Share (%) and BPS Analysis by Form, 2025 to 2035
  • Figure 107: Western Europe Market Y-o-Y Growth (%) Projections by Form, 2025 to 2035
  • Figure 108: Western Europe Market Value (USD million) Analysis by Source, 2020 to 2035
  • Figure 109: Western Europe Market Volume (Unit) Analysis by Source, 2020 to 2035
  • Figure 110: Western Europe Market Value Share (%) and BPS Analysis by Source, 2025 to 2035
  • Figure 111: Western Europe Market Y-o-Y Growth (%) Projections by Source, 2025 to 2035
  • Figure 112: Western Europe Market Value (USD million) Analysis by Application, 2020 to 2035
  • Figure 113: Western Europe Market Volume (Unit) Analysis by Application, 2020 to 2035
  • Figure 114: Western Europe Market Value Share (%) and BPS Analysis by Application, 2025 to 2035
  • Figure 115: Western Europe Market Y-o-Y Growth (%) Projections by Application, 2025 to 2035
  • Figure 116: Western Europe Market Attractiveness by Product Type, 2025 to 2035
  • Figure 117: Western Europe Market Attractiveness by Form, 2025 to 2035
  • Figure 118: Western Europe Market Attractiveness by Source, 2025 to 2035
  • Figure 119: Western Europe Market Attractiveness by Application, 2025 to 2035
  • Figure 120: Western Europe Market Attractiveness by Country, 2025 to 2035
  • Figure 121: Balkans & Baltic Market Value (USD million) by Product Type, 2025 to 2035
  • Figure 122: Balkans & Baltic Market Value (USD million) by Form, 2025 to 2035
  • Figure 123: Balkans & Baltic Market Value (USD million) by Source, 2025 to 2035
  • Figure 124: Balkans & Baltic Market Value (USD million) by Application, 2025 to 2035
  • Figure 125: Balkans & Baltic Market Value (USD million) by Country, 2025 to 2035
  • Figure 126: Balkans & Baltic Market Value (USD million) Analysis by Country, 2020 to 2035
  • Figure 127: Balkans & Baltic Market Volume (Unit) Analysis by Country, 2020 to 2035
  • Figure 128: Balkans & Baltic Market Value Share (%) and BPS Analysis by Country, 2025 to 2035
  • Figure 129: Balkans & Baltic Market Y-o-Y Growth (%) Projections by Country, 2025 to 2035
  • Figure 130: Balkans & Baltic Market Value (USD million) Analysis by Product Type, 2020 to 2035
  • Figure 131: Balkans & Baltic Market Volume (Unit) Analysis by Product Type, 2020 to 2035
  • Figure 132: Balkans & Baltic Market Value Share (%) and BPS Analysis by Product Type, 2025 to 2035
  • Figure 133: Balkans & Baltic Market Y-o-Y Growth (%) Projections by Product Type, 2025 to 2035
  • Figure 134: Balkans & Baltic Market Value (USD million) Analysis by Form, 2020 to 2035
  • Figure 135: Balkans & Baltic Market Volume (Unit) Analysis by Form, 2020 to 2035
  • Figure 136: Balkans & Baltic Market Value Share (%) and BPS Analysis by Form, 2025 to 2035
  • Figure 137: Balkans & Baltic Market Y-o-Y Growth (%) Projections by Form, 2025 to 2035
  • Figure 138: Balkans & Baltic Market Value (USD million) Analysis by Source, 2020 to 2035
  • Figure 139: Balkans & Baltic Market Volume (Unit) Analysis by Source, 2020 to 2035
  • Figure 140: Balkans & Baltic Market Value Share (%) and BPS Analysis by Source, 2025 to 2035
  • Figure 141: Balkans & Baltic Market Y-o-Y Growth (%) Projections by Source, 2025 to 2035
  • Figure 142: Balkans & Baltic Market Value (USD million) Analysis by Application, 2020 to 2035
  • Figure 143: Balkans & Baltic Market Volume (Unit) Analysis by Application, 2020 to 2035
  • Figure 144: Balkans & Baltic Market Value Share (%) and BPS Analysis by Application, 2025 to 2035
  • Figure 145: Balkans & Baltic Market Y-o-Y Growth (%) Projections by Application, 2025 to 2035
  • Figure 146: Balkans & Baltic Market Attractiveness by Product Type, 2025 to 2035
  • Figure 147: Balkans & Baltic Market Attractiveness by Form, 2025 to 2035
  • Figure 148: Balkans & Baltic Market Attractiveness by Source, 2025 to 2035
  • Figure 149: Balkans & Baltic Market Attractiveness by Application, 2025 to 2035
  • Figure 150: Balkans & Baltic Market Attractiveness by Country, 2025 to 2035
  • Figure 151: Russia & Belarus Market Value (USD million) by Product Type, 2025 to 2035
  • Figure 152: Russia & Belarus Market Value (USD million) by Form, 2025 to 2035
  • Figure 153: Russia & Belarus Market Value (USD million) by Source, 2025 to 2035
  • Figure 154: Russia & Belarus Market Value (USD million) by Application, 2025 to 2035
  • Figure 155: Russia & Belarus Market Value (USD million) by Country, 2025 to 2035
  • Figure 156: Russia & Belarus Market Value (USD million) Analysis by Country, 2020 to 2035
  • Figure 157: Russia & Belarus Market Volume (Unit) Analysis by Country, 2020 to 2035
  • Figure 158: Russia & Belarus Market Value Share (%) and BPS Analysis by Country, 2025 to 2035
  • Figure 159: Russia & Belarus Market Y-o-Y Growth (%) Projections by Country, 2025 to 2035
  • Figure 160: Russia & Belarus Market Value (USD million) Analysis by Product Type, 2020 to 2035
  • Figure 161: Russia & Belarus Market Volume (Unit) Analysis by Product Type, 2020 to 2035
  • Figure 162: Russia & Belarus Market Value Share (%) and BPS Analysis by Product Type, 2025 to 2035
  • Figure 163: Russia & Belarus Market Y-o-Y Growth (%) Projections by Product Type, 2025 to 2035
  • Figure 164: Russia & Belarus Market Value (USD million) Analysis by Form, 2020 to 2035
  • Figure 165: Russia & Belarus Market Volume (Unit) Analysis by Form, 2020 to 2035
  • Figure 166: Russia & Belarus Market Value Share (%) and BPS Analysis by Form, 2025 to 2035
  • Figure 167: Russia & Belarus Market Y-o-Y Growth (%) Projections by Form, 2025 to 2035
  • Figure 168: Russia & Belarus Market Value (USD million) Analysis by Source, 2020 to 2035
  • Figure 169: Russia & Belarus Market Volume (Unit) Analysis by Source, 2020 to 2035
  • Figure 170: Russia & Belarus Market Value Share (%) and BPS Analysis by Source, 2025 to 2035
  • Figure 171: Russia & Belarus Market Y-o-Y Growth (%) Projections by Source, 2025 to 2035
  • Figure 172: Russia & Belarus Market Value (USD million) Analysis by Application, 2020 to 2035
  • Figure 173: Russia & Belarus Market Volume (Unit) Analysis by Application, 2020 to 2035
  • Figure 174: Russia & Belarus Market Value Share (%) and BPS Analysis by Application, 2025 to 2035
  • Figure 175: Russia & Belarus Market Y-o-Y Growth (%) Projections by Application, 2025 to 2035
  • Figure 176: Russia & Belarus Market Attractiveness by Product Type, 2025 to 2035
  • Figure 177: Russia & Belarus Market Attractiveness by Form, 2025 to 2035
  • Figure 178: Russia & Belarus Market Attractiveness by Source, 2025 to 2035
  • Figure 179: Russia & Belarus Market Attractiveness by Application, 2025 to 2035
  • Figure 180: Russia & Belarus Market Attractiveness by Country, 2025 to 2035
  • Figure 181: Central Asia Market Value (USD million) by Product Type, 2025 to 2035
  • Figure 182: Central Asia Market Value (USD million) by Form, 2025 to 2035
  • Figure 183: Central Asia Market Value (USD million) by Source, 2025 to 2035
  • Figure 184: Central Asia Market Value (USD million) by Application, 2025 to 2035
  • Figure 185: Central Asia Market Value (USD million) by Country, 2025 to 2035
  • Figure 186: Central Asia Market Value (USD million) Analysis by Country, 2020 to 2035
  • Figure 187: Central Asia Market Volume (Unit) Analysis by Country, 2020 to 2035
  • Figure 188: Central Asia Market Value Share (%) and BPS Analysis by Country, 2025 to 2035
  • Figure 189: Central Asia Market Y-o-Y Growth (%) Projections by Country, 2025 to 2035
  • Figure 190: Central Asia Market Value (USD million) Analysis by Product Type, 2020 to 2035
  • Figure 191: Central Asia Market Volume (Unit) Analysis by Product Type, 2020 to 2035
  • Figure 192: Central Asia Market Value Share (%) and BPS Analysis by Product Type, 2025 to 2035
  • Figure 193: Central Asia Market Y-o-Y Growth (%) Projections by Product Type, 2025 to 2035
  • Figure 194: Central Asia Market Value (USD million) Analysis by Form, 2020 to 2035
  • Figure 195: Central Asia Market Volume (Unit) Analysis by Form, 2020 to 2035
  • Figure 196: Central Asia Market Value Share (%) and BPS Analysis by Form, 2025 to 2035
  • Figure 197: Central Asia Market Y-o-Y Growth (%) Projections by Form, 2025 to 2035
  • Figure 198: Central Asia Market Value (USD million) Analysis by Source, 2020 to 2035
  • Figure 199: Central Asia Market Volume (Unit) Analysis by Source, 2020 to 2035
  • Figure 200: Central Asia Market Value Share (%) and BPS Analysis by Source, 2025 to 2035
  • Figure 201: Central Asia Market Y-o-Y Growth (%) Projections by Source, 2025 to 2035
  • Figure 202: Central Asia Market Value (USD million) Analysis by Application, 2020 to 2035
  • Figure 203: Central Asia Market Volume (Unit) Analysis by Application, 2020 to 2035
  • Figure 204: Central Asia Market Value Share (%) and BPS Analysis by Application, 2025 to 2035
  • Figure 205: Central Asia Market Y-o-Y Growth (%) Projections by Application, 2025 to 2035
  • Figure 206: Central Asia Market Attractiveness by Product Type, 2025 to 2035
  • Figure 207: Central Asia Market Attractiveness by Form, 2025 to 2035
  • Figure 208: Central Asia Market Attractiveness by Source, 2025 to 2035
  • Figure 209: Central Asia Market Attractiveness by Application, 2025 to 2035
  • Figure 210: Central Asia Market Attractiveness by Country, 2025 to 2035
  • Figure 211: East Asia Market Value (USD million) by Product Type, 2025 to 2035
  • Figure 212: East Asia Market Value (USD million) by Form, 2025 to 2035
  • Figure 213: East Asia Market Value (USD million) by Source, 2025 to 2035
  • Figure 214: East Asia Market Value (USD million) by Application, 2025 to 2035
  • Figure 215: East Asia Market Value (USD million) by Country, 2025 to 2035
  • Figure 216: East Asia Market Value (USD million) Analysis by Country, 2020 to 2035
  • Figure 217: East Asia Market Volume (Unit) Analysis by Country, 2020 to 2035
  • Figure 218: East Asia Market Value Share (%) and BPS Analysis by Country, 2025 to 2035
  • Figure 219: East Asia Market Y-o-Y Growth (%) Projections by Country, 2025 to 2035
  • Figure 220: East Asia Market Value (USD million) Analysis by Product Type, 2020 to 2035
  • Figure 221: East Asia Market Volume (Unit) Analysis by Product Type, 2020 to 2035
  • Figure 222: East Asia Market Value Share (%) and BPS Analysis by Product Type, 2025 to 2035
  • Figure 223: East Asia Market Y-o-Y Growth (%) Projections by Product Type, 2025 to 2035
  • Figure 224: East Asia Market Value (USD million) Analysis by Form, 2020 to 2035
  • Figure 225: East Asia Market Volume (Unit) Analysis by Form, 2020 to 2035
  • Figure 226: East Asia Market Value Share (%) and BPS Analysis by Form, 2025 to 2035
  • Figure 227: East Asia Market Y-o-Y Growth (%) Projections by Form, 2025 to 2035
  • Figure 228: East Asia Market Value (USD million) Analysis by Source, 2020 to 2035
  • Figure 229: East Asia Market Volume (Unit) Analysis by Source, 2020 to 2035
  • Figure 230: East Asia Market Value Share (%) and BPS Analysis by Source, 2025 to 2035
  • Figure 231: East Asia Market Y-o-Y Growth (%) Projections by Source, 2025 to 2035
  • Figure 232: East Asia Market Value (USD million) Analysis by Application, 2020 to 2035
  • Figure 233: East Asia Market Volume (Unit) Analysis by Application, 2020 to 2035
  • Figure 234: East Asia Market Value Share (%) and BPS Analysis by Application, 2025 to 2035
  • Figure 235: East Asia Market Y-o-Y Growth (%) Projections by Application, 2025 to 2035
  • Figure 236: East Asia Market Attractiveness by Product Type, 2025 to 2035
  • Figure 237: East Asia Market Attractiveness by Form, 2025 to 2035
  • Figure 238: East Asia Market Attractiveness by Source, 2025 to 2035
  • Figure 239: East Asia Market Attractiveness by Application, 2025 to 2035
  • Figure 240: East Asia Market Attractiveness by Country, 2025 to 2035
  • Figure 241: South Asia & Pacific Market Value (USD million) by Product Type, 2025 to 2035
  • Figure 242: South Asia & Pacific Market Value (USD million) by Form, 2025 to 2035
  • Figure 243: South Asia & Pacific Market Value (USD million) by Source, 2025 to 2035
  • Figure 244: South Asia & Pacific Market Value (USD million) by Application, 2025 to 2035
  • Figure 245: South Asia & Pacific Market Value (USD million) by Country, 2025 to 2035
  • Figure 246: South Asia & Pacific Market Value (USD million) Analysis by Country, 2020 to 2035
  • Figure 247: South Asia & Pacific Market Volume (Unit) Analysis by Country, 2020 to 2035
  • Figure 248: South Asia & Pacific Market Value Share (%) and BPS Analysis by Country, 2025 to 2035
  • Figure 249: South Asia & Pacific Market Y-o-Y Growth (%) Projections by Country, 2025 to 2035
  • Figure 250: South Asia & Pacific Market Value (USD million) Analysis by Product Type, 2020 to 2035
  • Figure 251: South Asia & Pacific Market Volume (Unit) Analysis by Product Type, 2020 to 2035
  • Figure 252: South Asia & Pacific Market Value Share (%) and BPS Analysis by Product Type, 2025 to 2035
  • Figure 253: South Asia & Pacific Market Y-o-Y Growth (%) Projections by Product Type, 2025 to 2035
  • Figure 254: South Asia & Pacific Market Value (USD million) Analysis by Form, 2020 to 2035
  • Figure 255: South Asia & Pacific Market Volume (Unit) Analysis by Form, 2020 to 2035
  • Figure 256: South Asia & Pacific Market Value Share (%) and BPS Analysis by Form, 2025 to 2035
  • Figure 257: South Asia & Pacific Market Y-o-Y Growth (%) Projections by Form, 2025 to 2035
  • Figure 258: South Asia & Pacific Market Value (USD million) Analysis by Source, 2020 to 2035
  • Figure 259: South Asia & Pacific Market Volume (Unit) Analysis by Source, 2020 to 2035
  • Figure 260: South Asia & Pacific Market Value Share (%) and BPS Analysis by Source, 2025 to 2035
  • Figure 261: South Asia & Pacific Market Y-o-Y Growth (%) Projections by Source, 2025 to 2035
  • Figure 262: South Asia & Pacific Market Value (USD million) Analysis by Application, 2020 to 2035
  • Figure 263: South Asia & Pacific Market Volume (Unit) Analysis by Application, 2020 to 2035
  • Figure 264: South Asia & Pacific Market Value Share (%) and BPS Analysis by Application, 2025 to 2035
  • Figure 265: South Asia & Pacific Market Y-o-Y Growth (%) Projections by Application, 2025 to 2035
  • Figure 266: South Asia & Pacific Market Attractiveness by Product Type, 2025 to 2035
  • Figure 267: South Asia & Pacific Market Attractiveness by Form, 2025 to 2035
  • Figure 268: South Asia & Pacific Market Attractiveness by Source, 2025 to 2035
  • Figure 269: South Asia & Pacific Market Attractiveness by Application, 2025 to 2035
  • Figure 270: South Asia & Pacific Market Attractiveness by Country, 2025 to 2035
  • Figure 271: Middle East & Africa Market Value (USD million) by Product Type, 2025 to 2035
  • Figure 272: Middle East & Africa Market Value (USD million) by Form, 2025 to 2035
  • Figure 273: Middle East & Africa Market Value (USD million) by Source, 2025 to 2035
  • Figure 274: Middle East & Africa Market Value (USD million) by Application, 2025 to 2035
  • Figure 275: Middle East & Africa Market Value (USD million) by Country, 2025 to 2035
  • Figure 276: Middle East & Africa Market Value (USD million) Analysis by Country, 2020 to 2035
  • Figure 277: Middle East & Africa Market Volume (Unit) Analysis by Country, 2020 to 2035
  • Figure 278: Middle East & Africa Market Value Share (%) and BPS Analysis by Country, 2025 to 2035
  • Figure 279: Middle East & Africa Market Y-o-Y Growth (%) Projections by Country, 2025 to 2035
  • Figure 280: Middle East & Africa Market Value (USD million) Analysis by Product Type, 2020 to 2035
  • Figure 281: Middle East & Africa Market Volume (Unit) Analysis by Product Type, 2020 to 2035
  • Figure 282: Middle East & Africa Market Value Share (%) and BPS Analysis by Product Type, 2025 to 2035
  • Figure 283: Middle East & Africa Market Y-o-Y Growth (%) Projections by Product Type, 2025 to 2035
  • Figure 284: Middle East & Africa Market Value (USD million) Analysis by Form, 2020 to 2035
  • Figure 285: Middle East & Africa Market Volume (Unit) Analysis by Form, 2020 to 2035
  • Figure 286: Middle East & Africa Market Value Share (%) and BPS Analysis by Form, 2025 to 2035
  • Figure 287: Middle East & Africa Market Y-o-Y Growth (%) Projections by Form, 2025 to 2035
  • Figure 288: Middle East & Africa Market Value (USD million) Analysis by Source, 2020 to 2035
  • Figure 289: Middle East & Africa Market Volume (Unit) Analysis by Source, 2020 to 2035
  • Figure 290: Middle East & Africa Market Value Share (%) and BPS Analysis by Source, 2025 to 2035
  • Figure 291: Middle East & Africa Market Y-o-Y Growth (%) Projections by Source, 2025 to 2035
  • Figure 292: Middle East & Africa Market Value (USD million) Analysis by Application, 2020 to 2035
  • Figure 293: Middle East & Africa Market Volume (Unit) Analysis by Application, 2020 to 2035
  • Figure 294: Middle East & Africa Market Value Share (%) and BPS Analysis by Application, 2025 to 2035
  • Figure 295: Middle East & Africa Market Y-o-Y Growth (%) Projections by Application, 2025 to 2035
  • Figure 296: Middle East & Africa Market Attractiveness by Product Type, 2025 to 2035
  • Figure 297: Middle East & Africa Market Attractiveness by Form, 2025 to 2035
  • Figure 298: Middle East & Africa Market Attractiveness by Source, 2025 to 2035
  • Figure 299: Middle East & Africa Market Attractiveness by Application, 2025 to 2035
  • Figure 300: Middle East & Africa Market Attractiveness by Country, 2025 to 2035

Frequently Asked Questions

What is the projected market value of the algae products market in 2025?

The projected market value in 2025 is USD 5.85 billion.

What is the forecast market value of the algae products market by 2035?

The forecast market value by 2035 is USD 10.28 billion.

What is the expected CAGR for the algae products market from 2025 to 2035?

The expected CAGR from 2025 to 2035 is 5.8%.

Which segment will lead the algae products market in 2035?

The liquid segment is expected to lead the algae products market in 2035, with approximately 55.0% market share.

Which region is expected to experience the highest growth in the algae products market?

India is expected to be the fastest-growing market in the algae products market, with a projected 6.5% CAGR.

Explore Similar Insights

Future Market Insights

Algae Products Market