The air filters market is expected to experience substantial growth between 2025 and 2035, driven by rising concerns over air pollution, increasing industrialization, and growing awareness about indoor air quality. Air filtration systems are widely used across residential, commercial, and industrial sectors to remove airborne contaminants, allergens, and particulate matter, ensuring cleaner and healthier air. With urbanization accelerating and pollution levels increasing, the demand for efficient air filtration solutions is on the rise.
One of the key drivers of the air filters market is the heightened awareness of respiratory health. Governments and regulatory bodies worldwide are implementing stringent air quality standards to combat pollution-related illnesses. The adoption of air filters in HVAC systems, automobiles, and industrial facilities has also expanded significantly, contributing to market growth.
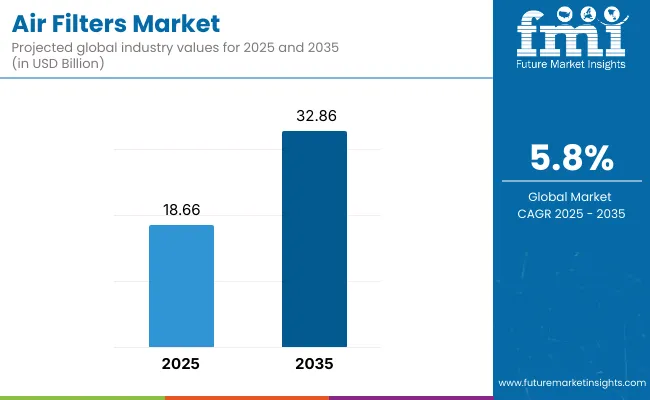
The air filters market accounted for USD 18.66 billion in the year 2025 and is expected to reach USD 32.86 billion by the year 2035, at a CAGR of 5.8% during the forecast period. Technological advancements are playing a crucial role in shaping the future of air filtration. Smart air filters equipped with IoT sensors, real-time air quality monitoring, and self-cleaning mechanisms are gaining traction.

Additionally, innovations in nanofiber filtration and electrostatic precipitators are improving filtration efficiency and energy savings. The increasing use of sustainable and eco-friendly filter materials, such as biodegradable and washable filters, is also driving market adoption.
North America leads the air filters market, with the United States and Canada being the key contributors. Stringent air quality regulations, growing industrial applications, and high consumer demand for indoor air purification solutions are fueling market growth. The region also sees strong adoption in automotive and healthcare industries.
Europe’s market is driven by regulatory frameworks emphasizing clean air initiatives. Germany, the UK, and France are leading markets due to strict emission standards and increasing investments in smart filtration technologies. The growing adoption of HEPA and activated carbon filters in both residential and commercial spaces is further boosting demand.
Asia-Pacific is witnessing rapid expansion, with China, India, and Japan being key markets. The region’s high pollution levels, coupled with urbanization and industrialization, are driving demand for air filtration systems. Government initiatives to curb air pollution and improve public health are also playing a crucial role in market growth.
Latin America is an emerging market for air filters, particularly in Brazil and Mexico. The increasing presence of manufacturing industries, along with growing awareness of air quality issues, is propelling demand for advanced filtration solutions. However, cost constraints and limited infrastructure remain challenges.
The Middle East & Africa is gradually expanding its air filters market, with Saudi Arabia, UAE, and South Africa seeing significant growth. The rising adoption of air purification systems in commercial buildings, hospitals, and industrial facilities is driving demand. Sandstorms and high pollution levels in certain areas further necessitate effective air filtration solutions.
High Maintenance Costs and Filter Replacement Issues
The Air Filters Market faces challenges related to high maintenance costs, frequent filter replacements, and disposal concerns. While air filtration is crucial for indoor air quality and industrial applications, the recurring expenses associated with changing filters and ensuring system efficiency pose financial burdens for both residential and commercial users. Additionally, traditional air filters contribute to environmental waste, leading to growing concerns over sustainability and recyclability.
Increasing Demand for Advanced Filtration and Smart Air Purification
Rising pollution levels, growing health awareness, and stringent government regulations on air quality are driving the demand for advanced air filters. The market is witnessing a shift toward high-efficiency particulate air (HEPA) filters, activated carbon filters, and nanofiber-based filtration technologies.
Additionally, smart air filters with IoT-enabled monitoring, self-cleaning capabilities, and AI-based air quality management are gaining traction. The adoption of sustainable, biodegradable, and washable filter materials presents significant growth opportunities for manufacturers.
Between 2020 and 2024, the Air Filters Market saw increased adoption due to rising air pollution, post-pandemic health concerns, and urbanization. Demand surged across residential, commercial, and industrial sectors, with governments enforcing stricter air quality standards.
However, challenges related to product affordability, filter longevity, and disposal practices persisted. The market responded with innovations in multi-layer filtration systems, antimicrobial coatings, and energy-efficient air purification solutions.
Looking ahead to 2025 to 2035, the market will experience significant advancements in smart filtration, self-regenerating filters, and sustainable air purification solutions. AI-powered air quality monitoring systems, electrostatic air filters, and graphene-based nanofilters will enhance filtration efficiency. Additionally, demand for customized filtration solutions in industries such as healthcare, automotive, and HVAC will drive further innovation.
Market Shifts: A Comparative Analysis 2020 to 2024 vs. 2025 to 2035
| Market Shift | 2020 to 2024 Trends |
|---|---|
| Regulatory Landscape | Compliance with air quality standards and emissions regulations |
| Market Growth | High demand due to pollution concerns and urbanization |
| Industry Adoption | Adoption of HEPA and activated carbon filters |
| Technology Innovations | Development of antimicrobial and multi-layer filtration |
| Market Competition | Presence of traditional filter manufacturers |
| Sustainability and Efficiency | Limited use of eco-friendly filter materials |
| Smart Filtration Integration | Basic air quality monitoring in high-end filtration systems |
| Market Shift | 2025 to 2035 Projections |
|---|---|
| Regulatory Landscape | Stricter environmental mandates, increased sustainability requirements |
| Market Growth | Expansion in industrial, healthcare, and automotive filtration applications |
| Industry Adoption | Growth in AI-driven air purification, electrostatic and nanofiber-based filters |
| Technology Innovations | Smart filtration with IoT integration, self-cleaning and self-regenerating filters |
| Market Competition | Entry of high-tech startups focusing on advanced air purification technologies |
| Sustainability and Efficiency | Large-scale adoption of biodegradable, recyclable, and washable filter materials |
| Smart Filtration Integration | AI-driven air quality control, real-time filter performance analytics |

The United States air filters market is experiencing steady growth, driven by rising concerns over air pollution, increasing adoption of air purification systems in residential and commercial spaces, and strict environmental regulations.
The Environmental Protection Agency (EPA) and the Occupational Safety and Health Administration (OSHA) have set stringent standards for air quality in industrial and commercial facilities, leading to widespread adoption of high-efficiency particulate air (HEPA) filters and activated carbon filters.
With the increasing frequency of wildfires in the western USA, there has been a surge in demand for residential and portable air filters that protect against fine particulate matter (PM2.5). Additionally, hospitals, laboratories, and cleanroom facilities are investing in advanced air filtration technologies to maintain sterile environments.
The rising adoption of electric vehicles (EVs) is also driving demand for cabin air filters, while the expansion of data centers and semiconductor manufacturing is increasing the need for high-efficiency air filtration systems. Furthermore, smart air filters with IoT-enabled monitoring and self-cleaning mechanisms are gaining popularity in smart homes and commercial buildings.
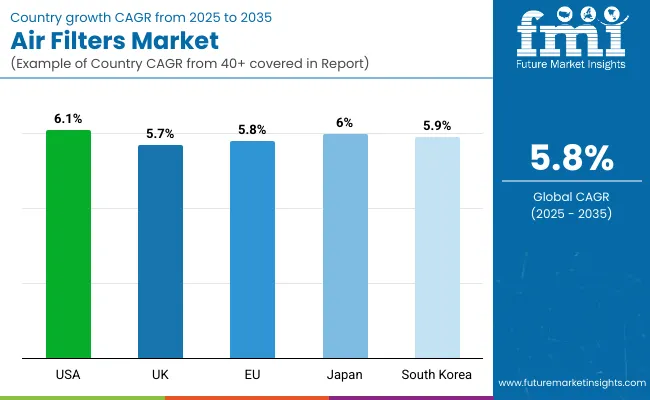
| Country | CAGR (2025 to 2035) |
|---|---|
| USA | 6.1% |
The United Kingdom air filters market is expanding steadily, driven by rising concerns over urban air pollution, increasing adoption of air purifiers in residential spaces, and stringent indoor air quality regulations in workplaces. With London and other major cities experiencing high levels of nitrogen dioxide (NO2) and particulate pollution, there is a growing consumer shift toward air filtration systems in homes and offices.
The UK government’s initiatives to reduce carbon emissions and improve air quality in schools, hospitals, and public buildings are leading to increased adoption of HEPA and activated carbon filters. Additionally, the rising demand for HVAC air filtration solutions in commercial spaces and growing adoption of electric and hybrid vehicles is boosting demand for advanced cabin air filters.
With increasing awareness of health risks related to indoor air pollution, more consumers are investing in smart air purifiers with real-time air quality monitoring.
| Country | CAGR (2025 to 2035) |
|---|---|
| UK | 5.7% |
The European Union (EU) air filters market is growing steadily due to strict environmental and industrial air quality regulations, rising health awareness, and increasing demand for energy-efficient HVAC systems. Countries such as Germany, France, and Italy are at the forefront of industrial air filtration adoption due to strong manufacturing and automotive sectors.
The EU’s Green Deal and air quality directives are compelling industries to adopt high-efficiency air filters to reduce emissions and improve workplace air quality. Additionally, the push for sustainable and carbon-neutral buildings is leading to increased demand for air filtration systems in smart homes, commercial spaces, and public institutions.
With the rising adoption of electric vehicles (EVs) and hybrid cars, manufacturers are developing high-performance cabin air filters to improve indoor air quality in vehicles. The expansion of data centers and pharmaceutical cleanrooms is also driving demand for high-performance HEPA and ULPA filters.
| Country | CAGR (2025 to 2035) |
|---|---|
| European Union | 5.8% |
Japan’s air filters market is experiencing steady growth, driven by high urban population density, increasing health concerns over air pollution, and advanced technological innovations in air filtration. With Japan’s strict air quality regulations for industrial emissions and urban pollution control, high-efficiency air filtration systems are being widely adopted in factories, commercial buildings, and residential spaces.
The rise in smart city developments and connected home technologies is supporting the integration of IoT-enabled air filters in HVAC systems. Additionally, the demand for advanced cabin air filters in vehicles is increasing, particularly as Japan’s electric vehicle (EV) and hybrid car market expands.
With rising concerns over airborne diseases, hospitals, pharmaceutical companies, and biotechnology firms are investing in HEPA and ULPA filtration technologies to maintain sterile environments.
| Country | CAGR (2025 to 2035) |
|---|---|
| Japan | 6.0% |
South Korea’s air filters market is expanding rapidly, driven by rising air pollution levels, growing consumer health awareness, and government initiatives promoting clean air technology. Major cities like Seoul and Busan frequently experience high levels of fine particulate matter (PM2.5), increasing demand for air filtration solutions in homes, offices, and public spaces.
The South Korean government’s focus on green energy and sustainability is supporting the adoption of energy-efficient air filters in residential and industrial buildings. Additionally, the expansion of electric vehicle (EV) adoption is boosting demand for cabin air filters that remove allergens, pollutants, and odors.
Smart home technology integration is also driving the adoption of IoT-enabled air filtration systems, making South Korea one of the fastest-growing markets for smart air purification solutions.
| Country | CAGR (2025 to 2035) |
|---|---|
| South Korea | 5.9% |
HEPA (High-Efficiency Particulate Air) filters hold the largest share in the air filters market due to their exceptional ability to remove at least 99.97% of airborne particles, including dust, pollen, bacteria, viruses, and smoke particles. These filters are extensively used in residential, commercial, and industrial settings, where air quality is a top priority.
Rising Demand for HEPA Filters Drives Market Expansion
The growing awareness of indoor air pollution and its harmful effects has significantly boosted the demand for HEPA filters. Consumers and businesses are increasingly adopting HEPA-based air purifiers to eliminate airborne pollutants, especially in urban areas with high levels of smog and particulate matter (PM2.5 and PM10).
In the healthcare sector, hospitals, clinics, and pharmaceutical facilities rely on HEPA filters to maintain sterile environments, preventing the spread of infections and airborne diseases. Similarly, laboratories handling sensitive experiments and biological materials incorporate HEPA filtration to ensure contamination-free conditions.
The automotive industry has also witnessed an increase in HEPA filter usage, as car manufacturers integrate these filters into vehicle cabin air systems to improve air quality and enhance passenger health. The rising adoption of electric and hybrid vehicles, which emphasize advanced air purification, has further driven market growth.
With technological advancements, modern HEPA filters now come with antimicrobial coatings and activated carbon layers, enhancing their ability to neutralize bacteria, odors, and volatile organic compounds (VOCs). The integration of smart monitoring sensors in HEPA filtration systems is another emerging trend, allowing users to track real-time air quality data and filter replacement schedules through mobile applications.
Baghouse filters play a crucial role in industrial air purification, particularly in manufacturing, mining, cement production, and power generation. These filters operate using fabric filter bags, which efficiently trap fine dust, smoke, and harmful particulates before they are released into the atmosphere.
Industrial Demand for Baghouse Filters Rises with Stricter Air Quality Regulations
Governments worldwide have introduced stringent emissions control regulations, compelling industries to implement advanced dust collection and air filtration systems. Regulatory bodies such as the Environmental Protection Agency (EPA), Occupational Safety and Health Administration (OSHA), and European Environment Agency (EEA) have set strict limits on air pollutants, increasing the adoption of baghouse filtration systems in heavy industries, steel manufacturing, and chemical processing plants.
Baghouse filters offer cost-effective, high-capacity dust filtration, making them indispensable for industries dealing with high volumes of airborne particulates. In metalworking and welding processes, these filters effectively capture metal fumes and fine particulate matter, ensuring workplace safety and compliance with environmental laws.
To improve efficiency and longevity, manufacturers are developing self-cleaning baghouse filters, which use pulse-jet technology to remove collected dust without manual intervention. This advancement reduces maintenance costs, enhances filter lifespan, and improves energy efficiency, making baghouse filters more attractive for large-scale industrial use.
The residential sector remains a significant driver of the air filters market, as consumers become increasingly concerned about airborne allergens, dust mites, mold spores, and pet dander. The demand for smart air purification systems has risen due to heightened awareness of respiratory diseases such as asthma, bronchitis, and allergies.
The Air Filters Market is experiencing steady growth driven by rising concerns over air pollution, increasing adoption of HVAC systems, and stricter government regulations on air quality across industrial and residential sectors.
Technological advancements in HEPA filtration, activated carbon filters, and AI-enabled air purification systems are further enhancing market potential. Key players are focusing on smart filtration systems, antimicrobial coatings, and energy-efficient air filter designs to cater to growing consumer and industrial demands.
Market Share Analysis by Key Players & Filtration Technology Providers
| Company/Organization Name | Estimated Market Share (%) |
|---|---|
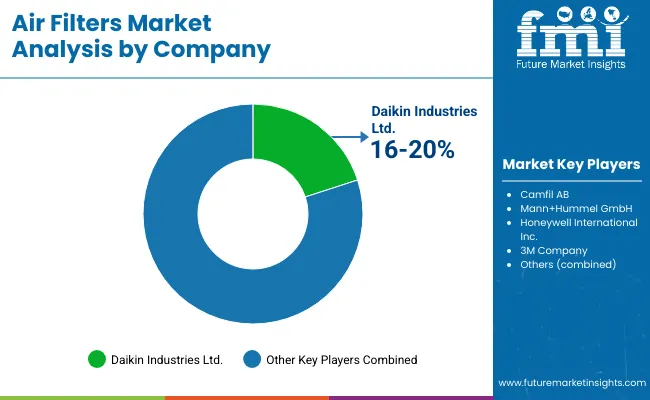
| Daikin Industries Ltd. | 16-20% |
| Camfil AB | 12-16% |
| Mann+Hummel GmbH | 10-14% |
| Honeywell International Inc. | 8-12% |
| 3M Company | 6-10% |
| Other Air Filter Manufacturers (combined) | 30-40% |
| Company/Organization Name | Key Offerings/Activities |
|---|---|
| Daikin Industries Ltd. | Provides high-efficiency HVAC air filters, electrostatic filtration technology, and smart air purification solutions. |
| Camfil AB | Specializes in industrial air filters with HEPA and ULPA technology, focusing on cleanroom and pharmaceutical applications. |
| Mann+Hummel GmbH | Offers advanced air filtration solutions for automotive, industrial, and residential applications, integrating nanofiber technology. |
| Honeywell International Inc. | Develops smart air filters with AI-based air quality monitoring and energy-efficient filtration systems. |
| 3M Company | Manufactures high-performance air filters for HVAC, medical, and industrial applications with activated carbon and antimicrobial coatings. |
Key Market Insights

Daikin Industries Ltd. (16-20%)
Daikin leads the market with a strong presence in the HVAC filtration segment, offering high-efficiency particulate air (HEPA) filters, electrostatic filtration, and energy-efficient air purifiers.
Camfil AB (12-16%)
Camfil is a key player in industrial-grade air filtration solutions, supplying high-performance HEPA and ULPA filters for pharmaceuticals, food processing, and cleanroom applications.
Mann+Hummel GmbH (10-14%)
Mann+Hummel specializes in automotive and industrial air filters, leveraging nanofiber filtration and AI-powered air quality monitoring for enhanced efficiency.
Honeywell International Inc. (8-12%)
Honeywell focuses on smart air filtration solutions, integrating IoT-based monitoring and real-time air purification systems for residential and commercial spaces.
3M Company (6-10%)
3M is known for its innovative air filtration products, including antimicrobial HVAC filters, activated carbon filters, and medical-grade air purification systems.
Other Key Players (30-40% Combined)
The overall market size for air filters market was USD 18.66 billion in 2025.
The air filters market is expected to reach USD 32.86 billion in 2035.
The top 5 countries which drives the development of air filters market are USA, European Union, Japan, South Korea and UK.
HEPA and baghouse filters are in demand supplier to command significant share over the assessment period.


Full Research Suite comprises of:
Market outlook & trends analysis
Interviews & case studies
Strategic recommendations
Vendor profiles & capabilities analysis
5-year forecasts
8 regions and 60+ country-level data splits
Market segment data splits
12 months of continuous data updates
DELIVERED AS:
PDF EXCEL ONLINE
Aircraft Filters Market Size and Share Forecast Outlook 2025 to 2035
Air Compressor Filters and Compressed Air Dryers Market Growth - Trends & Forecast 2025 to 2035
Automotive Air Filters Market Size and Share Forecast Outlook 2025 to 2035
Food & Beverages Air Filters Market Size and Share Forecast Outlook 2025 to 2035
Airless Paint Spray System Market Size and Share Forecast Outlook 2025 to 2035
Air Caster Skids System Market Size and Share Forecast Outlook 2025 to 2035
Airborne Molecular Contamination Control Services Market Forecast and Outlook 2025 to 2035
Airflow Balancer Market Size and Share Forecast Outlook 2025 to 2035
Aircraft Cabin Environment Sensor Market Forecast and Outlook 2025 to 2035
Aircraft Flight Control System Market Size and Share Forecast Outlook 2025 to 2035
Airborne Radar Market Size and Share Forecast Outlook 2025 to 2035
Aircraft Electric Motor Market Forecast Outlook 2025 to 2035
Airport Ground Transportation Market Forecast and Outlook 2025 to 2035
Airless Sprayer Accessories Market Size and Share Forecast Outlook 2025 to 2035
Air Purge Valve Market Size and Share Forecast Outlook 2025 to 2035
Air Flow Sensors Market Size and Share Forecast Outlook 2025 to 2035
Air Separation Plant Market Size and Share Forecast Outlook 2025 to 2035
Air Cooled Turbo Generators Market Size and Share Forecast Outlook 2025 to 2035
Aircraft Cooling Turbines Market Size and Share Forecast Outlook 2025 to 2035
Air Conditioning Compressor Market Size and Share Forecast Outlook 2025 to 2035

Thank you!
You will receive an email from our Business Development Manager. Please be sure to check your SPAM/JUNK folder too.
Chat With
MaRIA