The AI in IoT Market is estimated to be valued at USD 92.9 billion in 2025 and is projected to reach USD 172.8 billion by 2035, registering a compound annual growth rate (CAGR) of 6.4% over the forecast period.
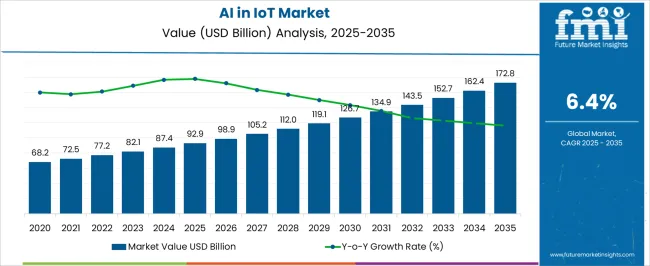
| Metric | Value |
|---|---|
| AI in IoT Market Estimated Value in (2025 E) | USD 92.9 billion |
| AI in IoT Market Forecast Value in (2035 F) | USD 172.8 billion |
| Forecast CAGR (2025 to 2035) | 6.4% |
The AI in IoT market is expanding rapidly as industries integrate intelligent systems to enhance connectivity, decision making, and operational efficiency. The convergence of artificial intelligence with IoT infrastructure is enabling predictive analytics, real time monitoring, and automated control across diverse applications.
Growing adoption of 5G, edge computing, and cloud based platforms has improved scalability and responsiveness, further accelerating market penetration. Enterprises are increasingly investing in AI driven IoT solutions to optimize supply chains, reduce downtime, and deliver personalized customer experiences.
Regulatory emphasis on data transparency and sustainability goals is also encouraging adoption in sectors such as manufacturing, healthcare, and energy. The outlook remains positive as organizations continue to leverage AI powered IoT to drive innovation, reduce costs, and maintain competitive advantages in a digitally connected ecosystem.
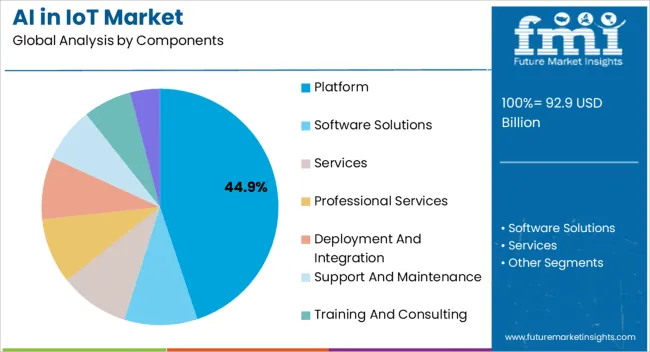
The platform segment is projected to contribute 44.90% of total market revenue by 2025 within the component category, making it the leading segment. This dominance is driven by the growing reliance on integrated frameworks that allow seamless connectivity, device management, and data integration.
Platforms enable scalability and interoperability across complex IoT ecosystems, ensuring efficient deployment and monitoring of connected assets. Enterprises value the role of platforms in unifying hardware, networks, and applications into a single manageable environment.
The ability to support predictive analytics, cloud integration, and real time insights has strengthened the adoption of AI enabled IoT platforms, establishing them as the core foundation of the market.
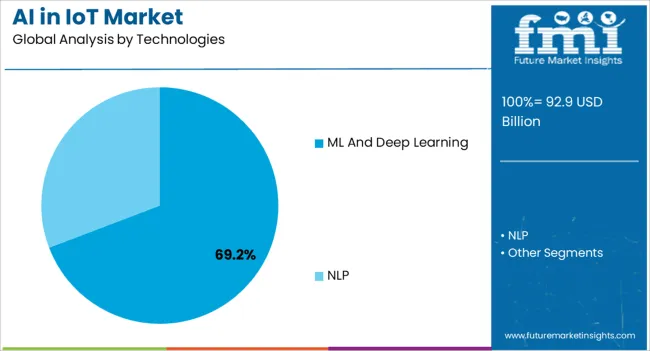
Machine learning and deep learning technologies are expected to hold 69.20% of total revenue by 2025 within the technology category, positioning them as the dominant technologies. Their leadership is attributed to the ability to analyze vast datasets, uncover patterns, and enable predictive and prescriptive decision making.
These technologies empower IoT devices with self learning capabilities, allowing systems to improve performance and accuracy over time. Adoption is reinforced by their role in enabling anomaly detection, natural language processing, image recognition, and advanced automation.
Integration of machine learning and deep learning with IoT has become vital for predictive maintenance, personalized services, and autonomous operations, solidifying their prominence within the market.
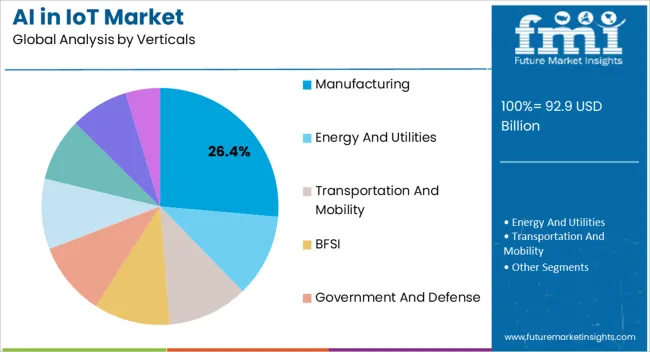
The manufacturing segment is projected to capture 26.40% of the overall revenue by 2025 within the verticals category, making it the leading industry segment. This growth is being propelled by the adoption of AI powered IoT solutions to streamline production, monitor equipment health, and enhance operational efficiency.
Manufacturers are leveraging real time data insights to optimize resource utilization, improve product quality, and minimize downtime through predictive maintenance. The integration of connected devices with AI algorithms is facilitating smart factories that prioritize automation, safety, and cost reduction.
Regulatory focus on sustainability and the push for Industry 4.0 practices have further accelerated deployment in this sector. As a result, manufacturing continues to lead in embracing AI in IoT, showcasing strong value creation through efficiency gains and digital transformation.
The growing IoT market has exponentially formed demand for managing and securing data generated from the smart devices. The AI integrated IoT technology enables the devices to record and track insights and offer a real-time visibility thereby enhancing customer experience. With decreasing delivery time and low latency, along with real-time tracking of the products, the market is likely to experience considerable growth in the forecast period.
In the retail sector, cloud AI is being used mainly for enhancing the customer experience of their programs and creating IoT-based products that focus on customers. A new generation of legacy vendors offer software to gain a stronghold throughout the value chain. This has formed as a result of intense competition in industrial IoT and market maturation.
Recently their has been a growing demand among the manufacturers to deploy computer based 100% automated data management system (DMS). As part of an AI-enabled IoT application for manufacturing, IoT-enabled applications can also be used to effectively monitor and optimize the performance of equipment, produce quality control, and collaborate between machines and humans.
Manufacturing and supply chain operations that are faster and more efficient can significantly reduce the time required for a product to reach its market.
As a result of the rising demand for advanced artificial intelligence applications in the BFSI sector, IoT may grow to become a more secure way to conduct business transactions and help to close data breaches. The development of technological and scientific advancement in IoT and the development of artificial intelligence in automation devices may ensure the market may thrive and develop further.
Edge chips are facing the challenge of power consumption and size constraints in automotive and consumer electronics. As there is a rising demand for real-time, low-latency response edge AI in these markets. With its SoC, the company hopes to resolve this issue with a computing platform that uses less power and is compact while delivering sufficient computing power for biometrics and AI.
The high cost of artificial intelligence and the lack of knowledge among consumers may slow its growth in the IoT sector. The growing concerns about privacy and security of personal data are one of the key factors leading to the decline of this market.
This artificial intelligence is expected to produce unmemorable results where this technology may result in mundane jobs for low-income-level people. All of these factors contribute to a decline in the market.
Platforms account for a leading market share of AI in IoT, with a CAGR of 5.7% during the forecast period. AI capabilities, such as machine learning-based analytics, are increasingly being incorporated with IoT platforms and solution vendors' solutions. To tap into the massive amount of data generated by IoT devices. As enterprises across numerous vertical industry segments integrate IoT solutions with AI capabilities.
They are becoming nimble while reducing reaction time and relying less on traditional tools for analysis of IoT data, and depending more on advanced technological solutions. Additionally, these solutions improve human-machine interactions by enhancing operational prediction accuracy and agility.
Platforms were created to enable developers to connect, manage, and integrate data collected from IoT devices into various applications and services. Platforms like these are designed to reduce the development time and cost of IoT solutions by setting up standard components upon which enterprises can build. These factors have contributed to the market growth of platforms in the IoT market.
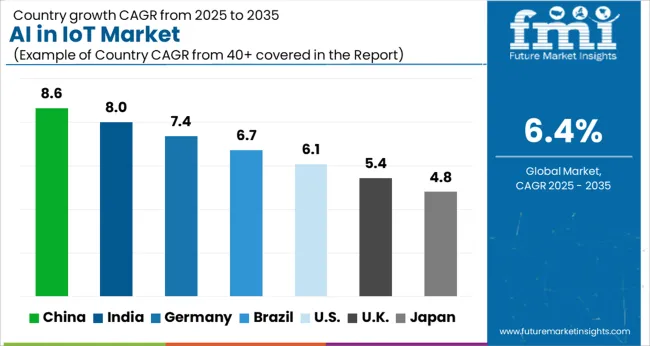
| Countries | Revenue Share % (2025) |
|---|---|
| United States | 19.4% |
| Germany | 9.4% |
| Japan | 6.8% |
| Australia | 2.8% |
| North America | 29.4% |
| Europe | 22.9% |
| Countries | CAGR % (2025 to 2035) |
|---|---|
| China | 7.1% |
| India | 6.8% |
| United Kingdom | 5.5% |
North America is anticipated to hold the largest market for AI in IoT market. The market for artificial intelligence in IoT in the United States is expected to account for a 5.8% CAGR during the forecast period. By 2035, the market is expected to be worth USD 49 billion in the future years.
Businesses in North America are adopting the AI technology thereby propelling the demand for te market. This growing adoption of technology along wiith cloud services is mainly owing to the presence of key players operating in the region. Increased investments for developing new technologies have significantly contributed to the growth of this sector.
Asia Pacific is anticipated to dominate the AI in IoT market during the forecast period. In the upcoming years, the market is anticipated to increase significantly due to the continued investments and growth of the IT business in China. In China, the company is anticipated to grow at a 5.6% CAGR throughout the forecast period.
As a result of the growth of Internet penetration, advances in technology, the proliferation of mobile devices, and networking infrastructure. As well as the influx of consumers utilizing technologically advanced and connected devices. All are factors contributing to the development of the market in this region. Increasing industrial automation in the region is also driving the demand for artificial intelligence in IoTs in China .
According to the forecast, Japan may reach a CAGR of 5.2% in 2035. Increasing industrial production and the expansion of mobile technologies are expected to boost market demand for AI in IoT in this region. Market value in South Korea is expected to reach USD 5.3 billion during the forecast period. A CAGR of 5% is predicted for the market during the forecast period.
As a result of the growing revolution in the consumer shopping experience and the implementation of smart building infrastructures, AI in IoT has become an integral part of the growing IoT market in this region. Besides boosting the economy, this region is focusing on digitization post-Covid-19 by using AI and 5G networks.
During the forecast period, the artificial intelligence market for IoT in the United Kingdom is expected to thrive at a CAGR of 4.6% during the period. Because of the emergence of IoT and Machine-to-Machine technologies, AI in IoTs is expected to see a high degree of growth in this region. With the increasing demand to increase research and industrial capacity in this region, the market demand for AI in IoT is growing.
| Category | By Component |
|---|---|
| Leading Segment | Platform |
| Market Share (2025) | 47.3% |
| Category | By Technologies |
|---|---|
| Leading Segment | ML and Deep Learning |
| Market Share (2025) | 79.4% |
Machine learning holds a substantial market share in the AI in IoT segment. The market is anticipated to record a CAGR of 5.7% during the forecast period. With massive data volumes, machine learning is becoming a powerful tool for data analysis. In conjunction with ML and edge computing, IoT devices can filter out most background noise and allow cloud analytics engines and edge devices to analyze the relevant data.
AI is part of the overall value of the Internet of Things, as analytics plays a key role in increasing the overall benefit of IoT. By adopting deep learning and machine learning and AI, companies can use behavioral insights. To predict the demands of their customers and networks and automatically alert them to potential problems, and customize their products.
Targeting the sensors to capture certain things, deep learning, and machine learning tools may help fuse the layers to share reports in real time with the authorities. Thus, deep learning and machine learning are gaining popularity in the market.
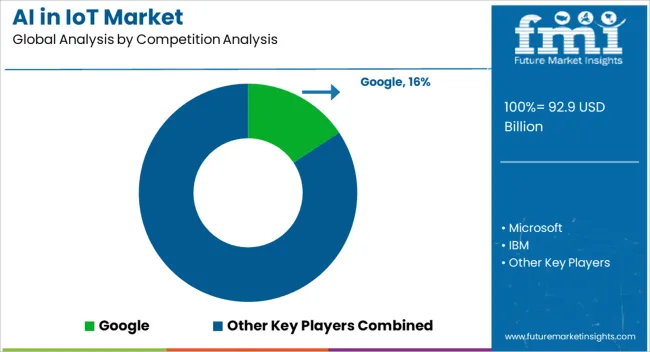
Through strategic partnerships, manufacturers can increase production and meet consumer demand, increasing both their revenues and market share. The introduction of new products and technologies may allow end-users to reap the benefits of new technologies. Increasing the company's production capacity is one of the potential benefits of a strategic partnership.
Market Developments:
The global AI in IoT market is estimated to be valued at USD 92.9 billion in 2025.
The market size for the AI in IoT market is projected to reach USD 172.8 billion by 2035.
The AI in IoT market is expected to grow at a 6.4% CAGR between 2025 and 2035.
The key product types in AI in IoT market are platform, software solutions, services, professional services, deployment and integration, support and maintenance, training and consulting and managed services.
In terms of technologies, ml and deep learning segment to command 69.2% share in the AI in IoT market in 2025.


Full Research Suite comprises of:
Market outlook & trends analysis
Interviews & case studies
Strategic recommendations
Vendor profiles & capabilities analysis
5-year forecasts
8 regions and 60+ country-level data splits
Market segment data splits
12 months of continuous data updates
DELIVERED AS:
PDF EXCEL ONLINE
Biotainer Market
Multistrain Probiotics Market Analysis - Size, Share, and Forecast Outlook 2025 to 2035
Single-strain Probiotics Market
Comprehensive Probiotic Strains market analysis and forecast by strain type, application and region.
IoT For Cold Chain Monitoring Market Size and Share Forecast Outlook 2025 to 2035
UK Probiotic Strains Market Trends – Growth, Demand & Forecast 2025–2035
IoT in Supply Chain Market Insights – Trends, Growth & Forecast 2023-2033
USA Probiotic Strains Market Report – Trends, Demand & Industry Forecast 2025–2035
ASEAN Probiotic Strains Market Analysis – Size, Share & Forecast 2025–2035
Demand for Multistrain Probiotics in EU Size and Share Forecast Outlook 2025 to 2035
Europe Probiotic Strains Market Outlook – Share, Growth & Forecast 2025–2035
Australia Probiotic Strains Market Growth – Trends, Demand & Innovations 2025–2035
Latin America Probiotic Strains Market Insights – Demand, Size & Industry Trends 2025–2035
Air Flow Sensors Market Size and Share Forecast Outlook 2025 to 2035
Air Separation Plant Market Size and Share Forecast Outlook 2025 to 2035
Air Cooled Turbo Generators Market Size and Share Forecast Outlook 2025 to 2035
Aircraft Galley Systems Market Size and Share Forecast Outlook 2025 to 2035
Aircraft Battery Market Size and Share Forecast Outlook 2025 to 2035
Aircraft Floor Panels Market Size and Share Forecast Outlook 2025 to 2035
Aircraft Fuel Systems Market Size and Share Forecast Outlook 2025 to 2035

Thank you!
You will receive an email from our Business Development Manager. Please be sure to check your SPAM/JUNK folder too.
Chat With
MaRIA