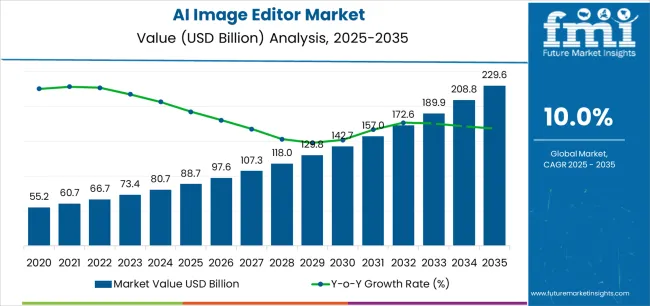
The AI Image Editor Market is estimated to be valued at USD 88.7 billion in 2025 and is projected to reach USD 229.6 billion by 2035, registering a compound annual growth rate (CAGR) of 10.0% over the forecast period.
The AI Image Editor market is witnessing significant growth, driven by the increasing demand for automated image editing solutions across professional, creative, and commercial sectors. Advances in artificial intelligence, machine learning, and computer vision technologies have enabled platforms to perform complex image enhancement, retouching, and manipulation tasks with high precision and efficiency. Organizations and individuals are increasingly adopting AI image editors to reduce manual editing time, improve content quality, and optimize creative workflows.
Integration with cloud-based storage, collaborative tools, and digital asset management systems is further accelerating adoption. Rising demand for personalized visual content in marketing, social media, e-commerce, and entertainment is fueling market expansion. Additionally, enterprises are leveraging AI image editing to maintain brand consistency, enhance product presentation, and deliver visually engaging content to customers.
Regulatory compliance related to copyright, image authenticity, and ethical use of AI is shaping platform features As technological innovation continues and demand for scalable, AI-powered image editing solutions rises, the market is poised for sustained growth across multiple sectors globally.

| Metric | Value |
|---|---|
| AI Image Editor Market Estimated Value in (2025 E) | USD 88.7 billion |
| AI Image Editor Market Forecast Value in (2035 F) | USD 229.6 billion |
| Forecast CAGR (2025 to 2035) | 10.0% |
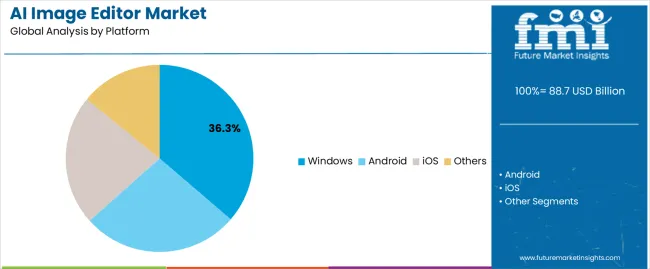
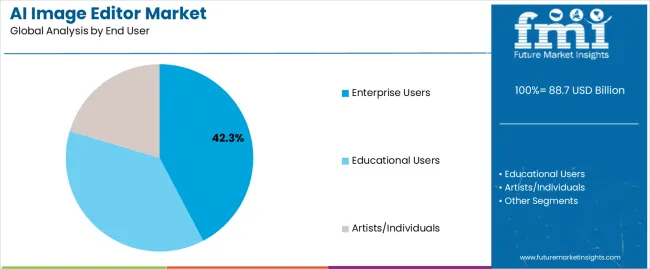
The market is segmented by Platform and End User and region. By Platform, the market is divided into Windows, Android, iOS, and Others. In terms of End User, the market is classified into Enterprise Users, Educational Users, and Artists/Individuals. Regionally, the market is classified into North America, Latin America, Western Europe, Eastern Europe, Balkan & Baltic Countries, Russia & Belarus, Central Asia, East Asia, South Asia & Pacific, and the Middle East & Africa.

The Windows platform segment is projected to hold 36.3% of the AI Image Editor market revenue in 2025, establishing it as the leading platform. Growth in this segment is being driven by the widespread adoption of Windows operating systems across enterprise and professional environments, which provides a stable and compatible platform for AI-based image editing software. Windows-compatible AI editors benefit from extensive hardware support, high processing power, and integration with productivity and creative software ecosystems.
Enterprises and creative professionals favor Windows platforms due to ease of deployment, software compatibility, and scalability for high-resolution and batch image processing tasks. Continuous updates and support from Microsoft enhance platform stability, reliability, and security, increasing user confidence in adopting AI solutions.
The growing demand for AI-driven automation, real-time editing, and seamless integration with enterprise workflows is further reinforcing adoption As AI-powered image editing becomes integral to digital content creation, Windows is expected to maintain its leading position due to performance, compatibility, and user familiarity.

The enterprise users segment is expected to account for 42.3% of the market revenue in 2025, making it the leading end-user category. Growth is being driven by the increasing adoption of AI image editing solutions in marketing, e-commerce, advertising, media, and publishing industries to streamline workflows, enhance content quality, and reduce operational costs. Enterprises leverage AI image editors for batch processing, brand consistency, automated retouching, and rapid creation of visual content at scale.
Integration with enterprise content management, collaborative tools, and digital asset management platforms enables seamless workflows and improved productivity. Rising emphasis on delivering personalized and visually engaging content to target audiences has increased demand for advanced editing capabilities powered by AI.
Regulatory and compliance considerations related to copyright, brand protection, and content authenticity further influence enterprise adoption As organizations continue to prioritize efficiency, scalability, and high-quality visual content creation, the enterprise users segment is expected to remain the primary driver of AI image editor market growth globally.
Development of Machine Learning Models and New Algorithms
The development of machine learning models and new algorithms is one of the lucrative investment opportunities in the market. New machine learning is able to analyze the image and work according to consumer demand, which is anticipated to gain market potential during the forecast period.
Creating Individual Software Platforms
Creating individual software platforms that can use all professionals, such as graphic designers, visual content editors, and image editors. That platform also offers a wide range of features and tools that provide convenience to consumers according to their needs. Also, the platform can be customizable according to the work of those professionals.
Developing Innovative Mobile Apps
Manufacturers can gain major market share by developing mobile apps in the coming years. With help of the mobile apps, individuals can edit their images and their content on the go. These mobile applications are offering a wide range of features and tools that have attracted consumers in recent years.
Investment in Research and Development of Innovative Features
Investment in research and development of innovative features that can streamline and automate the essential process represents immense opportunities for stakeholders. Companies have to increase funding for their R&D department to gain maximum market share during the forecast period.
| Attributes | Details |
|---|---|
| Top Platform | Windows |
| Market share in 2025 | 36.30% |
The availability of powerful hardware and operating systems is maintaining the dominance of the Windows segment in the market. More professional graphic designers and image editors are actively using the Windows platform. Having a vast ecosystem of third-party developers and vendors, windows is anticipated to gain attraction in the coming years. A larger user base all over the world is driving the demand for the segment in the current period.
| Attributes | Details |
|---|---|
| Top End Use | Enterprise Users |
| Market share in 2025 | 42.30% |
The need for a cost-effective solution as compared to traditional image editors is driving the segment growth. As AI imaging tools reduce operational costs and labor charges, gaining popularity among enterprise users. Also, the AI image editor software is considered a time-saving aspect for them in the current period.
| Countries | CAGR through 2035 |
|---|---|
| United States | 7.40% |
| China | 11.0% |
| Germany | 2.00% |
| Japan | 3.30% |
| Australia | 14.00% |
In the current period, artificial intelligence gained much popularity in various industries in the United States. The need for ease and convenience in the photography and design sector has been observed in recent years. The graphic designers and photo editors are using AI in their work to reduce time and operational costs in the country.
The social media industry on its peak in the United States. Due to the rise of social media platforms, there is demand for high-quality images and graphics has increased over the years. With the use of AI, image editors are improving their work potential in the country.
The business sector is contributing to the AI image editor market growth in the United States. Business sectors are engaging their clients through online media and social media channels. Thus, the demand for quality videography and image editing has increased throughout the years.
The use of smartphones and other devices is gaining a major market share in the country. The need for photo editing while on the go has increased in recent years in China. People are actively looking for a platform where they complete their editing work on the go, thus AI has emerged as an important aspect for them.
By providing easy-to-use solutions and convenience to image editors, AI has gained attraction over the years in China. Moreover, mobile photography has increased in recent years in China.
The government is playing a major role in the growth of the market in China. The Chinese government is heavily investing in technological advancements and their promotions. Also, providing funding for the companies, who are working on new technologies and implementing them.
Surge in demand for visual content in the marketing and advertising sector in Germany. The business sector is actively looking for high-quality content visuals to attract their clients and gain potential in the business industry. Thus, many businesses are relying on technological advances such as AI and others in Germany. Also, AI is helping businesses to create high-quality graphics and images without investing much in equipment or hiring individuals in Germany.
The use of AI by professional graphic designers and photographers has been observed in recent years in the country. Demand for high-quality videography and images by consumers. Thus, professionals are using AI to streamline their workflow and enhance their work in the region.
Japan is considered a technologically advanced region across the world. Software developers are increasingly investing in research and development activities in the country. Several players in the country are looking to enhance and making more advanced their AI software. People are heavily adopting AI tools to reform their work potential in Japan.
Mobile photography has played a major role in contributing to the AI image editor market growth in recent years. People prefer modern AI tools to edit their visual content and images. There is a wide range of AI image editor software available in the South Korean market which makes easier adoption of affordable AI image editor tools.

As the demand for AI-powered image editing tools continues to grow, we can expect to see more companies entering the market and offering innovative new features and capabilities. The AI image editor market is anticipated to gain potential growth during the forecast period owing to innovations and research.
As manufacturers are expanding their product range to gain customer attraction. Several companies are looking to improvising consumer experience by implementing new marketing strategies in the current period.
Recent Developments
The global AI image editor market is estimated to be valued at USD 88.7 billion in 2025.
The market size for the AI image editor market is projected to reach USD 229.6 billion by 2035.
The AI image editor market is expected to grow at a 10.0% CAGR between 2025 and 2035.
The key product types in AI image editor market are windows, android, ios and others.
In terms of end user, enterprise users segment to command 42.3% share in the AI image editor market in 2025.


Our Research Products

The "Full Research Suite" delivers actionable market intel, deep dives on markets or technologies, so clients act faster, cut risk, and unlock growth.

The Leaderboard benchmarks and ranks top vendors, classifying them as Established Leaders, Leading Challengers, or Disruptors & Challengers.

Locates where complements amplify value and substitutes erode it, forecasting net impact by horizon

We deliver granular, decision-grade intel: market sizing, 5-year forecasts, pricing, adoption, usage, revenue, and operational KPIs—plus competitor tracking, regulation, and value chains—across 60 countries broadly.

Spot the shifts before they hit your P&L. We track inflection points, adoption curves, pricing moves, and ecosystem plays to show where demand is heading, why it is changing, and what to do next across high-growth markets and disruptive tech

Real-time reads of user behavior. We track shifting priorities, perceptions of today’s and next-gen services, and provider experience, then pace how fast tech moves from trial to adoption, blending buyer, consumer, and channel inputs with social signals (#WhySwitch, #UX).

Partner with our analyst team to build a custom report designed around your business priorities. From analysing market trends to assessing competitors or crafting bespoke datasets, we tailor insights to your needs.
Supplier Intelligence
Discovery & Profiling
Capacity & Footprint
Performance & Risk
Compliance & Governance
Commercial Readiness
Who Supplies Whom
Scorecards & Shortlists
Playbooks & Docs
Category Intelligence
Definition & Scope
Demand & Use Cases
Cost Drivers
Market Structure
Supply Chain Map
Trade & Policy
Operating Norms
Deliverables
Buyer Intelligence
Account Basics
Spend & Scope
Procurement Model
Vendor Requirements
Terms & Policies
Entry Strategy
Pain Points & Triggers
Outputs
Pricing Analysis
Benchmarks
Trends
Should-Cost
Indexation
Landed Cost
Commercial Terms
Deliverables
Brand Analysis
Positioning & Value Prop
Share & Presence
Customer Evidence
Go-to-Market
Digital & Reputation
Compliance & Trust
KPIs & Gaps
Outputs
Full Research Suite comprises of:
Market outlook & trends analysis
Interviews & case studies
Strategic recommendations
Vendor profiles & capabilities analysis
5-year forecasts
8 regions and 60+ country-level data splits
Market segment data splits
12 months of continuous data updates
DELIVERED AS:
PDF EXCEL ONLINE
Online Paint Editor App Market Size and Share Forecast Outlook 2025 to 2035
Image Recognition in Retail Market Size and Share Forecast Outlook 2025 to 2035
AI-Powered Embryo Selection Market Analysis - Size, Share, and Forecast Outlook 2025 to 2035
AI Code Assistant Market Size and Share Forecast Outlook 2025 to 2035
AI-Based Data Observability Software Market Size and Share Forecast Outlook 2025 to 2035
Air Fryer Paper Liners Market Size and Share Forecast Outlook 2025 to 2035
Air Struts Market Size and Share Forecast Outlook 2025 to 2035
AI-powered Wealth Management Solution Market Size and Share Forecast Outlook 2025 to 2035
Airless Paint Spray System Market Size and Share Forecast Outlook 2025 to 2035
AI Powered Software Testing Tool Market Size and Share Forecast Outlook 2025 to 2035
AI Document Generator Market Size and Share Forecast Outlook 2025 to 2035
AI in Fintech Market Size and Share Forecast Outlook 2025 to 2035
Air Caster Skids System Market Size and Share Forecast Outlook 2025 to 2035
AI-Driven HD Mapping Market Size and Share Forecast Outlook 2025 to 2035
AI Platform Market Size and Share Forecast Outlook 2025 to 2035
Image-Guided Injectables Market Forecast and Outlook 2025 to 2035
AI-powered Spinal Surgery Market Size and Share Forecast Outlook 2025 to 2035
AI-Powered Sleep Technologies Market Size and Share Forecast Outlook 2025 to 2035
AI-Powered Gait & Mobility Analytics Market Size and Share Forecast Outlook 2025 to 2035
AI-Powered Behavioral Therapy Market Size and Share Forecast Outlook 2025 to 2035

Thank you!
You will receive an email from our Business Development Manager. Please be sure to check your SPAM/JUNK folder too.
Chat With
MaRIA