Agricultural Surfactants Market Size and Share Forecast Outlook (2025 to 2035)

Agrochemical surfactants are one of the major classes of chemical in the agriculture sector, increasingly adopted to enhance the performance of crop protection chemicals and improve productivity and efficiency on farms. If you like reading real market survey and analysis then read on and get more insight on Agricultural Surfactants Market.

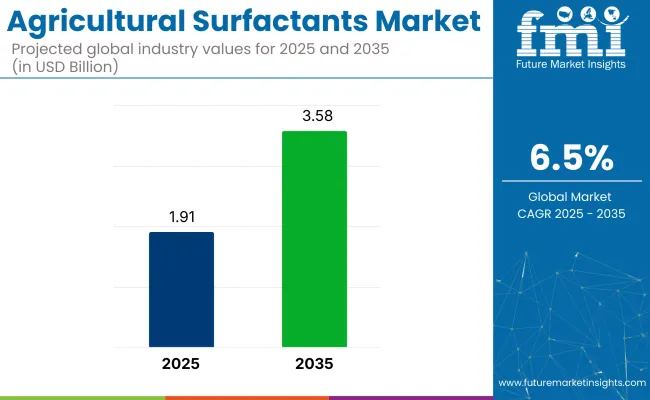
The market is projected to grow at a compound annual growth rate (CAGR) of 6.5% during the forecast period 2025 to 2035 and will reach USD 3,577.8 million by 2035. Market drivers are: growing global food intake, intensification of modern agriculture practices and increasing application of agrochemicals in developing economies.

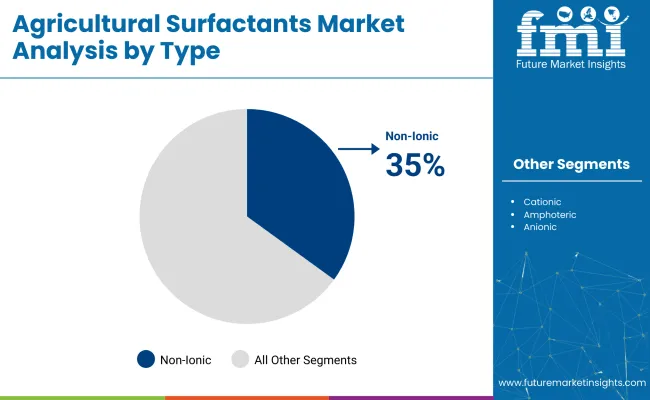
The wetting, spreading, and penetration properties of pesticides, herbicides, fungicides, and fertilizers are improved by their use. The farmers want to use and spend less, but at the same time not to decrease the effectiveness of using active chemicals, therefore the interest for surfactants is so widespread, because they can help reduce the amount of applied active chemicals. Over this period, most of these non-ionic surfactants will continue to account for the largest shares owing to their compatibility profiles as well as their lower phytotoxicity.

There is also a growing interest in bio-based and biodegradable surfactants made from plant oils and sugars, which are in line with sustainability trends globally. To improve activity of agrochemicals in a wide range of climatic and soil conditions, manufacturers are focusing on developing innovative and multi-functional blends of surfactants.

The demand for surfactant additives is also being driven by the trend tighter towards precise agriculture and the growing adoption of drone based spraying technologies for increased efficiency. The chemicals and environment-based regulation frameworks are more stringent, and this in turn drives consumer demand to invest more in low-tox toxicity and green surfactant business solutions mainly because increase in productivity equals the needs for eco-friendly surfactants.

Attributes Description
Estimated Global Agricultural Surfactants Industry Size (2025E) USD 1,907.9 million
Projected Global Agricultural Surfactants Industry Value (2035F) USD 3,577.8 million
Value-based CAGR (2025 to 2035) 6.5%

This is mainly due to the growing agricultural sector in countries in this region like India and China along with the increasing awareness about farming and the rise of government support for sustainable farming inputs. North America and Europe are mature markets, but continue to spend on cutting-edge technologies and sustainable agriculture practices. Emphasis on food security, climate resilient agriculture along with integrated pest management will boost healthy growth as well as technological developments across all key regional agriculture surfactants markets.

Semi-annual Agricultural Surfactants Market Update

The below table shows the comparative market share of agricultural surfactants over the span of six months for the base year (2024) and the current year (2025) of the worldwide agricultural surfactants market. Hence, it enables the unveiling of major performance trends, as well as indicating revenue recognition patterns, ultimately providing stakeholders with better visibility on the growth path for the year. H1, or “half of the year,” January - June. July-December:H2 (second half)

Particular Value CAGR
H1 4.6% (2024 to 2034)
H2 4.9% (2024 to 2034)
H1 5.4% (2025 to 2035)
H2 5.6% (2025 to 2035)

As far as the agricultural surfactant market is concerned, a comparative study of the growth trend is useful, as the performance of the market-demand and supply-during 2024 and 2025 varies widely. This market is expected to grow at 6.5% compounded growth rate in the period of H1 2024 and at growth rate of 6.6% in period of H2 2024.

Next, the number is forecasted to be 6.7% in H1 and 6.8% in H2 of 2025. With the increasing world population, there is a growing need for effective and sustainable food production methods. And the above fluctuations are common. Nonetheless, long-term growth remains on track owing to the rising emphasis on enhancing crop yield and quality combined with the increasing adoption of precision farming practices.

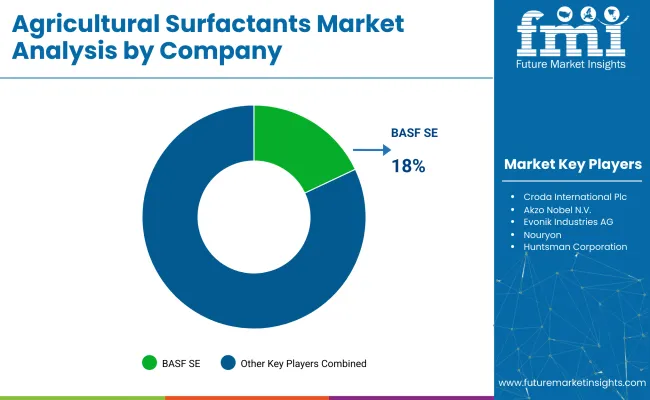
Market Concentration

Tier 1 Market analysis and insights covered in the high-quality North America industrial gases market report are based upon SWOT analysis on which businesses can trust confidently. Some of the leading players in the North America industrial gases market include BASF SE, Dow Inc. and other companies.

As a result of substantial investment in research and development, they offer a wide range of surfactant products for use in various agricultural formulations, including herbicide, insecticide and fungicide. They are both naked competitors in the market, with a wide geographic footprint and a willingness to innovate. ​

Tier 2 players such as Croda International Plc, Evonik Industries AG have formed significant mass in crucial markets, with a focus on sustainable and ecofriendly manufacturing. To profit from this emerging opportunity, these companies are widely targeting niche domains such as bio-based surfactants which are gaining popularity among environmentally-conscious consumers to drive the sales. From corralling their product offerings with trends towards greener more sustainable agricultural practices, they are also able to earn excess market share. ​

Tier 3 consists of emerging brands such as Wilbur-Ellis Company, Helena Agri-Enterprises LLC and other niche players. These companies offer custom surfactant formulations suited for specialized applications, including specialty crops and precision agriculture. They emphasize small-scale production and direct-to-consumer sales channels and cater to specialized markets that require tailored and unique agricultural solutions.

Latest Report on Agrochemicals Market by Accord Market Research Industrial Developments and Updates These businesses are knowledgeable about and experienced with helping farmers make their surfactants work better in agriculture. ​ This organizational framework mirrors the competitive landscape of the agricultural surfactant industry, highlighting how various players leverage their unique advantages to meet varied customer needs, and respond to evolving market conditions.

Understanding Shift in Agricultural Surfactants Demand Trends and How Key Brands Are Addressing To This

Augmented Adoption of Sustainable and Bio-based Surfactants

Shift: Growing demand for bio-based surfactants derived from renewable resources due to environmental sustainability in agriculture. ​

Strategic Response: Manufacturers spending towards bio-based surfactants as per eco-sensitive consumer demands as well as compliance dynamics of environmental regulations. ​

Growing Popularity of Precision Agriculture Methods

Shift: This rise in precision agriculture adoption is contributing to the increased functionality of agrochemicals, which in turn will lead to the growth of surfactants and help maximize crop production. ​

Strategic Response: Manufacturers driven by precision farming practices are emerging with novel surfactant products that foster the application and better performance of pesticides and fertilizers. ​

Expansion in Emerging Markets

Shift: Emerging economies have been witnessing increased agricultural activities, particularly in Asia-Pacific, which will drive the demand for Agricultural Surfactants ​

Strategic Response: Industry participants are expanding their reach in the regions with strategic partnerships, localized manufacturing, and regionspecific marketing efforts to capture the developing market opportunity. ​

National Academy of Engineering and American Academy of Arts Sculpture Forms fellow

Shift: Surfactant chemistries advancements ramp up the development of products that perform better, while being kind to the planet. ​

Strategic Response: Organizations have been channelizing their growth towards R&D drives for the innovation of surfactants with superior functional properties, enhanced spreading, wetting and penetration features, while being least impactful to the environment. ​

Another reason for this is the strict regulation.

Shift: Globally governments have begun implementing strict measures to ban agrochemicals including surfactants, for the safety of both humans and the environment. ​

Strategic Response: Manufacturers are reformulating to meet regulatory standards and gaining certifications to remain eligible for market access. ​

The Rise of Integrated Pest Management (IPM)

Shift: Integrated Pest Management is being increasingly adopted as the go-to pest control approach beyond over-reliance on chemicals. ​

Strategic Response: The surfactant manufacturers will evaluate surfactants that could then be assigned as agents with a role in IPM strategies will benefit from establishing themselves and their product line as a component of IPM thus ensuring their use and acceptance as part of a preventive pest and disease management effort. ​

Changes in Prices of Raw Material

Shift: Changes in raw materials prices lead to altered production costs and profitability margins, making the agricultural surfactant market vulnerable. ​

Strategic Response: Companies are exploring alternative raw materials, improving supply chain efficiencies, and introducing cost-effective production methods to mitigate the effects of raw material price volatility. ​

End on appropriate knowledge and applicability of surfactant

Shift: Organization through training programs and agricultural extension services PER is teaching farmers on surfactants and their benefits and how to use them. ​

Strategic Response: Needless to say, such strategic moves give an indication of how the leading players are adapting to the transforming paradigm of the agricultural surfactants market by inserting themselves with changing consumer trends, technological advancements, and regulatory pressures, while taking a decisive step toward fortifying their market presence to meet to meet this growing demand.

Climate Change Calls for Stripped Surfactant Efficiency

Shift: With global climate change causing erratic precipitation patterns, temperature extremes and increased pest pressure affecting agriculture productivity around the world, the requirement of surface-active compounds, more commonly known as surfactants, which can help with the delivery of agrochemicals in the harshest of environments is on the rise. Plants which were grown in stress conditions very often require a better distribution of nutrients and pesticides.

Strategic Response: BASF; Dow Chemical investing in climate-resilient surfactant technologies Example: the ability to develop products that withstand several pH ranges and variable temperatures. They are also focusing on reducing runoff and volatilization losses so that the inputs remain useful in drought and extreme rainfall events.

Deployment-to-Surfactant Optimization with Digital Ag

Shift: Digital Agriculture: Farmers are quickly adopting new digital agriculture technologies such as satellite mapping tools along with AI & IoT sensors to make data-led decisions on when to apply agrochemicals and surfactants. That has pushed the focus away from quick applications to much targeted applications that need surfactant solutions that will work with them.

Strategic Response: Agricultural surfactants are being pursued by key manufacturers in partnership with agri-tech players to ensure that their products are compatible with precision apparatuses and also to co-develop algorithms that recommend the best dosage of surfactant. For example, FMC and Corteva are developing platforms that link surfactant performance metrics back into the grower decision loop, empowering growers to dynamically calibrate their input levels based on field-specific real-time data.

Country-wise Insights

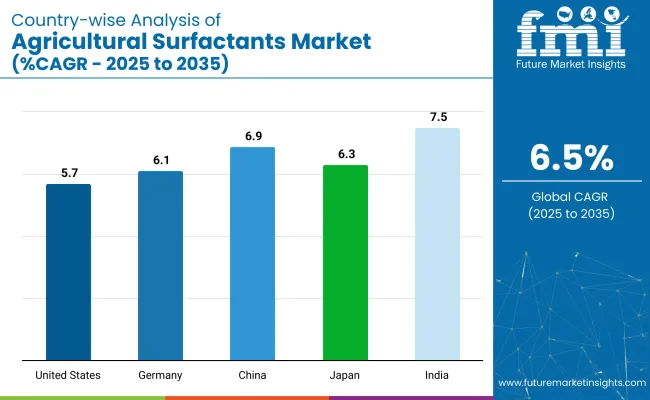
The following table shows the estimated growth rates of the top five territories. These are set to exhibit high consumption through 2035.

Countries CAGR, 2025 to 2035
USA 5.7%
Germany 6.1%
China 6.9%
Japan 6.3%
India 7.5%

Growth of USA honey industry lulled by sustainable farming, herbicide efficiency

The increasing use of sustainable agricultural practices and to sustain the most benefit from a pesticide are some of the major aspects expected to soar the demand for agricultural surfactants in USA Extensive application of herbicides, fungicides and insecticides over wide scale crops necessitates use of effective surfactant to enhance wetting, spreading and penetration of the active ingredients.

Adjuvants that mitigate runoff and adverse environmental effects are becoming widespread on crop farms, particularly in no-till and precision systems. With rising regulatory support for biobased & non-ionic surfactant, the market scope is expanding. Also, inclusion of surfactants in tank-mix adjuvants and foliar fertilizers is driving adoption among various row crops and specialty crops.

Pre-treatment in Germany: Eco-Friendly Input Plant-on-Demand Needs and Crop Protection

Germany- has a vibrant agricultural surfactant market, being influenced by stringent environmental regulations and the adoption of integrated pest management systems. Interest is growing in eco-adjuvants developed by farmers and cooperatives, which comply with EU regulations on biodegradability and toxicity. Biopesticides and low-chemical formulations for crop protection are also becoming more widely used9 and require surfactants with properties that do not inhibit the action of beneficial organisms.

Germany’s powerful agrochemical industry is banking on customized, crop-specific surfactant blends for fruits, vegetables and oilseeds. There is also increasing demand for tank-mix surfactants for precision-spraying applications that enhance uniformity and minimize the active material that is wasted.

China Demand to be stimulated by Large-Scale Agricultural & Formulation Advances

Rapid mechanisation, intense agricultural methods, and government-promoted strategies to optimise crop production and resource usage are driving the demand for agricultural surfactants in China. Additives, particularly surfactants, enable large use of pesticides to secure better adhesion and absorption on leaves across the world, especially in the mass cultivation of rice and corn, but also of fruits.

Local manufacturers are devolving cost effective and bio degradable surfactants according to local climate and soil conditions. Smart agriculture is also taking root with the inclusion of surfactants with bio stimulants and controlled-release agrochemicals.

Market of Japan from Aging Farmer Demographic and Precision Farming Supports

The Need for Labour Saving Solutions and the Acceptance of Precision Farming Technologies by the Aging Farmer Population in Japan Aid the Growth of the Japan Agricultural Surfactants Market Due to land limitations, the efficiency of agricultural input (agrochemical) use should be maximized.

Surfactants that spread droplets, reduce surface tension and enhance pesticide´s bioavailability are in high demand. According to the regulatory needs of Japan, silicone-based and non-ionic type surfactants are increasingly accepted as they are low toxic and friendly to the surrounding environment. Moreover, a growing need for customized surfactant mixtures for high-value crops is expected within the greenhouse farming and specialty horticulture.

India’s Development through Crop Yield Optimization and Bio pesticide Adoption

The agricultural surfactants market in India is steadily growing due to the increase in agricultural yield in the country and the extensive adoption of agrochemicals across varying agro-climates. As bio pesticides and organic crop protection product penetrate the market, certain other agents are needed to ensure the efficacy of these products while becoming eco-friendly.

Surfactant demand is driven by government programs that support sustainable agriculture, the increasingly diverse portfolio of drip and foliar application systems. Domestic manufacturers are developing low-cost, multi-use surfactant blends targeting small-holder dairy, scale, fruit, and vegetable farmers.

Category-Wise Insights

Overview of Biological Agricultural Surfactants Market

Segment Value Share (2025)
Bio-based Surfactants (By Type) 35%

Environmental sustainability and sustainable agriculture have become integral components of today's agricultural landscape; hence, bio-based agricultural surfactants are witnessing increased demand. Given the world’s priorities to discard of the ramifications of petrochemical-derived agricultural practices, these surfactants provide an ecologically sustainable alternative to conventional petroleum-based materials by virtue of their construction from renewable resources.

This, in turn, is driving manufacturers to develop new bio-based formulations for pesticides and fertilizers that would increase their efficacy against pests, weeds, and diseases while decreasing environmental impact. It is also part of a broader trend the industry has been observing, in favor of green chemistry and sustainable agricultural inputs.

Adoption of precision farming techniques drives use of non-ionic surfactants

Segment Value Share (2025)
Non-Ionic Surfactants (By Product Type) 45%

The rising adoption of precision farming practices has contributed to the steady growth of the non-ionic surfactant market for agrochemical applications. Non-ionic surfactants are preferred because they can increase the spreading and wetting characteristics of agrochemicals, rendering them more effective and minimizing wastage. So, this efficiency is extremely critical in precision agriculture where the application of inputs like fertilizers and pesticides is significant.

Hence, manufacturers are focused on the introduction of innovative non-ionic surfactants to serve the 21st century, technology-based farming, with a particular emphasis on high-performing surfactant systems that will work with a broad spectrum of pesticides and herbicides.

Competition Outlook

The agricultural surfactants market is observing a healthy growth due to the increasing adoption of precision farming practices, growing concern for crop protection, and the growing agriculture sector. This sector is coming alive with product development, partnerships, and sustainability. These players are expanding their competitive positions by offering a range of high-performance surfactants for several agricultural applications. ​

For instance:

  • Clariant introduced its Vita portfolio of 100% bio-based surfactants and polyethylene glycols, which provides manufacturers new tools to optimize bio-based carbon content within their crop formulations. ​
  • Fluorinated herbicide opinion CHS Inc. Last-Chance Pro was improved herbicide uptake, translocation and efficacy, one of several products from the firm to focus on agronochemical efficacy. ​
  • These innovations addressed market demand for novel and more efficient pesticide delivery systems, and DowDuPont has also further invested in research and development in order to develop their surfactant formulations to enhance pesticide applicator efficiency and meet the industry's shift towards more environmentally sustainable solutions.

Leading Brands

  • BASF SE
  • Dow Inc.
  • Croda International Plc
  • Akzo Nobel N.V.
  • Evonik Industries AG
  • Nouryon
  • Huntsman Corporation
  • Clariant AG
  • Solvay S.A.
  • Helena Agri-Enterprises, LLC
  • Stepan Company
  • Wilbur-Ellis Company
  • Lamberti S.p.A.

Top Segments Studied in the Agricultural Surfactants Market

By Type:

It includes Non-ionic, Anionic, Cationic and Amphoteric

By Application:

It includes Herbicides, Insecticides, Fungicides & Others

By Substrate:

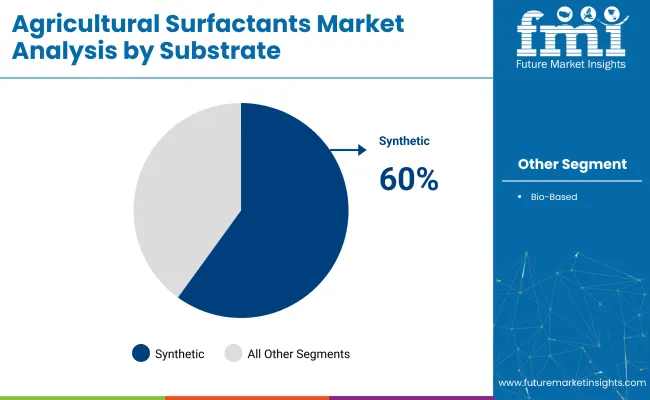
Sub segmented as Synthetic & Bio-based

By Crop Type:

Sub segmented in to Cereals & Grains, Oilseeds & Pulses, Fruits & Vegetables, and Others

By Region:

Analysed by North America, Latin America, Western Europe, Eastern Europe, Asia Pacific (APAC), Middle East & Africa (MEA) and Japan

Table of Content

  1. Executive Summary
  2. Industry Introduction, including Taxonomy and Market Definition
  3. Trends and Success Factors, including Macro-economic Factors, Market Dynamics, and Recent Industry Developments
  4. Global Market Demand Analysis 2020 to 2024 and Forecast 2025 to 2035, including Historical Analysis and Future Projections
  5. Pricing Analysis
  6. Global Market Analysis 2020 to 2024 and Forecast 2025 to 2035
    • Type
    • Application
    • Substrate
    • Crop Type
  7. Global Market Analysis 2020 to 2024 and Forecast 2025 to 2035, By Type
    • Non-ionic
    • Anionic
    • Cationic
    • Amphoteric
  8. Global Market Analysis 2020 to 2024 and Forecast 2025 to 2035, By Application
    • Herbicides
    • Insecticides
    • Fungicides
    • Others
  9. Global Market Analysis 2020 to 2024 and Forecast 2025 to 2035, By Substrate
    • Synthetic
    • Bio-based
  10. Global Market Analysis 2020 to 2024 and Forecast 2025 to 2035, By Crop Type
    • Cereals & Grains
    • Oilseeds & Pulses
    • Fruits & Vegetables
    • Others
  11. Global Market Analysis 2020 to 2024 and Forecast 2025 to 2035, By Region
    • North America
    • Latin America
    • Western Europe
    • Eastern Europe
    • East Asia
    • South Asia & Pacific
    • Central Asia
    • Russia and Belarus
    • Balkan & Baltic Countries
    • Middle East and Africa
  12. North America Sales Analysis 2020 to 2024 and Forecast 2025 to 2035, by Key Segments and Countries
  13. Latin America Sales Analysis 2020 to 2024 and Forecast 2025 to 2035, by Key Segments and Countries
  14. Western Europe Sales Analysis 2020 to 2024 and Forecast 2025 to 2035, by Key Segments and Countries
  15. Eastern Europe Sales Analysis 2020 to 2024 and Forecast 2025 to 2035, by Key Segments and Countries
  16. East Asia Sales Analysis 2020 to 2024 and Forecast 2025 to 2035, by Key Segments and Countries
  17. South Asia & Pacific Sales Analysis 2020 to 2024 and Forecast 2025 to 2035, by Key Segments and Countries
  18. Central Asia Sales Analysis 2020 to 2024 and Forecast 2025 to 2035, by Key Segments and Countries
  19. Russia and Belarus Sales Analysis 2020 to 2024 and Forecast 2025 to 2035, by Key Segments and Countries
  20. Balkan & Baltic Countries Sales Analysis 2020 to 2024 and Forecast 2025 to 2035, by Key Segments and Countries
  21. Middle East and Africa Sales Analysis 2020 to 2024 and Forecast 2025 to 2035, by Key Segments and Countries
  22. Sales Forecast to 2035 by Type, Application, Substrate, and Crop Type for 30 Countries
  23. Competitive Assessment, Company Share Analysis by Key Players, and Competition Dashboard
  24. Company Profile
    • BASF SE
    • Dow Inc.
    • Croda International Plc
    • Akzo Nobel N.V.
    • Evonik Industries AG
    • Nouryon
    • Huntsman Corporation
    • Clariant AG
    • Solvay S.A.
    • Helena Agri-Enterprises, LLC

List of Tables

Table 1: Global Market Value (US$ Million) Forecast by Region, 2019 to 2034

Table 2: Global Market Volume (Litre) Forecast by Region, 2019 to 2034

Table 3: Global Market Value (US$ Million) Forecast by Type, 2019 to 2034

Table 4: Global Market Volume (Litre) Forecast by Type, 2019 to 2034

Table 5: Global Market Value (US$ Million) Forecast by Application, 2019 to 2034

Table 6: Global Market Volume (Litre) Forecast by Application, 2019 to 2034

Table 7: Global Market Value (US$ Million) Forecast by Substrate, 2019 to 2034

Table 8: Global Market Volume (Litre) Forecast by Substrate, 2019 to 2034

Table 9: Global Market Value (US$ Million) Forecast by Crop, 2019 to 2034

Table 10: Global Market Volume (Litre) Forecast by Crop, 2019 to 2034

Table 11: North America Market Value (US$ Million) Forecast by Country, 2019 to 2034

Table 12: North America Market Volume (Litre) Forecast by Country, 2019 to 2034

Table 13: North America Market Value (US$ Million) Forecast by Type, 2019 to 2034

Table 14: North America Market Volume (Litre) Forecast by Type, 2019 to 2034

Table 15: North America Market Value (US$ Million) Forecast by Application, 2019 to 2034

Table 16: North America Market Volume (Litre) Forecast by Application, 2019 to 2034

Table 17: North America Market Value (US$ Million) Forecast by Substrate, 2019 to 2034

Table 18: North America Market Volume (Litre) Forecast by Substrate, 2019 to 2034

Table 19: North America Market Value (US$ Million) Forecast by Crop, 2019 to 2034

Table 20: North America Market Volume (Litre) Forecast by Crop, 2019 to 2034

Table 21: Latin America Market Value (US$ Million) Forecast by Country, 2019 to 2034

Table 22: Latin America Market Volume (Litre) Forecast by Country, 2019 to 2034

Table 23: Latin America Market Value (US$ Million) Forecast by Type, 2019 to 2034

Table 24: Latin America Market Volume (Litre) Forecast by Type, 2019 to 2034

Table 25: Latin America Market Value (US$ Million) Forecast by Application, 2019 to 2034

Table 26: Latin America Market Volume (Litre) Forecast by Application, 2019 to 2034

Table 27: Latin America Market Value (US$ Million) Forecast by Substrate, 2019 to 2034

Table 28: Latin America Market Volume (Litre) Forecast by Substrate, 2019 to 2034

Table 29: Latin America Market Value (US$ Million) Forecast by Crop, 2019 to 2034

Table 30: Latin America Market Volume (Litre) Forecast by Crop, 2019 to 2034

Table 31: Western Europe Market Value (US$ Million) Forecast by Country, 2019 to 2034

Table 32: Western Europe Market Volume (Litre) Forecast by Country, 2019 to 2034

Table 33: Western Europe Market Value (US$ Million) Forecast by Type, 2019 to 2034

Table 34: Western Europe Market Volume (Litre) Forecast by Type, 2019 to 2034

Table 35: Western Europe Market Value (US$ Million) Forecast by Application, 2019 to 2034

Table 36: Western Europe Market Volume (Litre) Forecast by Application, 2019 to 2034

Table 37: Western Europe Market Value (US$ Million) Forecast by Substrate, 2019 to 2034

Table 38: Western Europe Market Volume (Litre) Forecast by Substrate, 2019 to 2034

Table 39: Western Europe Market Value (US$ Million) Forecast by Crop, 2019 to 2034

Table 40: Western Europe Market Volume (Litre) Forecast by Crop, 2019 to 2034

Table 41: Eastern Europe Market Value (US$ Million) Forecast by Country, 2019 to 2034

Table 42: Eastern Europe Market Volume (Litre) Forecast by Country, 2019 to 2034

Table 43: Eastern Europe Market Value (US$ Million) Forecast by Type, 2019 to 2034

Table 44: Eastern Europe Market Volume (Litre) Forecast by Type, 2019 to 2034

Table 45: Eastern Europe Market Value (US$ Million) Forecast by Application, 2019 to 2034

Table 46: Eastern Europe Market Volume (Litre) Forecast by Application, 2019 to 2034

Table 47: Eastern Europe Market Value (US$ Million) Forecast by Substrate, 2019 to 2034

Table 48: Eastern Europe Market Volume (Litre) Forecast by Substrate, 2019 to 2034

Table 49: Eastern Europe Market Value (US$ Million) Forecast by Crop, 2019 to 2034

Table 50: Eastern Europe Market Volume (Litre) Forecast by Crop, 2019 to 2034

Table 51: South Asia and Pacific Market Value (US$ Million) Forecast by Country, 2019 to 2034

Table 52: South Asia and Pacific Market Volume (Litre) Forecast by Country, 2019 to 2034

Table 53: South Asia and Pacific Market Value (US$ Million) Forecast by Type, 2019 to 2034

Table 54: South Asia and Pacific Market Volume (Litre) Forecast by Type, 2019 to 2034

Table 55: South Asia and Pacific Market Value (US$ Million) Forecast by Application, 2019 to 2034

Table 56: South Asia and Pacific Market Volume (Litre) Forecast by Application, 2019 to 2034

Table 57: South Asia and Pacific Market Value (US$ Million) Forecast by Substrate, 2019 to 2034

Table 58: South Asia and Pacific Market Volume (Litre) Forecast by Substrate, 2019 to 2034

Table 59: South Asia and Pacific Market Value (US$ Million) Forecast by Crop, 2019 to 2034

Table 60: South Asia and Pacific Market Volume (Litre) Forecast by Crop, 2019 to 2034

Table 61: East Asia Market Value (US$ Million) Forecast by Country, 2019 to 2034

Table 62: East Asia Market Volume (Litre) Forecast by Country, 2019 to 2034

Table 63: East Asia Market Value (US$ Million) Forecast by Type, 2019 to 2034

Table 64: East Asia Market Volume (Litre) Forecast by Type, 2019 to 2034

Table 65: East Asia Market Value (US$ Million) Forecast by Application, 2019 to 2034

Table 66: East Asia Market Volume (Litre) Forecast by Application, 2019 to 2034

Table 67: East Asia Market Value (US$ Million) Forecast by Substrate, 2019 to 2034

Table 68: East Asia Market Volume (Litre) Forecast by Substrate, 2019 to 2034

Table 69: East Asia Market Value (US$ Million) Forecast by Crop, 2019 to 2034

Table 70: East Asia Market Volume (Litre) Forecast by Crop, 2019 to 2034

Table 71: Middle East and Africa Market Value (US$ Million) Forecast by Country, 2019 to 2034

Table 72: Middle East and Africa Market Volume (Litre) Forecast by Country, 2019 to 2034

Table 73: Middle East and Africa Market Value (US$ Million) Forecast by Type, 2019 to 2034

Table 74: Middle East and Africa Market Volume (Litre) Forecast by Type, 2019 to 2034

Table 75: Middle East and Africa Market Value (US$ Million) Forecast by Application, 2019 to 2034

Table 76: Middle East and Africa Market Volume (Litre) Forecast by Application, 2019 to 2034

Table 77: Middle East and Africa Market Value (US$ Million) Forecast by Substrate, 2019 to 2034

Table 78: Middle East and Africa Market Volume (Litre) Forecast by Substrate, 2019 to 2034

Table 79: Middle East and Africa Market Value (US$ Million) Forecast by Crop, 2019 to 2034

Table 80: Middle East and Africa Market Volume (Litre) Forecast by Crop, 2019 to 2034

List of Figures

Figure 1: Global Market Value (US$ Million) by Type, 2024 to 2034

Figure 2: Global Market Value (US$ Million) by Application, 2024 to 2034

Figure 3: Global Market Value (US$ Million) by Substrate, 2024 to 2034

Figure 4: Global Market Value (US$ Million) by Crop, 2024 to 2034

Figure 5: Global Market Value (US$ Million) by Region, 2024 to 2034

Figure 6: Global Market Value (US$ Million) Analysis by Region, 2019 to 2034

Figure 7: Global Market Volume (Litre) Analysis by Region, 2019 to 2034

Figure 8: Global Market Value Share (%) and BPS Analysis by Region, 2024 to 2034

Figure 9: Global Market Y-o-Y Growth (%) Projections by Region, 2024 to 2034

Figure 10: Global Market Value (US$ Million) Analysis by Type, 2019 to 2034

Figure 11: Global Market Volume (Litre) Analysis by Type, 2019 to 2034

Figure 12: Global Market Value Share (%) and BPS Analysis by Type, 2024 to 2034

Figure 13: Global Market Y-o-Y Growth (%) Projections by Type, 2024 to 2034

Figure 14: Global Market Value (US$ Million) Analysis by Application, 2019 to 2034

Figure 15: Global Market Volume (Litre) Analysis by Application, 2019 to 2034

Figure 16: Global Market Value Share (%) and BPS Analysis by Application, 2024 to 2034

Figure 17: Global Market Y-o-Y Growth (%) Projections by Application, 2024 to 2034

Figure 18: Global Market Value (US$ Million) Analysis by Substrate, 2019 to 2034

Figure 19: Global Market Volume (Litre) Analysis by Substrate, 2019 to 2034

Figure 20: Global Market Value Share (%) and BPS Analysis by Substrate, 2024 to 2034

Figure 21: Global Market Y-o-Y Growth (%) Projections by Substrate, 2024 to 2034

Figure 22: Global Market Value (US$ Million) Analysis by Crop, 2019 to 2034

Figure 23: Global Market Volume (Litre) Analysis by Crop, 2019 to 2034

Figure 24: Global Market Value Share (%) and BPS Analysis by Crop, 2024 to 2034

Figure 25: Global Market Y-o-Y Growth (%) Projections by Crop, 2024 to 2034

Figure 26: Global Market Attractiveness by Type, 2024 to 2034

Figure 27: Global Market Attractiveness by Application, 2024 to 2034

Figure 28: Global Market Attractiveness by Substrate, 2024 to 2034

Figure 29: Global Market Attractiveness by Crop, 2024 to 2034

Figure 30: Global Market Attractiveness by Region, 2024 to 2034

Figure 31: North America Market Value (US$ Million) by Type, 2024 to 2034

Figure 32: North America Market Value (US$ Million) by Application, 2024 to 2034

Figure 33: North America Market Value (US$ Million) by Substrate, 2024 to 2034

Figure 34: North America Market Value (US$ Million) by Crop, 2024 to 2034

Figure 35: North America Market Value (US$ Million) by Country, 2024 to 2034

Figure 36: North America Market Value (US$ Million) Analysis by Country, 2019 to 2034

Figure 37: North America Market Volume (Litre) Analysis by Country, 2019 to 2034

Figure 38: North America Market Value Share (%) and BPS Analysis by Country, 2024 to 2034

Figure 39: North America Market Y-o-Y Growth (%) Projections by Country, 2024 to 2034

Figure 40: North America Market Value (US$ Million) Analysis by Type, 2019 to 2034

Figure 41: North America Market Volume (Litre) Analysis by Type, 2019 to 2034

Figure 42: North America Market Value Share (%) and BPS Analysis by Type, 2024 to 2034

Figure 43: North America Market Y-o-Y Growth (%) Projections by Type, 2024 to 2034

Figure 44: North America Market Value (US$ Million) Analysis by Application, 2019 to 2034

Figure 45: North America Market Volume (Litre) Analysis by Application, 2019 to 2034

Figure 46: North America Market Value Share (%) and BPS Analysis by Application, 2024 to 2034

Figure 47: North America Market Y-o-Y Growth (%) Projections by Application, 2024 to 2034

Figure 48: North America Market Value (US$ Million) Analysis by Substrate, 2019 to 2034

Figure 49: North America Market Volume (Litre) Analysis by Substrate, 2019 to 2034

Figure 50: North America Market Value Share (%) and BPS Analysis by Substrate, 2024 to 2034

Figure 51: North America Market Y-o-Y Growth (%) Projections by Substrate, 2024 to 2034

Figure 52: North America Market Value (US$ Million) Analysis by Crop, 2019 to 2034

Figure 53: North America Market Volume (Litre) Analysis by Crop, 2019 to 2034

Figure 54: North America Market Value Share (%) and BPS Analysis by Crop, 2024 to 2034

Figure 55: North America Market Y-o-Y Growth (%) Projections by Crop, 2024 to 2034

Figure 56: North America Market Attractiveness by Type, 2024 to 2034

Figure 57: North America Market Attractiveness by Application, 2024 to 2034

Figure 58: North America Market Attractiveness by Substrate, 2024 to 2034

Figure 59: North America Market Attractiveness by Crop, 2024 to 2034

Figure 60: North America Market Attractiveness by Country, 2024 to 2034

Figure 61: Latin America Market Value (US$ Million) by Type, 2024 to 2034

Figure 62: Latin America Market Value (US$ Million) by Application, 2024 to 2034

Figure 63: Latin America Market Value (US$ Million) by Substrate, 2024 to 2034

Figure 64: Latin America Market Value (US$ Million) by Crop, 2024 to 2034

Figure 65: Latin America Market Value (US$ Million) by Country, 2024 to 2034

Figure 66: Latin America Market Value (US$ Million) Analysis by Country, 2019 to 2034

Figure 67: Latin America Market Volume (Litre) Analysis by Country, 2019 to 2034

Figure 68: Latin America Market Value Share (%) and BPS Analysis by Country, 2024 to 2034

Figure 69: Latin America Market Y-o-Y Growth (%) Projections by Country, 2024 to 2034

Figure 70: Latin America Market Value (US$ Million) Analysis by Type, 2019 to 2034

Figure 71: Latin America Market Volume (Litre) Analysis by Type, 2019 to 2034

Figure 72: Latin America Market Value Share (%) and BPS Analysis by Type, 2024 to 2034

Figure 73: Latin America Market Y-o-Y Growth (%) Projections by Type, 2024 to 2034

Figure 74: Latin America Market Value (US$ Million) Analysis by Application, 2019 to 2034

Figure 75: Latin America Market Volume (Litre) Analysis by Application, 2019 to 2034

Figure 76: Latin America Market Value Share (%) and BPS Analysis by Application, 2024 to 2034

Figure 77: Latin America Market Y-o-Y Growth (%) Projections by Application, 2024 to 2034

Figure 78: Latin America Market Value (US$ Million) Analysis by Substrate, 2019 to 2034

Figure 79: Latin America Market Volume (Litre) Analysis by Substrate, 2019 to 2034

Figure 80: Latin America Market Value Share (%) and BPS Analysis by Substrate, 2024 to 2034

Figure 81: Latin America Market Y-o-Y Growth (%) Projections by Substrate, 2024 to 2034

Figure 82: Latin America Market Value (US$ Million) Analysis by Crop, 2019 to 2034

Figure 83: Latin America Market Volume (Litre) Analysis by Crop, 2019 to 2034

Figure 84: Latin America Market Value Share (%) and BPS Analysis by Crop, 2024 to 2034

Figure 85: Latin America Market Y-o-Y Growth (%) Projections by Crop, 2024 to 2034

Figure 86: Latin America Market Attractiveness by Type, 2024 to 2034

Figure 87: Latin America Market Attractiveness by Application, 2024 to 2034

Figure 88: Latin America Market Attractiveness by Substrate, 2024 to 2034

Figure 89: Latin America Market Attractiveness by Crop, 2024 to 2034

Figure 90: Latin America Market Attractiveness by Country, 2024 to 2034

Figure 91: Western Europe Market Value (US$ Million) by Type, 2024 to 2034

Figure 92: Western Europe Market Value (US$ Million) by Application, 2024 to 2034

Figure 93: Western Europe Market Value (US$ Million) by Substrate, 2024 to 2034

Figure 94: Western Europe Market Value (US$ Million) by Crop, 2024 to 2034

Figure 95: Western Europe Market Value (US$ Million) by Country, 2024 to 2034

Figure 96: Western Europe Market Value (US$ Million) Analysis by Country, 2019 to 2034

Figure 97: Western Europe Market Volume (Litre) Analysis by Country, 2019 to 2034

Figure 98: Western Europe Market Value Share (%) and BPS Analysis by Country, 2024 to 2034

Figure 99: Western Europe Market Y-o-Y Growth (%) Projections by Country, 2024 to 2034

Figure 100: Western Europe Market Value (US$ Million) Analysis by Type, 2019 to 2034

Figure 101: Western Europe Market Volume (Litre) Analysis by Type, 2019 to 2034

Figure 102: Western Europe Market Value Share (%) and BPS Analysis by Type, 2024 to 2034

Figure 103: Western Europe Market Y-o-Y Growth (%) Projections by Type, 2024 to 2034

Figure 104: Western Europe Market Value (US$ Million) Analysis by Application, 2019 to 2034

Figure 105: Western Europe Market Volume (Litre) Analysis by Application, 2019 to 2034

Figure 106: Western Europe Market Value Share (%) and BPS Analysis by Application, 2024 to 2034

Figure 107: Western Europe Market Y-o-Y Growth (%) Projections by Application, 2024 to 2034

Figure 108: Western Europe Market Value (US$ Million) Analysis by Substrate, 2019 to 2034

Figure 109: Western Europe Market Volume (Litre) Analysis by Substrate, 2019 to 2034

Figure 110: Western Europe Market Value Share (%) and BPS Analysis by Substrate, 2024 to 2034

Figure 111: Western Europe Market Y-o-Y Growth (%) Projections by Substrate, 2024 to 2034

Figure 112: Western Europe Market Value (US$ Million) Analysis by Crop, 2019 to 2034

Figure 113: Western Europe Market Volume (Litre) Analysis by Crop, 2019 to 2034

Figure 114: Western Europe Market Value Share (%) and BPS Analysis by Crop, 2024 to 2034

Figure 115: Western Europe Market Y-o-Y Growth (%) Projections by Crop, 2024 to 2034

Figure 116: Western Europe Market Attractiveness by Type, 2024 to 2034

Figure 117: Western Europe Market Attractiveness by Application, 2024 to 2034

Figure 118: Western Europe Market Attractiveness by Substrate, 2024 to 2034

Figure 119: Western Europe Market Attractiveness by Crop, 2024 to 2034

Figure 120: Western Europe Market Attractiveness by Country, 2024 to 2034

Figure 121: Eastern Europe Market Value (US$ Million) by Type, 2024 to 2034

Figure 122: Eastern Europe Market Value (US$ Million) by Application, 2024 to 2034

Figure 123: Eastern Europe Market Value (US$ Million) by Substrate, 2024 to 2034

Figure 124: Eastern Europe Market Value (US$ Million) by Crop, 2024 to 2034

Figure 125: Eastern Europe Market Value (US$ Million) by Country, 2024 to 2034

Figure 126: Eastern Europe Market Value (US$ Million) Analysis by Country, 2019 to 2034

Figure 127: Eastern Europe Market Volume (Litre) Analysis by Country, 2019 to 2034

Figure 128: Eastern Europe Market Value Share (%) and BPS Analysis by Country, 2024 to 2034

Figure 129: Eastern Europe Market Y-o-Y Growth (%) Projections by Country, 2024 to 2034

Figure 130: Eastern Europe Market Value (US$ Million) Analysis by Type, 2019 to 2034

Figure 131: Eastern Europe Market Volume (Litre) Analysis by Type, 2019 to 2034

Figure 132: Eastern Europe Market Value Share (%) and BPS Analysis by Type, 2024 to 2034

Figure 133: Eastern Europe Market Y-o-Y Growth (%) Projections by Type, 2024 to 2034

Figure 134: Eastern Europe Market Value (US$ Million) Analysis by Application, 2019 to 2034

Figure 135: Eastern Europe Market Volume (Litre) Analysis by Application, 2019 to 2034

Figure 136: Eastern Europe Market Value Share (%) and BPS Analysis by Application, 2024 to 2034

Figure 137: Eastern Europe Market Y-o-Y Growth (%) Projections by Application, 2024 to 2034

Figure 138: Eastern Europe Market Value (US$ Million) Analysis by Substrate, 2019 to 2034

Figure 139: Eastern Europe Market Volume (Litre) Analysis by Substrate, 2019 to 2034

Figure 140: Eastern Europe Market Value Share (%) and BPS Analysis by Substrate, 2024 to 2034

Figure 141: Eastern Europe Market Y-o-Y Growth (%) Projections by Substrate, 2024 to 2034

Figure 142: Eastern Europe Market Value (US$ Million) Analysis by Crop, 2019 to 2034

Figure 143: Eastern Europe Market Volume (Litre) Analysis by Crop, 2019 to 2034

Figure 144: Eastern Europe Market Value Share (%) and BPS Analysis by Crop, 2024 to 2034

Figure 145: Eastern Europe Market Y-o-Y Growth (%) Projections by Crop, 2024 to 2034

Figure 146: Eastern Europe Market Attractiveness by Type, 2024 to 2034

Figure 147: Eastern Europe Market Attractiveness by Application, 2024 to 2034

Figure 148: Eastern Europe Market Attractiveness by Substrate, 2024 to 2034

Figure 149: Eastern Europe Market Attractiveness by Crop, 2024 to 2034

Figure 150: Eastern Europe Market Attractiveness by Country, 2024 to 2034

Figure 151: South Asia and Pacific Market Value (US$ Million) by Type, 2024 to 2034

Figure 152: South Asia and Pacific Market Value (US$ Million) by Application, 2024 to 2034

Figure 153: South Asia and Pacific Market Value (US$ Million) by Substrate, 2024 to 2034

Figure 154: South Asia and Pacific Market Value (US$ Million) by Crop, 2024 to 2034

Figure 155: South Asia and Pacific Market Value (US$ Million) by Country, 2024 to 2034

Figure 156: South Asia and Pacific Market Value (US$ Million) Analysis by Country, 2019 to 2034

Figure 157: South Asia and Pacific Market Volume (Litre) Analysis by Country, 2019 to 2034

Figure 158: South Asia and Pacific Market Value Share (%) and BPS Analysis by Country, 2024 to 2034

Figure 159: South Asia and Pacific Market Y-o-Y Growth (%) Projections by Country, 2024 to 2034

Figure 160: South Asia and Pacific Market Value (US$ Million) Analysis by Type, 2019 to 2034

Figure 161: South Asia and Pacific Market Volume (Litre) Analysis by Type, 2019 to 2034

Figure 162: South Asia and Pacific Market Value Share (%) and BPS Analysis by Type, 2024 to 2034

Figure 163: South Asia and Pacific Market Y-o-Y Growth (%) Projections by Type, 2024 to 2034

Figure 164: South Asia and Pacific Market Value (US$ Million) Analysis by Application, 2019 to 2034

Figure 165: South Asia and Pacific Market Volume (Litre) Analysis by Application, 2019 to 2034

Figure 166: South Asia and Pacific Market Value Share (%) and BPS Analysis by Application, 2024 to 2034

Figure 167: South Asia and Pacific Market Y-o-Y Growth (%) Projections by Application, 2024 to 2034

Figure 168: South Asia and Pacific Market Value (US$ Million) Analysis by Substrate, 2019 to 2034

Figure 169: South Asia and Pacific Market Volume (Litre) Analysis by Substrate, 2019 to 2034

Figure 170: South Asia and Pacific Market Value Share (%) and BPS Analysis by Substrate, 2024 to 2034

Figure 171: South Asia and Pacific Market Y-o-Y Growth (%) Projections by Substrate, 2024 to 2034

Figure 172: South Asia and Pacific Market Value (US$ Million) Analysis by Crop, 2019 to 2034

Figure 173: South Asia and Pacific Market Volume (Litre) Analysis by Crop, 2019 to 2034

Figure 174: South Asia and Pacific Market Value Share (%) and BPS Analysis by Crop, 2024 to 2034

Figure 175: South Asia and Pacific Market Y-o-Y Growth (%) Projections by Crop, 2024 to 2034

Figure 176: South Asia and Pacific Market Attractiveness by Type, 2024 to 2034

Figure 177: South Asia and Pacific Market Attractiveness by Application, 2024 to 2034

Figure 178: South Asia and Pacific Market Attractiveness by Substrate, 2024 to 2034

Figure 179: South Asia and Pacific Market Attractiveness by Crop, 2024 to 2034

Figure 180: South Asia and Pacific Market Attractiveness by Country, 2024 to 2034

Figure 181: East Asia Market Value (US$ Million) by Type, 2024 to 2034

Figure 182: East Asia Market Value (US$ Million) by Application, 2024 to 2034

Figure 183: East Asia Market Value (US$ Million) by Substrate, 2024 to 2034

Figure 184: East Asia Market Value (US$ Million) by Crop, 2024 to 2034

Figure 185: East Asia Market Value (US$ Million) by Country, 2024 to 2034

Figure 186: East Asia Market Value (US$ Million) Analysis by Country, 2019 to 2034

Figure 187: East Asia Market Volume (Litre) Analysis by Country, 2019 to 2034

Figure 188: East Asia Market Value Share (%) and BPS Analysis by Country, 2024 to 2034

Figure 189: East Asia Market Y-o-Y Growth (%) Projections by Country, 2024 to 2034

Figure 190: East Asia Market Value (US$ Million) Analysis by Type, 2019 to 2034

Figure 191: East Asia Market Volume (Litre) Analysis by Type, 2019 to 2034

Figure 192: East Asia Market Value Share (%) and BPS Analysis by Type, 2024 to 2034

Figure 193: East Asia Market Y-o-Y Growth (%) Projections by Type, 2024 to 2034

Figure 194: East Asia Market Value (US$ Million) Analysis by Application, 2019 to 2034

Figure 195: East Asia Market Volume (Litre) Analysis by Application, 2019 to 2034

Figure 196: East Asia Market Value Share (%) and BPS Analysis by Application, 2024 to 2034

Figure 197: East Asia Market Y-o-Y Growth (%) Projections by Application, 2024 to 2034

Figure 198: East Asia Market Value (US$ Million) Analysis by Substrate, 2019 to 2034

Figure 199: East Asia Market Volume (Litre) Analysis by Substrate, 2019 to 2034

Figure 200: East Asia Market Value Share (%) and BPS Analysis by Substrate, 2024 to 2034

Figure 201: East Asia Market Y-o-Y Growth (%) Projections by Substrate, 2024 to 2034

Figure 202: East Asia Market Value (US$ Million) Analysis by Crop, 2019 to 2034

Figure 203: East Asia Market Volume (Litre) Analysis by Crop, 2019 to 2034

Figure 204: East Asia Market Value Share (%) and BPS Analysis by Crop, 2024 to 2034

Figure 205: East Asia Market Y-o-Y Growth (%) Projections by Crop, 2024 to 2034

Figure 206: East Asia Market Attractiveness by Type, 2024 to 2034

Figure 207: East Asia Market Attractiveness by Application, 2024 to 2034

Figure 208: East Asia Market Attractiveness by Substrate, 2024 to 2034

Figure 209: East Asia Market Attractiveness by Crop, 2024 to 2034

Figure 210: East Asia Market Attractiveness by Country, 2024 to 2034

Figure 211: Middle East and Africa Market Value (US$ Million) by Type, 2024 to 2034

Figure 212: Middle East and Africa Market Value (US$ Million) by Application, 2024 to 2034

Figure 213: Middle East and Africa Market Value (US$ Million) by Substrate, 2024 to 2034

Figure 214: Middle East and Africa Market Value (US$ Million) by Crop, 2024 to 2034

Figure 215: Middle East and Africa Market Value (US$ Million) by Country, 2024 to 2034

Figure 216: Middle East and Africa Market Value (US$ Million) Analysis by Country, 2019 to 2034

Figure 217: Middle East and Africa Market Volume (Litre) Analysis by Country, 2019 to 2034

Figure 218: Middle East and Africa Market Value Share (%) and BPS Analysis by Country, 2024 to 2034

Figure 219: Middle East and Africa Market Y-o-Y Growth (%) Projections by Country, 2024 to 2034

Figure 220: Middle East and Africa Market Value (US$ Million) Analysis by Type, 2019 to 2034

Figure 221: Middle East and Africa Market Volume (Litre) Analysis by Type, 2019 to 2034

Figure 222: Middle East and Africa Market Value Share (%) and BPS Analysis by Type, 2024 to 2034

Figure 223: Middle East and Africa Market Y-o-Y Growth (%) Projections by Type, 2024 to 2034

Figure 224: Middle East and Africa Market Value (US$ Million) Analysis by Application, 2019 to 2034

Figure 225: Middle East and Africa Market Volume (Litre) Analysis by Application, 2019 to 2034

Figure 226: Middle East and Africa Market Value Share (%) and BPS Analysis by Application, 2024 to 2034

Figure 227: Middle East and Africa Market Y-o-Y Growth (%) Projections by Application, 2024 to 2034

Figure 228: Middle East and Africa Market Value (US$ Million) Analysis by Substrate, 2019 to 2034

Figure 229: Middle East and Africa Market Volume (Litre) Analysis by Substrate, 2019 to 2034

Figure 230: Middle East and Africa Market Value Share (%) and BPS Analysis by Substrate, 2024 to 2034

Figure 231: Middle East and Africa Market Y-o-Y Growth (%) Projections by Substrate, 2024 to 2034

Figure 232: Middle East and Africa Market Value (US$ Million) Analysis by Crop, 2019 to 2034

Figure 233: Middle East and Africa Market Volume (Litre) Analysis by Crop, 2019 to 2034

Figure 234: Middle East and Africa Market Value Share (%) and BPS Analysis by Crop, 2024 to 2034

Figure 235: Middle East and Africa Market Y-o-Y Growth (%) Projections by Crop, 2024 to 2034

Figure 236: Middle East and Africa Market Attractiveness by Type, 2024 to 2034

Figure 237: Middle East and Africa Market Attractiveness by Application, 2024 to 2034

Figure 238: Middle East and Africa Market Attractiveness by Substrate, 2024 to 2034

Figure 239: Middle East and Africa Market Attractiveness by Crop, 2024 to 2034

Figure 240: Middle East and Africa Market Attractiveness by Country, 2024 to 2034

Frequently Asked Questions

What is the current value of the Agricultural Surfactant industry?

The global industry is estimated at a value of USD 1,907.9 million in 2025.

At what rate did the sales of Agricultural Surfactants grow between 2020 and 2024?

Sales increased at 5.8% CAGR between 2020 and 2024.

Who are the leading manufacturers of Agricultural Surfactants?

Some of the leaders in this industry include BASF SE, Dow Chemical Company, Clariant, Evonik Industries AG, Croda International Plc, Solvay, Nufarm Limited, Helena Agri-Enterprises LLC, Wilbur-Ellis Company LLC, and Stepan Company.

Which region will garner a significant value share by 2025?

The North American region is projected to hold a revenue share of 32.6% over the forecast period.

At what CAGR is the global forecast to grow from 2025 to 2035?

The industry is projected to grow at a forecast CAGR of 6.5% from 2025 to 2035.

Explore Similar Insights

Future Market Insights

Agricultural Surfactants Market