Aerospace Fastener Market Size, Share, and Forecast Outlook 2025 to 2035

The aerospace fastener market is valued at USD 9.85 billion in 2025 and is expected to reach approximately USD 19.3 billion by 2035, growing at a CAGR of 7%.
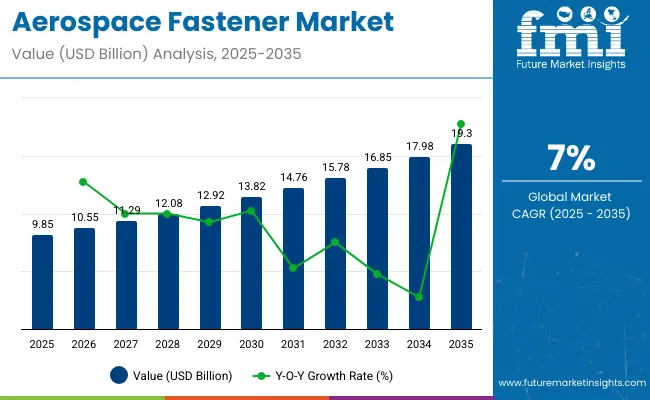
Quick Stats of Aerospace Fastener Market

  • Aerospace Fastener Market Size (2025): USD 9.85 billion
  • Projected Aerospace Fastener Market Size (2035): USD 19.3 billion
  • Forecast CAGR of Aerospace Fastener Market (2025 to 2035): 7%
  • Leading Product Type of Aerospace Fastener Market (2025): Bolts
  • Key Growth Regions of Aerospace Fastener Market: North America, Europe, Asia Pacific
  • Top Key Players of Aerospace Fastener Market: Alcoa Fastening Systems & Rings, 3V Fasteners Company Inc., Acumen Global Technologies

Aerospace Fasteners Market

Metric Value
Industry Size (2025E) USD 9.85 billion
Industry Value (2035F) USD 19.3 billion
CAGR (2025 to 2035) 7%

Analysis of seasonality and cyclicality reveals recurring patterns influenced by aircraft production cycles, maintenance schedules, and defense procurement timelines. Demand for fasteners tends to peak during periods of high commercial aircraft deliveries and major defense equipment rollouts, while slower intervals coincide with program delays, economic slowdowns, or periods of reduced airline expansion.

Cyclicality is also linked to technological transitions, such as the introduction of lightweight materials, corrosion-resistant alloys, or fasteners compatible with composite structures, which can temporarily boost demand as manufacturers adapt production lines. Maintenance, repair, and overhaul (MRO) cycles contribute additional predictable fluctuations, as older fleets undergo scheduled overhauls requiring replacement fasteners.

By 2035, as the market reaches 19.3 billion, these cyclical trends are expected to stabilize to some extent, supported by steady growth in aircraft manufacturing and global fleet expansion. Understanding these seasonal and cyclical patterns allows manufacturers, suppliers, and investors to optimize inventory management, production planning, and procurement strategies, ensuring alignment with periods of peak demand and minimizing exposure during slower intervals, while capturing long-term value from consistent aerospace activity.

The market is growing alongside increasing commercial aircraft deliveries, which reached over 2,600 units globally in 2024, driving demand for high-performance fasteners. Titanium fasteners accounted for nearly 35% of the market by value, reflecting their use in lightweight aircraft structures. The adoption of composite-compatible fasteners increased by 18% year-on-year, supporting the rise of carbon-fiber-reinforced airframes.

Automated machining and precision coating processes are being implemented in over 60% of manufacturing facilities, improving production consistency. MRO operations are increasingly utilizing predictive inventory systems, reducing downtime by an estimated 12-15% per fleet. Strategic collaborations between OEMs and fastener suppliers are expanding production capacity and aligning supply chains with projected 5-6% CAGR growth in aerospace manufacturing over the next five years.

The aerospace fasteners market is supported by multiple upstream sectors. Aircraft and spacecraft manufacturing represents approximately 41%, as fasteners are essential for structural assembly and component integration. Metal fabrication and precision machining contributes around 26%, supplying titanium, stainless steel, and specialty alloys. Avionics and systems integration accounts for close to 16%, where fasteners are critical for electronics and control modules. Maintenance, repair, and overhaul (MRO) services hold roughly 11%, ensuring replacement, retrofitting, and lifecycle management. Engineering design and certification services contribute the remaining 6%, providing testing, standardization, and compliance for aerospace applications.

Top Aerospace Fastener Market Dynamics

Fasteners include rivets, bolts, screws, nuts, and specialty locking devices used across airframes, engines, and interiors. Titanium, high-strength aluminum, and steel alloys dominate, with titanium representing roughly 30% of total fastener volume due to weight reduction advantages. Replacement cycles of 5-7 years sustain aftermarket demand. North America and Europe collectively account for more than 60% of global consumption, while Asia Pacific is the fastest-growing region, driven by rising aircraft production and fleet modernization programs.

Driving Force Aircraft Production and Weight Optimization

Rising aircraft production and demand for lightweight, fuel-efficient designs are key drivers of fastener adoption. Titanium and high-strength aluminum fasteners reduce airframe weight by 5-8%, improving fuel efficiency, while ensuring structural integrity and vibration resistance. Defense aircraft programs increasingly adopt advanced alloys and coated fasteners to withstand harsh environments. Retrofit and maintenance programs provide continuous replacement demand, particularly for engines, landing gear, and control surfaces. OEMs and MRO providers prioritize modular and standardized fasteners to reduce assembly time and improve maintenance efficiency.

  • Titanium fasteners account for roughly 30% of total fastener volume.
  • Retrofit programs sustain aftermarket demand every 5-7 years.
  • Modular and standardized fasteners reduce assembly and maintenance time.

Growth Opportunity Specialty and Coated Fasteners

Specialty fasteners with high fatigue strength and corrosion-resistant coatings are driving growth. Coated titanium fasteners are widely used in engines, while anodized aluminum fasteners dominate fuselage and interior assemblies. Emerging smart fasteners with embedded sensors or RFID tracking provide structural health monitoring capabilities, reducing maintenance downtime. Additive manufacturing allows complex geometries with improved strength-to-weight ratios and reduces part count in assemblies. Growth in hybrid-electric and eVTOL aircraft is also creating demand for lightweight, high-performance fasteners that meet stringent aerospace standards.

  • Coated titanium fasteners are increasingly used in engine assemblies.
  • Smart fasteners with sensors enable predictive maintenance.
  • Additive manufacturing reduces part count and improves strength-to-weight ratios.

Emerging Trend Lightweight and Smart Fasteners

Manufacturers are emphasizing lightweight materials and performance enhancements. Titanium and composite fasteners reduce airframe mass while maintaining durability. Smart fasteners with embedded monitoring systems allow real-time tracking of torque, stress, and fatigue life, enhancing safety and reducing maintenance intervals. Advanced manufacturing methods, including additive manufacturing, create complex fasteners with optimized geometries for weight and strength. Adoption of these technologies is higher in next-generation aircraft, supporting both operational efficiency and predictive maintenance programs.

  • Embedded sensors track torque, stress, and fatigue life in real time.
  • Composite fasteners reduce airframe mass without compromising strength.
  • Advanced manufacturing enables optimized geometries and lightweight designs.

Market Challenge Cost and Regulatory Requirements

Advanced aerospace fasteners carry high costs, ranging from USD 5 to over USD 500 per unit depending on material and function. Compliance with AS9100, SAE AMS, and EN9100 standards requires extensive testing and certification, adding 6-10 weeks to lead times. Supply chain limitations for titanium and specialty alloys create production constraints. Maintenance requires trained personnel and certified torque tools, increasing the total cost of ownership. Price volatility in raw materials further challenges adoption in cost-sensitive aircraft programs.

  • Unit cost ranges from USD 5 to over USD 500 depending on material and function.
  • Certification and testing extend lead times by 6-10 weeks.
  • Supply constraints for titanium and specialty alloys affect production schedules.

Analyzing Aerospace Fastener Market by Top Investment Segments

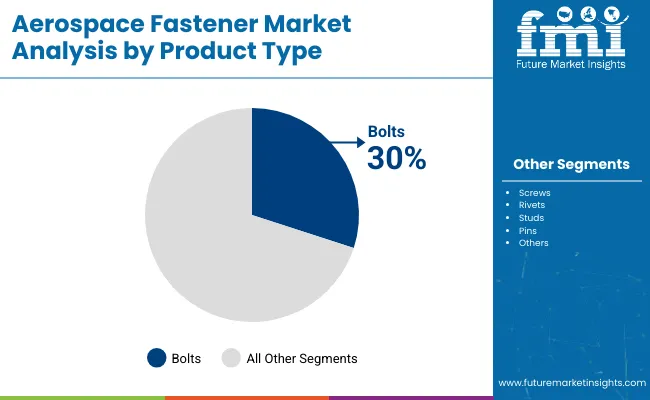
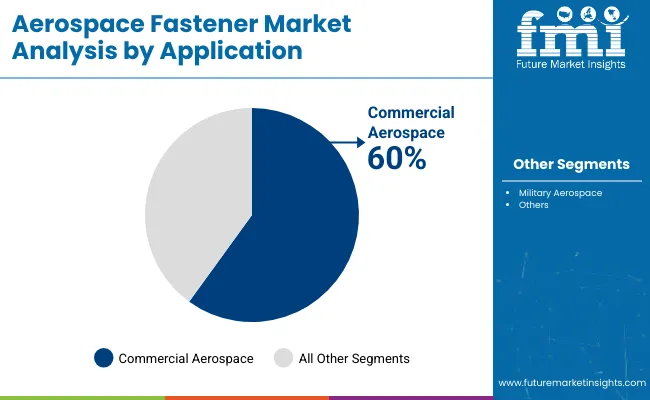
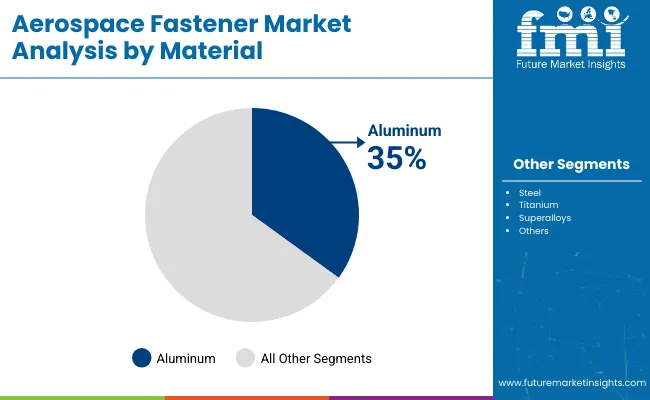
The aerospace fastener market in 2025 is driven by precise engineering requirements across commercial and military aerospace. Bolts, screws, and rivets dominate product demand, contributing 30%, 25%, and 20% respectively. Commercial aerospace accounts for 60% of applications, while military aerospace represents 40%. Aluminum fasteners lead materials at 35%, followed by steel at 30% and titanium at 20%. Key OEMs such as Airbus, Boeing, and Embraer source fasteners from suppliers including Alcoa Fastening Systems, ARaymond, and Stanley Engineered Fastening. Demand is driven by aircraft production, maintenance programs, and the need for lightweight, corrosion-resistant components. Fasteners remain essential for structural integrity, avionics, cabin interiors, and load-bearing assemblies.
Bolts, Screws, And Rivets Lead Product Demand in 2025

Aerospace Fasteners Market By Product

Bolts capture the largest share at 30%, followed by screws at 25% and rivets at 20%. Bolts are widely used in fuselage (45%), wing structures (30%), and landing gear assemblies (25%). Screws serve avionics panels (40%), cabin interiors (35%), and control surfaces (25%). Rivets are preferred for fuselage panels (50%), wing skins (30%), and tail assemblies (20%). OEMs including Boeing, Airbus, and Lockheed Martin source these fasteners from Alcoa Fastening Systems, ARaymond, and Stanley Engineered Fastening. Titanium bolts and screws account for 25-30% of total demand, steel 30-35%, and aluminum 40-45%. High precision, corrosion resistance, and fatigue strength are critical for structural and avionics applications.
  • ARaymond supplies 40% of Airbus fuselage bolts
  • Alcoa Fastening Systems provides 35% of Boeing wing screws
  • Stanley Engineered Fastening delivers 30% of rivets for military aircraft

Commercial and Military Aerospace Dominate Application Segments

Aerospace Fasteners Market By Application

Commercial aerospace dominates the market with 60% share, driven by fleet expansion and aircraft maintenance requirements. Military aerospace contributes 40%, focusing on fighter jets, transport aircraft, and specialized platforms. Bolts account for 35% of commercial aerospace fasteners, rivets 25%, and screws 20%. In military applications, titanium fasteners are preferred (30%) for high-strength and corrosion-resistant properties. OEMs such as Boeing, Airbus, Embraer, and Lockheed Martin rely on suppliers including ARaymond, Alcoa Fastening Systems, and PennEngineering to meet precise load-bearing and avionics requirements. Both sectors prioritize fatigue resistance, reliability, and material optimization for efficient assembly and long-term performance.
  • Boeing sources 40% of commercial aerospace fasteners from Alcoa Fastening Systems
  • Lockheed Martin relies on ARaymond for 30% of military-grade fasteners
  • Embraer integrates 30% of fasteners from PennEngineering for commercial jets

Aluminum, Steel, And Titanium Drive Material Segment in 2025

Aerospace Fasteners Market By Material

Aluminum leads material demand at 35%, followed by steel at 30% and titanium at 20%. Aluminum is primarily used in fuselage assemblies (45%), wing structures (30%), and cabin interiors (25%) due to its lightweight and corrosion-resistant properties. Steel is employed in landing gear (40%), high-load structural joints (35%), and engine mount assemblies (25%). Titanium is preferred for military aerospace components (50%), control surfaces (30%), and avionics panels (20%). Suppliers such as Alcoa Fastening Systems, ARaymond, and PennEngineering provide aerospace-grade fasteners meeting fatigue, tensile, and certification standards. Material selection directly impacts weight reduction, fuel efficiency, and durability across commercial and defense aircraft.
  • Alcoa Fastening Systems delivers 45% of Airbus aluminum fasteners
  • ARaymond supplies 35% of Boeing steel fasteners
  • PennEngineering provides 30% of titanium fasteners for military aircraft

Top Countries Expanding, Producing, and Supplying in the Aerospace Fastener Market

Aerospace Fasteners Market By Country

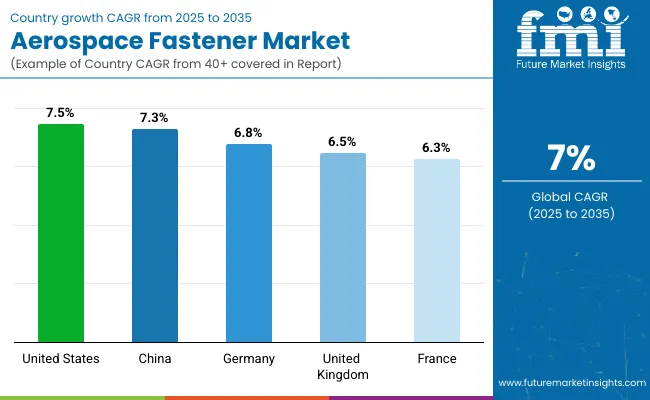
In 2025, the global aerospace fastener market is growing at a CAGR of 7.0% through 2035. The United States leads at 7.5%, +7% above the global average, driven by OECD-backed aerospace production, fleet upgrades, and demand for high-performance components. China follows at 7.3%, +4% higher than the global benchmark, supported by BRICS-focused expansion in commercial and defense aircraft manufacturing and strengthening domestic supply chains. Germany records 6.8%, −3% below the global rate, reflecting steady adoption in a mature aerospace sector. The United Kingdom posts 6.5% and France 6.3%, −7% and −10% under the global CAGR, shaped by incremental fleet modernization and niche aerospace manufacturing. Overall, BRICS countries like China are advancing production capacity, while OECD markets maintain growth through precision engineering, quality control, and regulatory adherence in aerospace fastener operations.

Growth Analysis of Aerospace Fastener Market in the United States

The aerospace fastener market in the United States is projected to grow at a CAGR of 7.5%, above the global 7.0%, yielding a multiplication factor of 1.07. This trend is viewed as a result of increasing demand for advanced airframe assembly and maintenance activities. Adoption of high-strength, corrosion-resistant fasteners is emphasized to meet the needs of commercial jets and defense aircraft. The market is influenced by retrofitting programs in aging fleets and the integration of lightweight alloys. It is believed that US manufacturers are investing in automation and precision tooling to improve production efficiency. By 2035, the installed base of advanced aerospace fasteners is expected to expand significantly, supporting both domestic and international aerospace programs.

  • High-strength titanium fasteners account for 32% of new installations
  • Automation in production lines increased assembly efficiency by 18%
  • Retrofitting projects contribute to 27% of fastener demand

Demand Forecast for Aerospace Fastener Market in China

China is expected to record a CAGR of 7.3%, slightly above the global CAGR, producing a multiplication factor of 1.04. Growth is driven by expansion of domestic commercial aircraft programs and increasing defense aircraft production. Emphasis is placed on fasteners capable of handling high vibration and thermal cycling conditions. Chinese manufacturers are investing in advanced alloy development and precision machining to enhance product reliability. It is widely believed that outsourcing of fastener assembly to regional suppliers is further accelerating adoption. By 2035, China’s aerospace fastener market is forecast to achieve broad penetration across commercial and defense platforms, supporting large-scale manufacturing programs.

  • Corrosion-resistant alloy fasteners represent 29% of total production
  • Precision machining adoption covers 34% of fastener production
  • Regional supplier partnerships contribute to 22% of market activity

Future Outlook for Aerospace Fastener Market in Germany

The aerospace fastener market in Germany is growing at a CAGR of 6.8%, slightly below the global 7.0%, yielding a multiplication factor of 0.97. Growth is supported by high-performance applications in commercial airliners and UAVs. Emphasis is placed on lightweight designs and aerospace-grade alloys capable of sustaining operational stress. Adoption of automated quality inspection techniques has enhanced fastener reliability and reduced production errors. Collaborative programs with other European manufacturers are further driving market activity. By 2035, Germany is expected to supply fasteners to a majority of European aircraft projects, while R&D initiatives continue to improve mechanical strength and corrosion resistance.

  • Lightweight aerospace-grade alloys account for 31% of production
  • Automated quality inspection is applied to 46% of fasteners
  • UAV projects drive 19% of total fastener demand

Premium Growth Trajectory of Aerospace Fastener Market in the United Kingdom

The United Kingdom aerospace fastener market is projected to expand at a CAGR of 6.5%, below the global 7.0%, with a multiplication factor of 0.93. Growth is primarily driven by retrofitting programs and defense fleet modernization. Fasteners are increasingly designed for durability under high stress and thermal variations. Adoption of standardized designs across multiple aircraft platforms enhances production efficiency. UK aerospace manufacturers focus on integrating advanced alloys and surface coatings to extend service life. By 2035, the United Kingdom is expected to maintain a stable position in the European fastener market, providing solutions for both civil and defense applications.

  • Retrofitting programs contribute to 24% of fastener usage
  • Standardized designs improve production efficiency by 17%
  • Surface-coated fasteners represent 28% of total production

Future Prospects for Aerospace Fastener Market in France

France is anticipated to record a CAGR of 6.3%, below the global CAGR, resulting in a multiplication factor of 0.90. Market expansion is largely influenced by regional jets and military aircraft programs. Emphasis is placed on fasteners with high corrosion resistance and thermal stability. Advanced CNC machining techniques are increasingly adopted to meet precision requirements. Collaboration between French aerospace suppliers and international OEMs is enhancing design standardization and material performance. By 2035, France is expected to maintain a consistent installed base for aerospace fasteners, supporting both domestic production and exports.
  • Corrosion-resistant fasteners represent 30% of installations
  • CNC machining covers 38% of total production processes
  • International OEM collaborations drive 20% of market activity

Leading Aerospace Fastener Manufacturers, Suppliers, Distributors

Aerospace Fasteners Market By Company

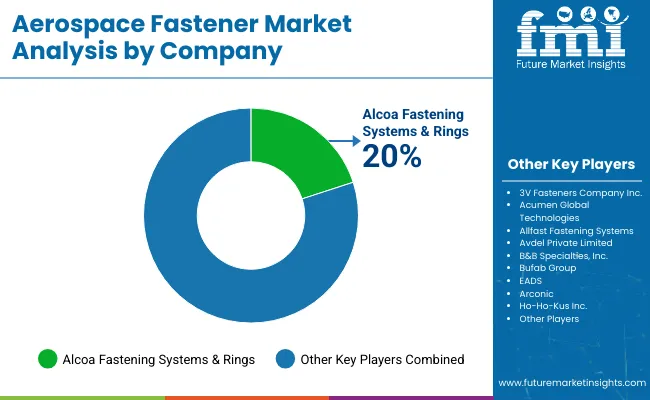
The aerospace fastener market is dominated by global suppliers providing high-strength, lightweight, and corrosion-resistant components for aircraft assembly and maintenance. Alcoa Fastening Systems & Rings is considered the leading player, supported by its extensive product range, global distribution network, and long-term contracts with commercial and defense aircraft manufacturers. 3V Fasteners Company Inc. and Acumen Global Technologies maintain strong positions through specialized fastener solutions and precision manufacturing capabilities, catering to both OEMs and aftermarket needs. Allfast Fastening Systems focuses on threaded inserts and installation systems that simplify assembly processes, while Avdel Private Limited emphasizes rivets and blind fasteners for high-performance aerospace applications.

Other players strengthen the market through niche expertise and regional reach. Companies compete through product quality, precision engineering, and reliable supply chains, ensuring both established and emerging players meet diverse aerospace requirements effectively.

Leading Players

  • Alcoa Fastening Systems & Rings
  • 3V Fasteners Company Inc.
  • Acumen Global Technologies
  • Allfast Fastening Systems
  • Avdel Private Limited
  • B&B Specialties, Inc.
  • Bufab Group
  • EADS
  • Arconic
  • Ho-Ho-Kus Inc.

Report Scope

Report Attributes Details
Market Size (2025) USD 9.85 billion
Projected Market Size (2035) USD 19.3 billion
CAGR (2025 to 2035) 7%
Base Year for Estimation 2024
Historical Period 2020 to 2024
Projection Period 2025 to 2035
Quantitative Units USD billion for value
Product Types Analyzed (Segment 1) Pins, Bolts, Studs, Screws, Rivets
Application Segments Analyzed (Segment 2) Commercial Aerospace, Military Aerospace
Material Types Analyzed (Segment 3) Aluminum, Steel, Superalloys, Titanium
Regions Covered North America, Europe, Asia Pacific, Latin America, Middle East & Africa, Oceania
Countries Covered United States, Canada, Brazil, Mexico, Germany, United Kingdom, France, Italy, Spain, China, Japan, India, South Korea, Australia, UAE, Saudi Arabia, South Africa
Leading Players 3V Fasteners Company Inc., Acumen Global Technologies, Advanced Logistics for Aerospace, Alcoa Fastening Systems & Rings, Allfast Fastening Systems, Avdel Private Limited, B&B Specialties, Inc., Bufab Group, EADS, Arconic, Ho-Ho- Kus Inc.
Additional Attributes Dollar sales by fastener type and aircraft application, demand dynamics across commercial, military, and space sectors, regional trends, innovation in lightweight alloys and corrosion-resistant coatings, environmental impact of material use, emerging use in UAVs and electric aircraft

Aerospace Fastener Market Analyzed by Key Investment Segments

By Product Type:

  • Pins
  • Bolts
  • Studs
  • Screws
  • Rivets

By Application:

  • Commercial Aerospace
  • Military Aerospace

By Material:

  • Aluminum
  • Steel
  • Superalloys
  • Titanium

By Region:

  • North America
  • Europe
  • Asia Pacific
  • Latin America
  • Middle East and Africa
  • Oceania

Table of Content

  1. Executive Summary
    • Global Market Outlook
    • Demand-side Trends
    • Supply-side Trends
    • Technology Roadmap Analysis
    • Analysis and Recommendations
  2. Market Overview
    • Market Coverage / Taxonomy
    • Market Definition / Scope / Limitations
  3. Market Background
    • Market Dynamics
      • Drivers
      • Restraints
      • Opportunity
      • Trends
    • Scenario Forecast
      • Demand in Optimistic Scenario
      • Demand in Likely Scenario
      • Demand in Conservative Scenario
    • Opportunity Map Analysis
    • Product Life Cycle Analysis
    • Supply Chain Analysis
      • Supply Side Participants and their Roles
        • Producers
        • Mid-Level Participants (Traders/ Agents/ Brokers)
        • Wholesalers and Distributors
      • Value Added and Value Created at Node in the Supply Chain
      • List of Raw Material Suppliers
      • List of Existing and Potential Buyer’s
    • Investment Feasibility Matrix
    • Value Chain Analysis
      • Profit Margin Analysis
      • Wholesalers and Distributors
      • Retailers
    • PESTLE and Porter’s Analysis
    • Regulatory Landscape
      • By Key Regions
      • By Key Countries
    • Regional Parent Market Outlook
    • Production and Consumption Statistics
    • Import and Export Statistics
  4. Global Market Analysis 2020 to 2024 and Forecast, 2025 to 2035
    • Historical Market Size Value (USD Billion) & Volume (Thousand Units) Analysis, 2020 to 2024
    • Current and Future Market Size Value (USD Billion) & Volume (Thousand Units) Projections, 2025 to 2035
      • Y-o-Y Growth Trend Analysis
      • Absolute $ Opportunity Analysis
  5. Global Market Pricing Analysis 2020 to 2024 and Forecast 2025 to 2035
  6. Global Market Analysis 2020 to 2024 and Forecast 2025 to 2035, By Product Type
    • Introduction / Key Findings
    • Historical Market Size Value (USD Billion) & Volume (Thousand Units) Analysis By Product Type, 2020 to 2024
    • Current and Future Market Size Value (USD Billion) & Volume (Thousand Units) Analysis and Forecast By Product Type, 2025 to 2035
      • Bolts
      • Screws
      • Rivets
      • Studs
      • Pins
    • Y-o-Y Growth Trend Analysis By Product Type, 2020 to 2024
    • Absolute $ Opportunity Analysis By Product Type, 2025 to 2035
  7. Global Market Analysis 2020 to 2024 and Forecast 2025 to 2035, By Application
    • Introduction / Key Findings
    • Historical Market Size Value (USD Billion) & Volume (Thousand Units) Analysis By Application, 2020 to 2024
    • Current and Future Market Size Value (USD Billion) & Volume (Thousand Units) Analysis and Forecast By Application, 2025 to 2035
      • Commercial Aerospace
      • Military Aerospace
    • Y-o-Y Growth Trend Analysis By Application, 2020 to 2024
    • Absolute $ Opportunity Analysis By Application, 2025 to 2035
  8. Global Market Analysis 2020 to 2024 and Forecast 2025 to 2035, By Material
    • Introduction / Key Findings
    • Historical Market Size Value (USD Billion) & Volume (Thousand Units) Analysis By Material, 2020 to 2024
    • Current and Future Market Size Value (USD Billion) & Volume (Thousand Units) Analysis and Forecast By Material, 2025 to 2035
      • Aluminum
      • Steel
      • Titanium
      • Superalloys
    • Y-o-Y Growth Trend Analysis By Material, 2020 to 2024
    • Absolute $ Opportunity Analysis By Material, 2025 to 2035
  9. Global Market Analysis 2020 to 2024 and Forecast 2025 to 2035, By Region
    • Introduction
    • Historical Market Size Value (USD Billion) & Volume (Thousand Units) Analysis By Region, 2020 to 2024
    • Current Market Size Value (USD Billion) & Volume (Thousand Units) Analysis and Forecast By Region, 2025 to 2035
      • North America
      • Latin America
      • Western Europe
      • Eastern Europe
      • East Asia
      • South Asia & Pacific
      • Middle East and Africa
    • Market Attractiveness Analysis By Region
  10. North America Market Analysis 2020 to 2024 and Forecast 2025 to 2035, By Country
    • Historical Market Size Value (USD Billion) & Volume (Thousand Units) Trend Analysis By Market Taxonomy, 2020 to 2024
    • Market Size Value (USD Billion) & Volume (Thousand Units) Forecast By Market Taxonomy, 2025 to 2035
      • By Country
        • USA
        • Canada
        • Mexico
      • By Product Type
      • By Application
      • By Material
    • Market Attractiveness Analysis
      • By Country
      • By Product Type
      • By Application
      • By Material
    • Key Takeaways
  11. Latin America Market Analysis 2020 to 2024 and Forecast 2025 to 2035, By Country
    • Historical Market Size Value (USD Billion) & Volume (Thousand Units) Trend Analysis By Market Taxonomy, 2020 to 2024
    • Market Size Value (USD Billion) & Volume (Thousand Units) Forecast By Market Taxonomy, 2025 to 2035
      • By Country
        • Brazil
        • Argentina
        • Rest of LATAM
      • By Product Type
      • By Application
      • By Material
    • Market Attractiveness Analysis
      • By Country
      • By Product Type
      • By Application
      • By Material
    • Key Takeaways
  12. Western Europe Market Analysis 2020 to 2024 and Forecast 2025 to 2035, By Country
    • Historical Market Size Value (USD Billion) & Volume (Thousand Units) Trend Analysis By Market Taxonomy, 2020 to 2024
    • Market Size Value (USD Billion) & Volume (Thousand Units) Forecast By Market Taxonomy, 2025 to 2035
      • By Country
        • Germany
        • Italy
        • France
        • UK
        • Spain
        • BENELUX
        • Nordic
        • Rest of W.Europe
      • By Product Type
      • By Application
      • By Material
    • Market Attractiveness Analysis
      • By Country
      • By Product Type
      • By Application
      • By Material
    • Key Takeaways
  13. Eastern Europe Market Analysis 2020 to 2024 and Forecast 2025 to 2035, By Country
    • Historical Market Size Value (USD Billion) & Volume (Thousand Units) Trend Analysis By Market Taxonomy, 2020 to 2024
    • Market Size Value (USD Billion) & Volume (Thousand Units) Forecast By Market Taxonomy, 2025 to 2035
      • By Country
        • Russia
        • Hungary
        • Poland
        • Balkan & Baltics
        • Rest of E. Europe
      • By Product Type
      • By Application
      • By Material
    • Market Attractiveness Analysis
      • By Country
      • By Product Type
      • By Application
      • By Material
    • Key Takeaways
  14. East Asia Market Analysis 2020 to 2024 and Forecast 2025 to 2035, By Country
    • Historical Market Size Value (USD Billion) & Volume (Thousand Units) Trend Analysis By Market Taxonomy, 2020 to 2024
    • Market Size Value (USD Billion) & Volume (Thousand Units) Forecast By Market Taxonomy, 2025 to 2035
      • By Country
        • China
        • Japan
        • South Korea
      • By Product Type
      • By Application
      • By Material
    • Market Attractiveness Analysis
      • By Country
      • By Product Type
      • By Application
      • By Material
    • Key Takeaways
  15. South Asia & Pacific Market Analysis 2020 to 2024 and Forecast 2025 to 2035, By Country
    • Historical Market Size Value (USD Billion) & Volume (Thousand Units) Trend Analysis By Market Taxonomy, 2020 to 2024
    • Market Size Value (USD Billion) & Volume (Thousand Units) Forecast By Market Taxonomy, 2025 to 2035
      • By Country
        • India
        • Australia & New Zealand
        • ASEAN
        • Rest of SAP
      • By Product Type
      • By Application
      • By Material
    • Market Attractiveness Analysis
      • By Country
      • By Product Type
      • By Application
      • By Material
    • Key Takeaways
  16. Middle East and Africa Market Analysis 2020 to 2024 and Forecast 2025 to 2035, By Country
    • Historical Market Size Value (USD Billion) & Volume (Thousand Units) Trend Analysis By Market Taxonomy, 2020 to 2024
    • Market Size Value (USD Billion) & Volume (Thousand Units) Forecast By Market Taxonomy, 2025 to 2035
      • By Country
        • GCC Countries
        • Northern Africa
        • South Africa
        • Turkiye
        • Rest of MEA
      • By Product Type
      • By Application
      • By Material
    • Market Attractiveness Analysis
      • By Country
      • By Product Type
      • By Application
      • By Material
    • Key Takeaways
  17. Key Countries Market Analysis
    • USA
      • Pricing Analysis
      • Market Share Analysis, 2024
        • By Product Type
        • By Application
        • By Material
    • Canada
      • Pricing Analysis
      • Market Share Analysis, 2024
        • By Product Type
        • By Application
        • By Material
    • Brazil
      • Pricing Analysis
      • Market Share Analysis, 2024
        • By Product Type
        • By Application
        • By Material
    • Mexico
      • Pricing Analysis
      • Market Share Analysis, 2024
        • By Product Type
        • By Application
        • By Material
    • Argentina
      • Pricing Analysis
      • Market Share Analysis, 2024
        • By Product Type
        • By Application
        • By Material
  18. Market Structure Analysis
    • Competition Dashboard
    • Competition Benchmarking
    • Market Share Analysis of Top Players
      • By Regional
      • By Product Type
      • By Application
      • By Material
  19. Competition Analysis
    • Competition Deep Dive
      • Alcoa Fastening Systems & Rings
        • Overview
        • Product Portfolio
        • Profitability by Market Segments (Product/Age /Sales Channel/Region)
        • Sales Footprint
        • Strategy Overview
          • Marketing Strategy
          • Product Strategy
          • Channel Strategy
      • 3V Fasteners Company Inc.
        • Overview
        • Product Portfolio
        • Profitability by Market Segments (Product/Age /Sales Channel/Region)
        • Sales Footprint
        • Strategy Overview
          • Marketing Strategy
          • Product Strategy
          • Channel Strategy
      • Acumen Global Technologies
        • Overview
        • Product Portfolio
        • Profitability by Market Segments (Product/Age /Sales Channel/Region)
        • Sales Footprint
        • Strategy Overview
          • Marketing Strategy
          • Product Strategy
          • Channel Strategy
      • Allfast Fastening Systems
        • Overview
        • Product Portfolio
        • Profitability by Market Segments (Product/Age /Sales Channel/Region)
        • Sales Footprint
        • Strategy Overview
          • Marketing Strategy
          • Product Strategy
          • Channel Strategy
      • Avdel Private Limited
        • Overview
        • Product Portfolio
        • Profitability by Market Segments (Product/Age /Sales Channel/Region)
        • Sales Footprint
        • Strategy Overview
          • Marketing Strategy
          • Product Strategy
          • Channel Strategy
      • B&B Specialties, Inc.
        • Overview
        • Product Portfolio
        • Profitability by Market Segments (Product/Age /Sales Channel/Region)
        • Sales Footprint
        • Strategy Overview
          • Marketing Strategy
          • Product Strategy
          • Channel Strategy
      • Bufab Group
        • Overview
        • Product Portfolio
        • Profitability by Market Segments (Product/Age /Sales Channel/Region)
        • Sales Footprint
        • Strategy Overview
          • Marketing Strategy
          • Product Strategy
          • Channel Strategy
      • EADS
        • Overview
        • Product Portfolio
        • Profitability by Market Segments (Product/Age /Sales Channel/Region)
        • Sales Footprint
        • Strategy Overview
          • Marketing Strategy
          • Product Strategy
          • Channel Strategy
      • Arconic
        • Overview
        • Product Portfolio
        • Profitability by Market Segments (Product/Age /Sales Channel/Region)
        • Sales Footprint
        • Strategy Overview
          • Marketing Strategy
          • Product Strategy
          • Channel Strategy
      • Ho-Ho-Kus Inc.
        • Overview
        • Product Portfolio
        • Profitability by Market Segments (Product/Age /Sales Channel/Region)
        • Sales Footprint
        • Strategy Overview
          • Marketing Strategy
          • Product Strategy
          • Channel Strategy
  20. Assumptions & Acronyms Used
  21. Research Methodology

List of Tables

  • Table 1: Global Market Value (USD Billion) Forecast by Region, 2020-2035
  • Table 2: Global Market Volume (Thousand Units) Forecast by Region, 2020-2035
  • Table 3: Global Market Value (USD Billion) Forecast by Product Type, 2020-2035
  • Table 4: Global Market Volume (Thousand Units) Forecast by Product Type, 2020-2035
  • Table 5: Global Market Value (USD Billion) Forecast by Application, 2020-2035
  • Table 6: Global Market Volume (Thousand Units) Forecast by Application, 2020-2035
  • Table 7: Global Market Value (USD Billion) Forecast by Material, 2020-2035
  • Table 8: Global Market Volume (Thousand Units) Forecast by Material, 2020-2035
  • Table 9: North America Market Value (USD Billion) Forecast by Country, 2020-2035
  • Table 10: North America Market Volume (Thousand Units) Forecast by Country, 2020-2035
  • Table 11: North America Market Value (USD Billion) Forecast by Product Type, 2020-2035
  • Table 12: North America Market Volume (Thousand Units) Forecast by Product Type, 2020-2035
  • Table 13: North America Market Value (USD Billion) Forecast by Application, 2020-2035
  • Table 14: North America Market Volume (Thousand Units) Forecast by Application, 2020-2035
  • Table 15: North America Market Value (USD Billion) Forecast by Material, 2020-2035
  • Table 16: North America Market Volume (Thousand Units) Forecast by Material, 2020-2035
  • Table 17: Latin America Market Value (USD Billion) Forecast by Country, 2020-2035
  • Table 18: Latin America Market Volume (Thousand Units) Forecast by Country, 2020-2035
  • Table 19: Latin America Market Value (USD Billion) Forecast by Product Type, 2020-2035
  • Table 20: Latin America Market Volume (Thousand Units) Forecast by Product Type, 2020-2035
  • Table 21: Latin America Market Value (USD Billion) Forecast by Application, 2020-2035
  • Table 22: Latin America Market Volume (Thousand Units) Forecast by Application, 2020-2035
  • Table 23: Latin America Market Value (USD Billion) Forecast by Material, 2020-2035
  • Table 24: Latin America Market Volume (Thousand Units) Forecast by Material, 2020-2035
  • Table 25: Western Europe Market Value (USD Billion) Forecast by Country, 2020-2035
  • Table 26: Western Europe Market Volume (Thousand Units) Forecast by Country, 2020-2035
  • Table 27: Western Europe Market Value (USD Billion) Forecast by Product Type, 2020-2035
  • Table 28: Western Europe Market Volume (Thousand Units) Forecast by Product Type, 2020-2035
  • Table 29: Western Europe Market Value (USD Billion) Forecast by Application, 2020-2035
  • Table 30: Western Europe Market Volume (Thousand Units) Forecast by Application, 2020-2035
  • Table 31: Western Europe Market Value (USD Billion) Forecast by Material, 2020-2035
  • Table 32: Western Europe Market Volume (Thousand Units) Forecast by Material, 2020-2035
  • Table 33: Eastern Europe Market Value (USD Billion) Forecast by Country, 2020-2035
  • Table 34: Eastern Europe Market Volume (Thousand Units) Forecast by Country, 2020-2035
  • Table 35: Eastern Europe Market Value (USD Billion) Forecast by Product Type, 2020-2035
  • Table 36: Eastern Europe Market Volume (Thousand Units) Forecast by Product Type, 2020-2035
  • Table 37: Eastern Europe Market Value (USD Billion) Forecast by Application, 2020-2035
  • Table 38: Eastern Europe Market Volume (Thousand Units) Forecast by Application, 2020-2035
  • Table 39: Eastern Europe Market Value (USD Billion) Forecast by Material, 2020-2035
  • Table 40: Eastern Europe Market Volume (Thousand Units) Forecast by Material, 2020-2035
  • Table 41: East Asia Market Value (USD Billion) Forecast by Country, 2020-2035
  • Table 42: East Asia Market Volume (Thousand Units) Forecast by Country, 2020-2035
  • Table 43: East Asia Market Value (USD Billion) Forecast by Product Type, 2020-2035
  • Table 44: East Asia Market Volume (Thousand Units) Forecast by Product Type, 2020-2035
  • Table 45: East Asia Market Value (USD Billion) Forecast by Application, 2020-2035
  • Table 46: East Asia Market Volume (Thousand Units) Forecast by Application, 2020-2035
  • Table 47: East Asia Market Value (USD Billion) Forecast by Material, 2020-2035
  • Table 48: East Asia Market Volume (Thousand Units) Forecast by Material, 2020-2035
  • Table 49: South Asia & Pacific Market Value (USD Billion) Forecast by Country, 2020-2035
  • Table 50: South Asia & Pacific Market Volume (Thousand Units) Forecast by Country, 2020-2035
  • Table 51: South Asia & Pacific Market Value (USD Billion) Forecast by Product Type, 2020-2035
  • Table 52: South Asia & Pacific Market Volume (Thousand Units) Forecast by Product Type, 2020-2035
  • Table 53: South Asia & Pacific Market Value (USD Billion) Forecast by Application, 2020-2035
  • Table 54: South Asia & Pacific Market Volume (Thousand Units) Forecast by Application, 2020-2035
  • Table 55: South Asia & Pacific Market Value (USD Billion) Forecast by Material, 2020-2035
  • Table 56: South Asia & Pacific Market Volume (Thousand Units) Forecast by Material, 2020-2035
  • Table 57: Middle East and Africa Market Value (USD Billion) Forecast by Country, 2020-2035
  • Table 58: Middle East and Africa Market Volume (Thousand Units) Forecast by Country, 2020-2035
  • Table 59: Middle East and Africa Market Value (USD Billion) Forecast by Product Type, 2020-2035
  • Table 60: Middle East and Africa Market Volume (Thousand Units) Forecast by Product Type, 2020-2035
  • Table 61: Middle East and Africa Market Value (USD Billion) Forecast by Application, 2020-2035
  • Table 62: Middle East and Africa Market Volume (Thousand Units) Forecast by Application, 2020-2035
  • Table 63: Middle East and Africa Market Value (USD Billion) Forecast by Material, 2020-2035
  • Table 64: Middle East and Africa Market Volume (Thousand Units) Forecast by Material, 2020-2035

List of Figures

  • Figure 1: Global Market Volume (Thousand Units) Forecast 2020-2035
  • Figure 2: Global Market Pricing Analysis
  • Figure 3: Global Market Value (USD Billion) Forecast 2020-2035
  • Figure 4: Global Market Value Share and BPS Analysis by Product Type, 2025 and 2035
  • Figure 5: Global Market Y-o-Y Growth Comparison by Product Type, 2025-2035
  • Figure 6: Global Market Attractiveness Analysis by Product Type
  • Figure 7: Global Market Value Share and BPS Analysis by Application, 2025 and 2035
  • Figure 8: Global Market Y-o-Y Growth Comparison by Application, 2025-2035
  • Figure 9: Global Market Attractiveness Analysis by Application
  • Figure 10: Global Market Value Share and BPS Analysis by Material, 2025 and 2035
  • Figure 11: Global Market Y-o-Y Growth Comparison by Material, 2025-2035
  • Figure 12: Global Market Attractiveness Analysis by Material
  • Figure 13: Global Market Value (USD Billion) Share and BPS Analysis by Region, 2025 and 2035
  • Figure 14: Global Market Y-o-Y Growth Comparison by Region, 2025-2035
  • Figure 15: Global Market Attractiveness Analysis by Region
  • Figure 16: North America Market Incremental $ Opportunity, 2025-2035
  • Figure 17: Latin America Market Incremental $ Opportunity, 2025-2035
  • Figure 18: Western Europe Market Incremental $ Opportunity, 2025-2035
  • Figure 19: Eastern Europe Market Incremental $ Opportunity, 2025-2035
  • Figure 20: East Asia Market Incremental $ Opportunity, 2025-2035
  • Figure 21: South Asia & Pacific Market Incremental $ Opportunity, 2025-2035
  • Figure 22: Middle East and Africa Market Incremental $ Opportunity, 2025-2035
  • Figure 23: North America Market Value Share and BPS Analysis by Country, 2025 and 2035
  • Figure 24: North America Market Value Share and BPS Analysis by Product Type, 2025 and 2035
  • Figure 25: North America Market Y-o-Y Growth Comparison by Product Type, 2025-2035
  • Figure 26: North America Market Attractiveness Analysis by Product Type
  • Figure 27: North America Market Value Share and BPS Analysis by Application, 2025 and 2035
  • Figure 28: North America Market Y-o-Y Growth Comparison by Application, 2025-2035
  • Figure 29: North America Market Attractiveness Analysis by Application
  • Figure 30: North America Market Value Share and BPS Analysis by Material, 2025 and 2035
  • Figure 31: North America Market Y-o-Y Growth Comparison by Material, 2025-2035
  • Figure 32: North America Market Attractiveness Analysis by Material
  • Figure 33: Latin America Market Value Share and BPS Analysis by Country, 2025 and 2035
  • Figure 34: Latin America Market Value Share and BPS Analysis by Product Type, 2025 and 2035
  • Figure 35: Latin America Market Y-o-Y Growth Comparison by Product Type, 2025-2035
  • Figure 36: Latin America Market Attractiveness Analysis by Product Type
  • Figure 37: Latin America Market Value Share and BPS Analysis by Application, 2025 and 2035
  • Figure 38: Latin America Market Y-o-Y Growth Comparison by Application, 2025-2035
  • Figure 39: Latin America Market Attractiveness Analysis by Application
  • Figure 40: Western Europe Market Value Share and BPS Analysis by Country, 2025 and 2035
  • Figure 41: Western Europe Market Value Share and BPS Analysis by Product Type, 2025 and 2035
  • Figure 42: Western Europe Market Y-o-Y Growth Comparison by Product Type, 2025-2035
  • Figure 43: Western Europe Market Attractiveness Analysis by Product Type
  • Figure 44: Western Europe Market Value Share and BPS Analysis by Application, 2025 and 2035
  • Figure 45: Western Europe Market Y-o-Y Growth Comparison by Application, 2025-2035
  • Figure 46: Western Europe Market Attractiveness Analysis by Application
  • Figure 47: Western Europe Market Value Share and BPS Analysis by Material, 2025 and 2035
  • Figure 48: Western Europe Market Y-o-Y Growth Comparison by Material, 2025-2035
  • Figure 49: Western Europe Market Attractiveness Analysis by Material
  • Figure 50: Eastern Europe Market Value Share and BPS Analysis by Country, 2025 and 2035
  • Figure 51: Eastern Europe Market Value Share and BPS Analysis by Product Type, 2025 and 2035
  • Figure 52: Eastern Europe Market Y-o-Y Growth Comparison by Product Type, 2025-2035
  • Figure 53: Eastern Europe Market Attractiveness Analysis by Product Type
  • Figure 54: Eastern Europe Market Value Share and BPS Analysis by Application, 2025 and 2035
  • Figure 55: Eastern Europe Market Y-o-Y Growth Comparison by Application, 2025-2035
  • Figure 56: Eastern Europe Market Attractiveness Analysis by Application
  • Figure 57: Eastern Europe Market Value Share and BPS Analysis by Material, 2025 and 2035
  • Figure 58: Eastern Europe Market Y-o-Y Growth Comparison by Material, 2025-2035
  • Figure 59: Eastern Europe Market Attractiveness Analysis by Material
  • Figure 60: East Asia Market Value Share and BPS Analysis by Country, 2025 and 2035
  • Figure 61: East Asia Market Value Share and BPS Analysis by Product Type, 2025 and 2035
  • Figure 62: East Asia Market Y-o-Y Growth Comparison by Product Type, 2025-2035
  • Figure 63: East Asia Market Attractiveness Analysis by Product Type
  • Figure 64: East Asia Market Value Share and BPS Analysis by Application, 2025 and 2035
  • Figure 65: East Asia Market Y-o-Y Growth Comparison by Application, 2025-2035
  • Figure 66: East Asia Market Attractiveness Analysis by Application
  • Figure 67: East Asia Market Value Share and BPS Analysis by Material, 2025 and 2035
  • Figure 68: East Asia Market Y-o-Y Growth Comparison by Material, 2025-2035
  • Figure 69: East Asia Market Attractiveness Analysis by Material
  • Figure 70: South Asia & Pacific Market Value Share and BPS Analysis by Country, 2025 and 2035
  • Figure 71: South Asia & Pacific Market Value Share and BPS Analysis by Product Type, 2025 and 2035
  • Figure 72: South Asia & Pacific Market Y-o-Y Growth Comparison by Product Type, 2025-2035
  • Figure 73: South Asia & Pacific Market Attractiveness Analysis by Product Type
  • Figure 74: South Asia & Pacific Market Value Share and BPS Analysis by Application, 2025 and 2035
  • Figure 75: South Asia & Pacific Market Y-o-Y Growth Comparison by Application, 2025-2035
  • Figure 76: South Asia & Pacific Market Attractiveness Analysis by Application
  • Figure 77: South Asia & Pacific Market Value Share and BPS Analysis by Material, 2025 and 2035
  • Figure 78: South Asia & Pacific Market Y-o-Y Growth Comparison by Material, 2025-2035
  • Figure 79: South Asia & Pacific Market Attractiveness Analysis by Material
  • Figure 80: Middle East and Africa Market Value Share and BPS Analysis by Country, 2025 and 2035
  • Figure 81: Middle East and Africa Market Value Share and BPS Analysis by Product Type, 2025 and 2035
  • Figure 82: Middle East and Africa Market Y-o-Y Growth Comparison by Product Type, 2025-2035
  • Figure 83: Middle East and Africa Market Attractiveness Analysis by Product Type
  • Figure 84: Middle East and Africa Market Value Share and BPS Analysis by Application, 2025 and 2035
  • Figure 85: Middle East and Africa Market Y-o-Y Growth Comparison by Application, 2025-2035
  • Figure 86: Middle East and Africa Market Attractiveness Analysis by Application
  • Figure 87: Middle East and Africa Market Value Share and BPS Analysis by Material, 2025 and 2035
  • Figure 88: Middle East and Africa Market Y-o-Y Growth Comparison by Material, 2025-2035
  • Figure 89: Middle East and Africa Market Attractiveness Analysis by Material
  • Figure 90: Global Market - Tier Structure Analysis
  • Figure 91: Global Market - Company Share Analysis
  •  

Frequently Asked Questions

What is the market size of the aerospace fastener market in 2025?

The market size is valued at USD 9.85 billion in 2025.

How much will the aerospace fastener market reach by 2035?

It is projected to reach USD 19.3 billion by 2035.

What is the forecast CAGR for the aerospace fastener market from 2025 to 2035?

The market is expected to grow at a CAGR of 7% during 2025-2035.

Which product type holds the largest share in the aerospace fastener market?

Bolts hold the largest share with 30% in 2025.

Who is the leading player in the aerospace fastener market?

Alcoa Fastening Systems & Rings is the leading player with 20% share.

Explore Similar Insights

Future Market Insights

Aerospace Fastener Market

Chat With

MaRIA

Hi There, I am MaRIA, Your Market Research Intelligence Assistant. How may I help you?