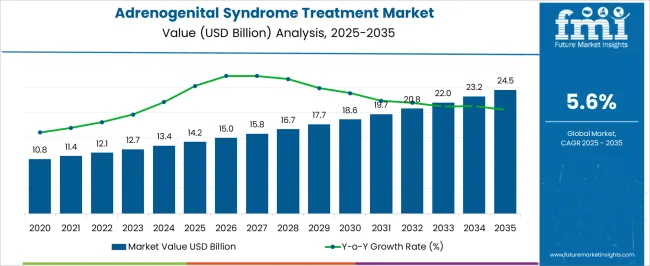
The Adrenogenital Syndrome Treatment Market is estimated to be valued at USD 14.2 billion in 2025 and is projected to reach USD 24.5 billion by 2035, registering a compound annual growth rate (CAGR) of 5.6% over the forecast period.
| Metric | Value |
|---|---|
| Adrenogenital Syndrome Treatment Market Estimated Value in (2025 E) | USD 14.2 billion |
| Adrenogenital Syndrome Treatment Market Forecast Value in (2035 F) | USD 24.5 billion |
| Forecast CAGR (2025 to 2035) | 5.6% |
The adrenogenital syndrome treatment market is witnessing consistent growth driven by increasing diagnosis rates, advances in endocrinology, and greater access to specialized care. Rising awareness among healthcare professionals and patients regarding early symptom management has contributed to growing therapeutic demand.
Improved drug formulations with better safety and efficacy profiles are enhancing long term adherence, while clinical guidelines continue to recommend standardized treatments that ensure hormonal balance. Expansion of healthcare infrastructure and insurance coverage in developing regions is broadening the patient base, making therapies more accessible.
Furthermore, ongoing clinical research aimed at optimizing dosing regimens and reducing side effects is expected to strengthen the outlook for treatment adoption. With emphasis on patient centric approaches and precision medicine, the market remains well positioned for sustained growth in the coming years.
The market is segmented by Drug Type, Route of Administration, and Distribution Channel and region. By Drug Type, the market is divided into Mineralocorticoids and Glucocorticoids. In terms of Route of Administration, the market is classified into Oral, Parenteral, Intravenous, Inhaled, and Others. Based on Distribution Channel, the market is segmented into Hospital Pharmacies, Retail Pharmacies, and Others. Regionally, the market is classified into North America, Latin America, Western Europe, Eastern Europe, Balkan & Baltic Countries, Russia & Belarus, Central Asia, East Asia, South Asia & Pacific, and the Middle East & Africa.
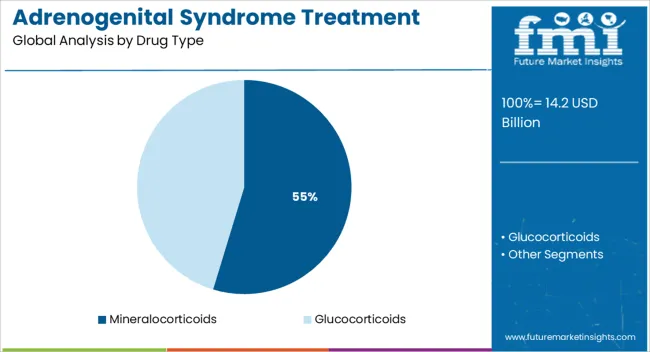
The mineralocorticoids segment is expected to hold 54.70% of total market revenue by 2025 within the drug type category, making it the leading treatment class. This dominance is attributed to the central role of mineralocorticoids in regulating salt balance and blood pressure, which are critical in managing adrenogenital syndrome.
Their consistent inclusion in treatment protocols, coupled with established clinical efficacy, has reinforced their widespread adoption.
The long history of use, predictable therapeutic outcomes, and physician familiarity with these drugs further contribute to their market leadership.
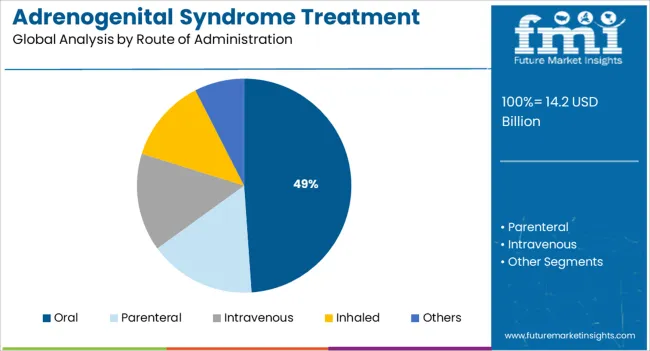
The oral segment is projected to account for 48.90% of market revenue by 2025 within the route of administration category, positioning it as the most significant mode of delivery. This is driven by the convenience of oral dosing, higher patient compliance, and cost effectiveness when compared with alternative routes.
Oral formulations allow for easy integration into daily treatment regimens, reducing the burden on patients and caregivers.
Moreover, advances in oral drug delivery systems aimed at improving absorption and minimizing side effects are supporting strong adoption in this segment.
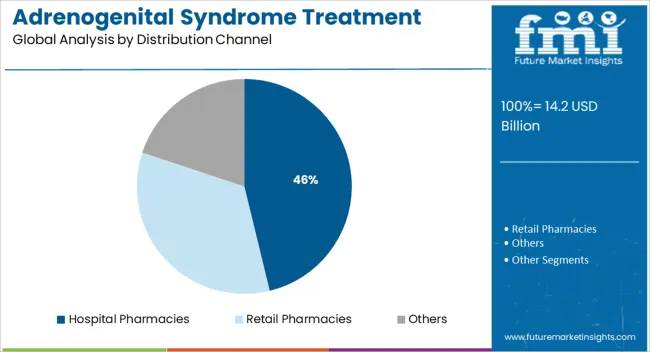
The hospital pharmacies segment is anticipated to contribute 46.20% of total market revenue by 2025 under the distribution channel category, establishing it as the dominant channel. This is due to the critical role hospital pharmacies play in dispensing specialized therapies for chronic endocrine disorders.
Their integration with multidisciplinary care teams ensures appropriate monitoring, dosage adjustments, and patient education.
Strong supply chain reliability and access to comprehensive treatment options within hospital settings further reinforce the dominance of this channel in the adrenogenital syndrome treatment market.
The adrenogenital syndrome treatment market in North America is estimated to be dominant, due to a strong healthcare infrastructure and high awareness of rare diseases in the region. The North America leads the market, owing to the strong investment in R&D for new therapeutic and formulation providing technologies in countries such as the United States and Canada.
They are also demand for corticosteroids, hormone replacement therapies, gene-based therapies and growth hormone along with that precision medicine & personalized healthcare sector remains a major driving factor for the market.
Regulatory frameworks including but not limited to the Food and Drug Administration (FDA) and Health Canada standards shape market dynamics by imposing safety, efficacy and clinical trial standards. On the contrary, high treatment expenditures and the limited access of patients to specialized treatment, which may restrain the growth of the market.
Europe is expected to be the fastest-growing market for the adrenogenital syndrome treatment due to countries such as Germany, France, and the United Kingdom government support for implementation of the rare diseases management in which orphan drug productions are included, which is also an important aspect related to AGS. Market growth is propelled by the region's focus on early diagnosis and advanced treatment options.
Market growth is driven by the growing use of hormone therapies, enzyme replacement therapies, and new gene therapies. Nonetheless, the EU's rigorous approval and pricing policies via the EMA and increasing pharmaceutical pricing policies influence market conditions. The European manufacturers are looking to go further by ensuring the accessibility and affordability of the drugs and in ensuring their adherence to regulatory standards for the continued growth of the market in the years to come.
The Asia-Pacific region is expected to register the fastest growth of the adrenogenital syndrome treatment market, owing to the rising healthcare spending and growing awareness about genetic disorders, as well as improving medical research in countries like China, Japan, South Korea and India. Government reforms to healthcare systems and increasing pharmaceutical production capacities, make new treatment methods, pediatric demands and low-cost medications a high-demand segment market.
The region enjoys a burgeoning biotechnology sector and growing collaboration between healthcare research institutions and pharmaceutical companies, allowing for quicker development and access to medications. Regulatory hurdles, inadequate healthcare infrastructure, and affordability constraints, however, remain dampeners on market scalability." Awareness campaigns, government support for orphan drugs, and advances in technology for gene-oriented therapies are shaping future market trends and encouraging investments in novel therapeutic solutions.
Challenge
Limited Awareness and Delayed Diagnosis
Low awareness and diagnosis around adrenogenital syndrome serves as a key restraint on adrenogenital syndrome treatment market. Additionally, the absence of widespread screening programs results in most cases not being detected during the early stages, which complicates their management.
Further, the inconsistency of treatment protocols from one region to another contributes to how consistent care is. However, solutions require more awareness campaigns, better diagnostic availability, and standardized treatment models.
Opportunity
Advancements in Gene Therapy and Hormonal Treatment
Gene therapy and advanced hormonal treatments are likely to present significant growth opportunities in the adrenogenital syndrome treatment market. New technology for targeted gene editing and long term hormonal tricks that help with health be intractable disease and quality of life make available to patients. Furthermore, advancements in this field are being propelled by heightened investment in rare disease research, as well as developing personalized treatment strategies.
2024 to 2025 also saw increased research into novel therapies focusing on enhanced steroid replacement treatments. Thus, limited access to advanced treatments as well as discrepancies in healthcare infrastructure were considerable obstacles. Early diagnosis was addressed by systematic new-born screening programs, and patient education was improved.
2025 to 2035 Beyond: Genetic modification, compatibility in precision medicine, and AI-assisted diagnosis will transform the market. Greater collaboration between drug makers and universities will speed the development of curative therapies. In addition, they will also address through improvements in telemedicine capabilities and digital health tools tracking of diseases and patient adherence to treatment plans.
Market Shifts: A Comparative Analysis (2024 to 2025 vs. 2025 to 2035)
| Market Shift | 2024 to 2025 Trends |
|---|---|
| Regulatory Landscape | Regulatory hurdles for novel therapies |
| Technological Advancements | Focus on improved steroid replacement therapies |
| Industry Adoption | Increased focus on early screening and patient education |
| Supply Chain and Sourcing | Dependence on traditional pharmaceutical supply chains |
| Market Competition | Presence of established pharmaceutical companies |
| Market Growth Drivers | Rising awareness and new-born screening initiatives |
| Sustainability and Energy Efficiency | Limited focus on sustainable drug manufacturing |
| Integration of Smart Monitoring | Limited real-time tracking of treatment adherence |
| Advancements in Treatment Innovation | Development of extended-release hormone therapies |
| Market Shift | 2025 to 2035 Projections |
|---|---|
| Regulatory Landscape | Streamlined approval pathways for gene therapies and personalized treatments |
| Technological Advancements | Development of gene editing solutions and AI-driven diagnostics |
| Industry Adoption | Expansion of precision medicine and personalized treatment protocols |
| Supply Chain and Sourcing | Integration of biotech innovations and advanced drug delivery systems |
| Market Competition | Growth of biotech firms specializing in rare disease treatments |
| Market Growth Drivers | Increased investment in gene therapy and digital health solutions |
| Sustainability and Energy Efficiency | Adoption of eco-friendly pharmaceutical production and AI-optimized drug development |
| Integration of Smart Monitoring | AI-driven remote monitoring and patient engagement tools |
| Advancements in Treatment Innovation | Expansion of curative treatments through gene and cell therapies |
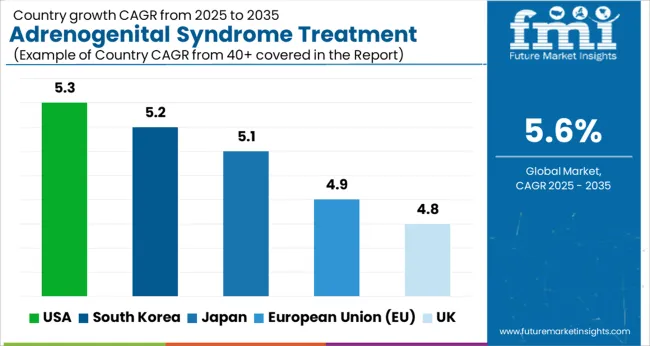
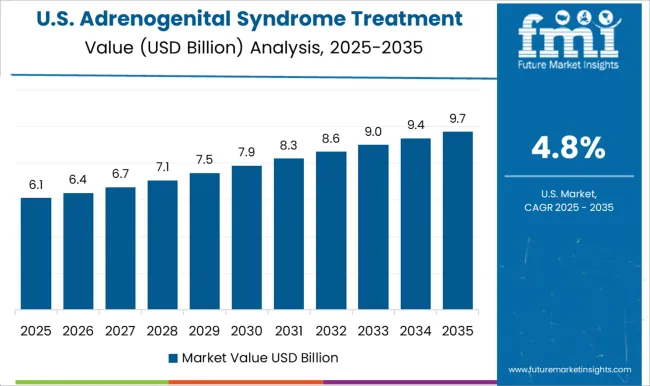
The treatment market for USA adrenogenital syndrome (AGS) is flourishing due to growing awareness, screening programs for genetics, and corticosteroid therapy. The growing investments in research to overcome rare diseases, hormone replacement therapy, and personalized treatment approaches are also contributing to the market growth.
Heavenly healthcare hotspots, from New York and Boston to Los Angeles, head clinical trials, gene therapy exploration, and digital health approaches to AGS management.
| Country | CAGR (2025 to 2035) |
|---|---|
| USA | 5.3% |
Factors such as government-supported rare disease initiatives, rising adoption of precision medicine, and enhanced new-born screening programs are driving the UK market of AGS therapy.
In cities that include London, Manchester, and Edinburgh, leading organizations are developing new steroid replacement therapies, genetic counselling services, and digital adherence solutions for patients with AGS.
| Country | CAGR (2025 to 2035) |
|---|---|
| UK | 4.8% |
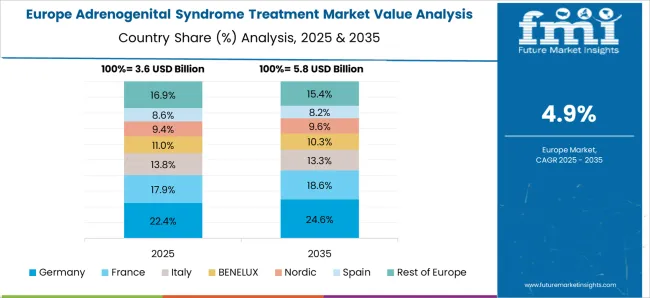
The AGS Treatment market in the EU is growing along with the endocrinology research market, the hormone therapies pipeline through EU or cross-border collaborations for rare disease management signage.
Adrenal disorder research in Germany, Advances in pediatric hormone therapy in France and Italy, and AI-based patient monitoring systems. The market is getting also benefiting from regulatory initiatives implemented by the EMA (European Medicines Agency) that are facilitating the introduction of orphan drugs with early approvals and improved access.
| Region | CAGR (2025 to 2035) |
|---|---|
| European Union (EU) | 4.9% |
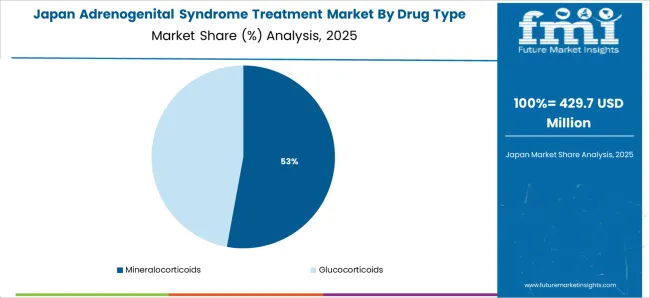
The market for AGS treatment in Japan is flourishing as a result of growing genetic testing initiatives, advanced endocrine disorder management programs, and innovations in hormone delivery systems.
Next-generation corticosteroids, slow-release hormone therapies, and even gene-editing solutions are all getting some attention at research centers in Tokyo and Osaka looking to boost treatment efficacy and lower side effects.
| Country | CAGR (2025 to 2035) |
|---|---|
| Japan | 5.1% |
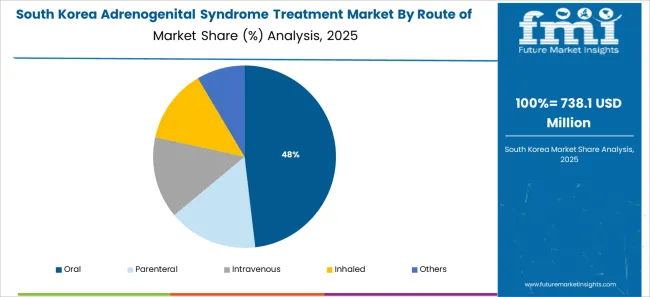
The South Korea AGS treatment market is observing growth due to rare disease spending by the government, improved neonatal screening programs, and investments in biopharmaceutical research.
Seoul and Busan are on the rise in personalized hormone therapy, AI-empowered patient monitoring, and digital health platform for AGS management.
| Country | CAGR (2025 to 2035) |
|---|---|
| South Korea | 5.2% |
Growing incidence of congenital adrenal hyperplasia (CAH), innovation of hormone replacement therapies, and increasing awareness towards early diagnosis and the treatment are some of the factors for the high share of AGS treatment market segments.
Glucocorticoid and mineralocorticoid therapy is an important aspect of managing the condition, and its demand is further driven by healthcare providers striving to enhance patient outcomes and overall quality of life. The emergence of new drug formulations and administration techniques is transforming despite AGS treatment as pharmaceutical innovation continues, which will cater to substantial momentum in market growth.
Current management involves glucocorticoids and mineralocorticoids to achieve hormonal stability and prevent complications of adrenal insufficiency. Newer formulations, particularly considered, have been proven effective with much less side effects, longer effect and more active bioavailability, improving treatment compliance and providing additional therapeutic advantage as compared to conventional therapies.
The mainstay of treatment for AGS is glucocorticoids, which are efficient in suppressing excessive androgen production and restoring cortisol homeostasis. Commonly prescribed medicines include hydrocortisone, prednisone and dexamethasone, with newer long-acting versions providing more stable hormone levels and less frequent dosing.
These therapies allow for the prevention of virilization in females, do not exacerbate growth abnormalities and ensure proper metabolic function in those affected. Studies suggest that more than 80% of AGS patients need lifelong glucocorticoid treatment, and as such, this segment is going to play a vital role in market growth.
This has led to new glucocorticoid formulations with modified-release properties mimicking natural physiological cortisol rhythm, allowing to minimise long-term complications such as osteoporosis and metabolic syndrome.
Moreover, precision medicine strategies allow for personalized dosing regimens informed by genetic profiling, maximizing treatment efficacy and minimizing side effects. In addition, AI-driven drug optimization and hormone monitoring platforms are further refining the efficacy of glucocorticoid therapy, which enhances patient management and compliance.
Once a diagnosis is established, mineralocorticoids and medicines used in adrenal insufficiency, such as fludrocortisone, are critical in the treatment of AGS to maintain electrolytic equilibrium and prevent salt-wasting crises in patients with classic congenital adrenal hyperplasia (CAH).
They help to maintain normal sodium retention, potassium secretion, and blood pressure, which in turn helps to prevent dehydration and cardiovascular problems. The increased awareness of the importance of early intervention and neonatal screening have contributed to greater rates of mineralocorticoid therapy implementation, especially for more pediatric patients.
The global glucocorticoids and mineralocorticoids market is poised for considerable growth as pharmaceutical companies allocate resources toward the development of new steroid formulations that retain the therapeutic benefit of traditional steroids while minimizing side effects and enhancing absorption rates.
The growing implementation of genetic screening programs, patient-centered treatment models, and innovations in hormone replacement therapy are increasing the demand for these essential AGS treatments. Alongside challenges like risk of long-term dependence and adverse metabolic effects, the market is constantly evolving with continuing research of novel steroid-sparing agents and combination therapies.
AGS treatment is mainly administered via the oral and parenteral routes, which are flexible, convenient, and effectively wound up systemically. Pharma’s will be working to optimize these delivery methods for optimal absorption of the medication, minimal side effects and therefore compliance leading to better long-term management of AGS.
Oral administration is still the route of choice for AGS therapy, especially for glucocorticoids and mineralocorticoids. Oral tablets, capsules, and liquid formulations are easy to use, provide predictable dosing, and are cost-effective making them ideal for long term therapy.
The most commonly prescribed oral agents are hydrocortisone, prednisone, and dexamethasone, which, when appropriately dosed, guarantee both maximal androgen suppression with replacement of the physiologic cortisol level. The development of controlled-release formulations has also revolutionised treatment, allowing for less frequent dosing (in some cases even a single daily percutaneous injection) and a more steady release of testosterone into the circulation.
Charmingly integrated into innovative taste-masked liquid formulations and dispersible tablets, they are vital in promoting treatment adherence, especially in the pediatric and geriatric populations, where oral dosage forms may present difficulties due to swallowing complications.
Moreover, details that novel pharmacological developments in the form of nano particular drug delivery systems are increased the bioavailability levels of oral steroids for implementing well-finished hormone restoration therapy. Growing pharma cogenomic profiling with similar imagery regulates personalized oral medicines and increases treatment effectiveness while minimizing side effects.
The parenteral route, particularly intravenous and intramuscular injections, is essential in the emergency treatment of adrenal crises as well as in severe cases of AGS. Fever and/or shock in patients with known adrenal insufficiency require immediate treatment in the form of intravenous hydrocortisone to rapidly restore cortisol levels and prevent life-threatening complications. Intramuscular glucocorticoid injections are likewise used in acute situations yielding extended hormone delivery when systems to provide oral therapy are not possible.
Over the last few years, there has been an explosion of innovation in parenteral drug delivery with the introduction of emergency auto-injectors and designer pre-filled syringes allowing rapid and easier administration during an adrenal crisis.
Long-acting injectable formulations are also emerging, providing around-the-clock hormonal coverage in a reduced pill burden following injection. Patient education by healthcare providers on steroid administration in emergency situations is likely to prompt the development of easy-to-use parenteral products, which in turn is expected to boost segment growth.
With inhaled and other novel drug delivery methods on the horizon, AGS treatment may become safer and more effective due to non-invasive administration and increased absorption in the GI tract. The evidence base for using inhaled corticosteroids in AGS is accumulating, with the advantages discussed possibly including rapid onset of action, fewer systemic side effects, and better adherence.
Recently, inhaled glucocorticoids have been evaluated as adjunctive therapy; however, they should be balanced as adjunct therapy for mild adrenal insufficiency signs and to determine optimal cortisol levels.
These formulations utilize pulmonary drug delivery systems for rapid systemic absorption while circumventing gastrointestinal and hepatic metabolism. Though their clinical use is still nascent, inhaled corticosteroids could prove useful in optimizing AGS treatment strategies, particularly among pediatric and adolescent age groups.
Novel strategies for AGS management are being explored beyond direct inhaled therapy including the use of transdermal patches, subcutaneous implants and buccal formulations.
Transdermal cortisol replacement therapies allow for continuous delivery of the hormone and eliminate the peaks and valleys associated with traditional capsule-based hormone replacement, allowing for more physiologic cortisol rhythms and lower potential hormonal surges. In contrast, there are subcutaneous hormone-releasing implants, which do not require daily medication intake and improve treatment adherence.
Another area currently under investigation are non-invasive drug formulations such as buccal and sublingual formulations that allow for rapid absorption in the mucosal lining bypassing first pass metabolism. This approach is especially useful for patients with malabsorption or for the need for rapid hormonal replacement.
Novel technologies for drug delivery and the growth of personalized medicine and AI-supported treatment optimization are significantly transforming AGS treatment. The development of inhaled and alternative AGS therapies is expected to play a role in expanding AGS therapies market as alternative AGS medications are currently being studied for their role in pathophysiology of respiratory diseases.
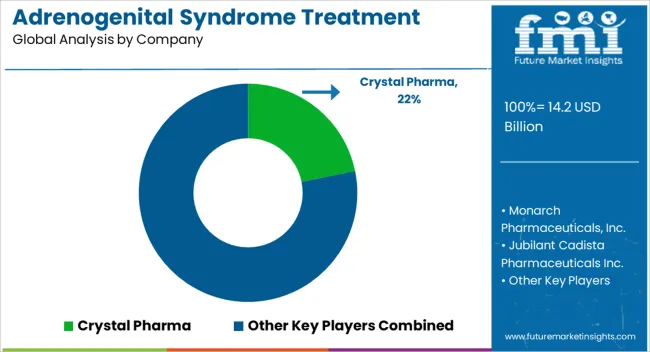
High demand for effective therapeutic treatment of the medical condition called Adrenogenital Syndrome (AGS) is anticipated to boost the market growth substantially. Rising awareness regarding the disease congenital adrenal hyperplasia (CAH) and increasing prevalence of CAH due to newly developed hormonal replacement therapies is augmenting this market.
These encompass steroid-based treatments, enzyme replacement therapies, and innovative gene therapy approaches. And build of responses that help us with the AGS market. Key players in the AGS market include pharmaceutical companies, biotechnology firms, and research organizations focused on developing targeted AGS therapies.
Market Share Analysis by Company
| Company Name | Estimated Market Share (%) |
|---|---|
| Pfizer Inc. | 18-23% |
| Novo Nordisk | 14-18% |
| Sanofi | 10-15% |
| AbbVie Inc. | 8-12% |
| Teva Pharmaceuticals | 5-9% |
| Other Manufacturers (Combined) | 30-40% |
| Company Name | Key Offerings/Activities |
|---|---|
| Pfizer Inc. | Develops steroid-based therapies and hormonal treatments for congenital adrenal hyperplasia. |
| Novo Nordisk | Specializes in advanced hormone replacement therapies and enzyme-based solutions for AGS. |
| Sanofi | Provides genetic research and corticosteroid medications for adrenal disorders. |
| AbbVie Inc. | Focuses on innovative drug formulations targeting adrenal insufficiency. |
| Teva Pharmaceuticals | Offers cost-effective generic hormone replacement solutions for AGS patients. |
Key Company Insights
Pfizer Inc. (18-23%)
Pfizer leads the Adrenogenital Syndrome treatment market with its robust pipeline of steroidal and hormonal therapies designed for long-term adrenal health.
Novo Nordisk (14-18%)
Novo Nordisk specializes in enzyme replacement therapies and hormone modulation treatments aimed at optimizing adrenal function.
Sanofi (10-15%)
Sanofi is a key player in genetic disorder treatments, offering corticosteroid-based solutions for managing AGS symptoms effectively.
AbbVie Inc. (8-12%)
AbbVie focuses on novel treatment approaches, including next-generation glucocorticoid therapies for adrenal insufficiency.
Teva Pharmaceuticals (5-9%)
Teva Pharmaceuticals provides generic and affordable hormone replacement medications for AGS patients, ensuring treatment accessibility.
Other Key Players (30-40% Combined)
Emerging companies and biotech firms are advancing AGS treatment through gene therapy research, AI-driven diagnostics, and personalized medicine approaches. These include:
The global adrenogenital syndrome treatment market is estimated to be valued at USD 14.2 billion in 2025.
The market size for the adrenogenital syndrome treatment market is projected to reach USD 24.5 billion by 2035.
The adrenogenital syndrome treatment market is expected to grow at a 5.6% CAGR between 2025 and 2035.
The key product types in adrenogenital syndrome treatment market are mineralocorticoids and glucocorticoids.
In terms of route of administration, oral segment to command 48.9% share in the adrenogenital syndrome treatment market in 2025.


Full Research Suite comprises of:
Market outlook & trends analysis
Interviews & case studies
Strategic recommendations
Vendor profiles & capabilities analysis
5-year forecasts
8 regions and 60+ country-level data splits
Market segment data splits
12 months of continuous data updates
DELIVERED AS:
PDF EXCEL ONLINE
WHIM Syndrome Management Market Insights and Analysis for 2025 to 2035
Marfan Syndrome Management Market Size and Share Forecast Outlook 2025 to 2035
Kounis Syndrome Market Size and Share Forecast Outlook 2025 to 2035
Laband Syndrome Therapeutics Market Growth - Trends & Future Innovations 2025 to 2035
Dry Eye Syndrome Treatment Market Size and Share Forecast Outlook 2025 to 2035
Donohue Syndrome Treatment Market Growth - 2025 to 2035.
Triple X Syndrome Management Market Size and Share Forecast Outlook 2025 to 2035
Barlow’s Syndrome Market Size and Share Forecast Outlook 2025 to 2035
Edward’s Syndrome Treatment Market – Growth & Future Prospects 2025 to 2035
Sjogren's Syndrome Market Size and Share Forecast Outlook 2025 to 2035
Global Takotsubo Syndrome Therapeutics Market Analysis - Size, Share & Forecast 2025 to 2035
Carcinoid Syndrome Management Market
Carcinoid Syndrome Diarrhea Treatment Market
Klinefelter Syndrome Therapeutics Market - Growth & Demand 2025 to 2035
Short sleep syndrome Treatment Market Growth & Demand 2025 to 2035
Central Pain Syndrome Management Market – Size, Share & Growth 2025 to 2035
Acrocallosal Syndrome Therapeutics Market - Trends & Future Growth 2025 to 2035
Aarskog-Scott Syndrome Treatment Market - Growth & Innovations 2025 to 2035
Andersen-Tawil Syndrome Treatment Market Trends - Growth & Future Prospects 2025 to 2035
Carcinoid Tumor Syndrome Management Market Forecast & Analysis for 2025 to 2035

Thank you!
You will receive an email from our Business Development Manager. Please be sure to check your SPAM/JUNK folder too.
Chat With
MaRIA