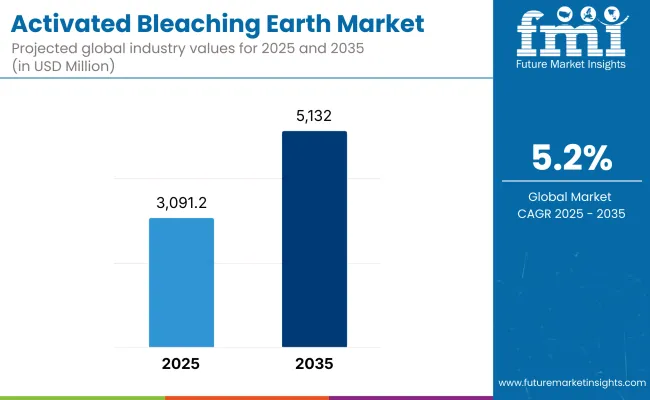
The global activated bleaching earth market is estimated to be valued at USD 3,091.2 million in 2025 and is projected to reach USD 5,132 million by 2035, reflecting a CAGR of 5.2% during the forecast period. This growth trajectory follows an upward revision from the historical CAGR of 3.5%, as applications have expanded across edible oil refining, cosmetics, pharmaceuticals, and industrial processing.
| Attributes | Key Insights |
|---|---|
| Estimated Size, 2025 | USD 3,091.2 million |
| Projected Size, 2035 | USD 5,132 million |
| Value-based CAGR (2025 to 2035) | 5.2% |
In 2024, global revenues were recorded at USD 2,938.4 million, with a projected year-on-year growth of 4.9% expected in 2025. Activated bleaching earth, a processed clay material, is being utilized to decolorize and purify oils and liquids. The material is widely used for removing pigments, odors, and trace impurities from edible oils including palm, soybean, and sunflower, thereby making the oils suitable for human consumption.
Refining operations in mineral oils, lubricants, and paraffin wax are also incorporating bleaching earth to enhance product clarity and thermal stability. In the cosmetics sector, the adoption of activated bleaching earth is being driven by its ability to meet raw material purity standards mandated under the EU REACH regulation.
The material is being used to eliminate contaminants and ensure compliance with toxicological thresholds defined by the European Chemicals Agency.Multi-functional bleaching earth products are being introduced in response to stricter quality and environmental compliance standards.
These formulations are being developed to achieve simultaneous decolorization, heavy metal removal, and odor reduction, thereby lowering the need for multiple purification steps. In edible oil refining, these advancements are reducing the use of chemical agents and supporting industry movement toward sustainable processing frameworks.
In waste oil and lubricant recycling, activated bleaching earth is being applied to recover base oils by removing oxidation by-products and suspended solids. The Asia-Pacific region, particularly India and China, continues to be the largest production and consumption hub due to the presence of major edible oil refining clusters.
The table below gives the yearly growth rates of the global Activated Bleaching Earth industry from 2025 to 2035. 2024 as the base year up to the current year 2025, the report studies how the growth curve of the sector develops from the first half of the year (January to June, H1) to the second half (July to December, H2). This analysis will provide stakeholders with a view of the industry over time, and where it may evolve.
These figures show sector growth in each half-year of the period between 2024 and 2025. The sector is expected to grow at a CAGR of 4.9% in H1-2024. In H2, the growth rate increases.
| Particular | Value CAGR |
|---|---|
| H1(2024 to 2034) | 4.9% |
| H2(2024 to 2034) | 5.2% |
| H1(2025 to 2035) | 4.9% |
| H2(2025 to 2035) | 5.4% |
Moving into the following period, between H1 2025 to H2 2025, the CAGR is expected to remain the same at 4.9% in H1 and increase relatively at 5.4% in H2. In the first half of the period (H1), the sector has no change while, in the second half of the period (H2), a rise of 20 BPS was observed.
| Segment | Value Share (2025) |
|---|---|
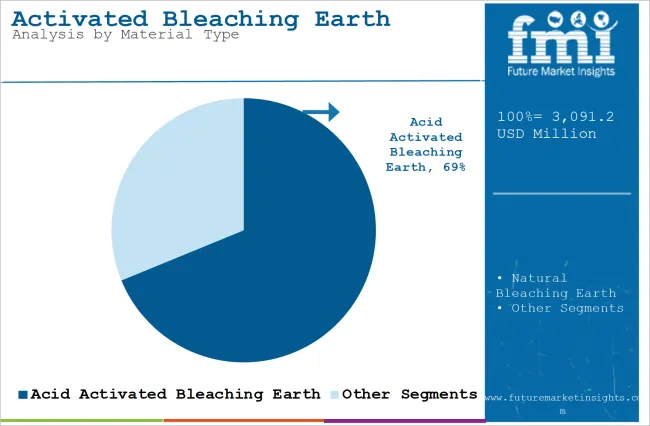
| Acid Activated Bleaching Eartd (Material Type) | 68.8% |
Acid-activated bleaching earth is estimated to account for approximately 68% of the global activated bleaching earth market share in 2025 and is projected to grow at a CAGR of 5.4% through 2035. This material undergoes chemical treatment typically with sulfuric or hydrochloric acid to significantly improve surface area and porosity, resulting in superior removal of impurities such as chlorophyll, carotenoids, and phospholipids.
The oil refining industry continues to be the largest consumer, where acid-activated bleaching clays are preferred for decolorization and purification of vegetable oils, animal fats, and biofuels. Suppliers are focusing on performance enhancement through surface modification and customized particle sizing to match specific filtration systems and feedstock types, especially across Southeast Asia, the Middle East, and Africa
| Segment | Value Share (2025) |
|---|---|
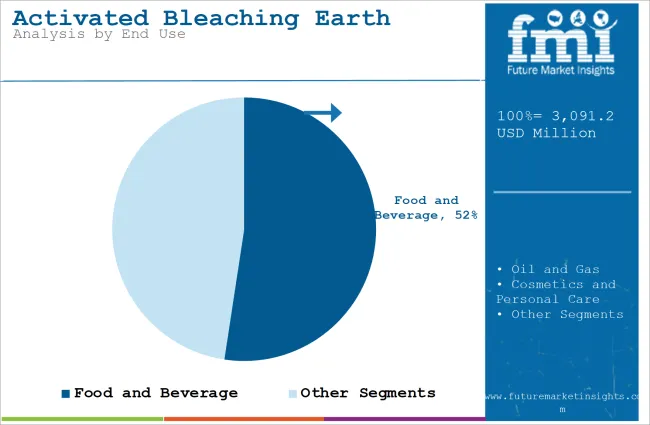
| Food and Beverage (End Use) | 52.4% |
The food and beverage segment is projected to account for approximately 52% of the global activated bleaching earth market share in 2025 and is expected to grow at a CAGR of 5.3% through 2035. Activated bleaching earth plays a vital role in refining edible oils such as palm, soybean, sunflower, and canola, helping to remove pigments, oxidation products, and trace metals.
Growth in oilseed processing capacity, particularly in India, Indonesia, and Brazil, continues to drive volume demand. Regulatory pressure to reduce contaminants like 3-MCPD and glycidyl esters is prompting refiners to adopt higher-performing bleaching agents that support both food safety and product shelf life. As consumer expectations for cleaner-label and high-quality edible oils rise, activated bleaching earth remains a critical component in the value chain of the food processing industry.
Booming Cosmetics Industry Boosts Activated Bleaching Earth Demand
Activated bleaching earth is a high-absorbing clay and finds an important application in the personal care and cosmetic industry. This product primarily helps purify raw materials, remove impurities, decolorize, and remove unwanted odors so that final products meet all the quality and safety standards required.
The purification of these raw materials ensures that high-quality skincare items like facial masks, cleansers, and lotions have their purity determining the efficacy of the product as well as customer satisfaction.
As consumer demand for clean, sustainable beauty products continues to raise the stakes for activated bleaching earth, it also sustains high demand due to greater sensitivity to product ingredients and their environmental impact. The shift has been toward product formulations with no negative chemicals and toward natural purification rather than chemical processes.
Because it is a natural, efficient adsorbent, activated bleaching earth fits perfectly into this trend, which allows manufacturers to accommodate the eco-conscious segment by using it to produce relevant products.
Increasing Demand for Specialty Oils to Drive Demand for Activated Bleaching Earth
The recent growing demand for specialty oils such as olive oil, avocado oil, and essential oils has put up a challenge requiring better filtration and decolorization systems.
The active bleaching earth is indispensable for the oil refinement process due to its excellent purifying characteristics from impurities, pigments, and unfavorable smells, yielding extremely high purity and excellent quality. Clarity and smell, for example, are imperative to meet customer needs and marketplace demands in the specialty oils business.
Specialty oils are increasingly valued for their health benefits and versatility in cooking, cosmetics, and aromatherapy, making it necessary to refine them with precision. Activated bleaching earth, being highly effective in enhancing oil quality without altering its nutritional value, has become indispensable in the production of these premium products.
For instance, olive oil consumption globally reached 3.2 million metric tons in 2021, and it continues to rise steadily. This demand has further heightened the utilization of activated bleaching earth in refining processes to meet the strict quality standards that define specialty oils. With specialty oil industries expanding globally, activated bleaching earth is well-positioned to see continued growth as an essential refining agent.
Environmental Challenges of Spent Bleaching Earth Disposal
The bleaching earth is a material that poses great environmental challenges due to its hazardous nature, which makes it hard to manage effectively. This material is usually saturated with oils and other impurities from the refining process, and therefore, requires careful handling and disposal to prevent soil and water contamination.
These concerns have led to heightened regulatory scrutiny, particularly in industries where large volumes of bleaching earth are used, limiting its widespread adoption.
Many countries now impose stricter environmental regulations, thus, compels industries to seek alternative ways of disposal or invest in recycling technologies.
Several companies already are using spent bleaching earth as by-product fuel, or input of raw material, fed into bricks or cement. While expensive and difficult, the methods remain in practice inaccessible for the vast number of small- and medium-sized businesses.
Activated Bleaching Earth Fuels Growth in Waste Oil Recycling
The growing world concern for sustainability has accelerated the development of waste oil recycling and re-refining. Activated bleaching earth plays a vital role in the removal of impurities, heavy metals, and contaminants, thus making waste oils reusable, of good quality, and useful in a variety of applications.
The outstanding adsorption capacity of this material ensures that the recycled oils comply with high-quality requirements, thus it is a vital element of the circular economy.
The rising implementation of waste oil recycling is also due to two main advantages such as environmental protection and economic efficacy. Industries related to the automotive and manufacturing segments are investing more in technologies related to activated bleaching earth that decontaminate used oils, not relying on virgin resources.
These are aligned with broader global sustainability agendas and the rapidly emerging demand for environmentally-friendly industrial approaches.
For instance, the United States produces about 1.3 billion gallons of used motor oil annually, with 60% re-refined or recycled. The large proportion of this activity that relies on activated bleaching earth underscores its crucial contribution to waste oil recycling.
As sustainability continues to shape industrial practices, the demand for this purification agent is poised to expand significantly, driving innovation in recycling technologies.
Tier 1 companies, such as Taiko Group of Companies and Oil-Dri Corp. of America, are the dominant players in the activated bleaching earth market. With annual revenues exceeding USD 300 million, these companies hold a combined value share of 30-35% globally. These industry leaders have high production capacities and extensive product portfolios, making them key influencers in the industry.
Their robust manufacturing capabilities, advanced technology, and geographically dispersed distribution networks enable this company to serve diverse sectors such as food and beverage, cosmetics, and industrial applications. Their strong geographical presence and large consumer base provide them with a strong value share base.
Tier 2 businesses include Ashapura Perfoclay Ltd. (APL), Indian Clay & Mineral Co., EP Minerals, and AMC (UK) Ltd. These medium-sized businesses possess revenues between 50 million dollars and 300 million dollars in revenue.
However, they garner a value share of 10-15%, and they stand strong in regions. Though it is not likely to be strong enough to create a global reputation like Tier 1 businesses, tier 2 does contribute to business.
Their focus is often on offering specialized products and services tailored to regional demands. These companies are known for their industry expertise and strong technology capabilities, which allow them to cater to specific niches, such as the food processing and pharmaceutical sectors.
Tier 3 consists of smaller players like The W Clay Industries, HRP Industries, Manek Active Clay Pvt. Ltd., and Zeotec Adsorbents Private Ltd. with revenues below USD 50 million. They primarily cater to regional industries and specialized needs, accounting for 45-50% of the value share.
They are more localized and have less formalized operations compared to the big players, and their market contributions remain highly specialized and niche. Though they don't compete globally, they do play a significant role in the overall market landscape.
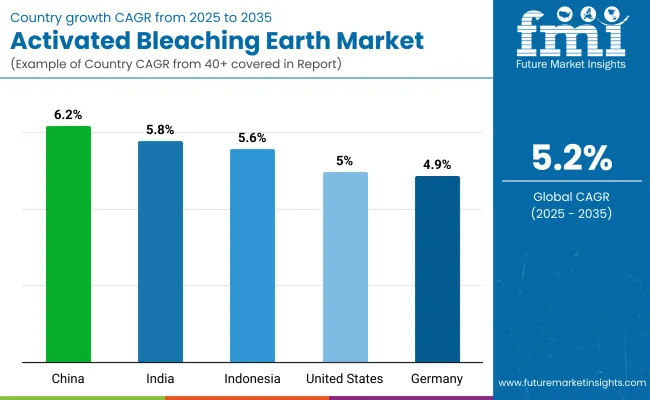
The section below highlights assessments of activated bleaching earth sales across key countries. The USA, China, Indonesia, India, and Germany are expected to showcase promising significant growth, with each exhibiting a strong CAGR through the forecast period.
| Countries | Value CAGR (2025 to 2035) |
|---|---|
| China | 6.2% |
| India | 5.8% |
| Indonesia | 5.6% |
| United States | 5.0% |
| Germany | 4.9% |
The increasing edible oil production capacity of China greatly elevates the demand for activated bleaching earth. As a global leader both in terms of production and consumption of edible oils such as soybean, palm, and rapeseed, the country hugely depends on better refining processes so that the desired quality and quality standards are followed.
Activated bleaching earth, which is much superior to most other earth varieties in removing impurities, decolorizing, and purifying oils, can be seen contributing significantly to producing quality-refined oil.
Government policies encouraging in-country oil production and local content have helped further boost industry growth. China's 14th Five-Year Plan focuses on agricultural modernization and enhancing local crop production for food security enhancement and minimizing dependence on imports.
This program, focuses on strategies related to the production of oil crops, directly enhancing demand for good refining agents, such as activated bleaching earth. In addition, China's food safety regulation ensures that edible oil-producing companies maintain the highest standards of refining, thereby driving this industry further.
With a compound annual growth rate (CAGR) of 6.2%, the activated bleaching earth market in China is projected to reach a valuation of USD 1,560.1 million by 2035, cementing the country’s position as a global leader in this industry.
India's activated bleaching earth sales are growing in sync with the export-oriented oil-refining policy in the country. An exporter of high-quality refined oils such as palm and groundnut oils, the country requires premium refining agents to meet international standards to maintain the purity, clarity, and shelf life of oils. Therefore, activated bleaching earth has turned out to be a critical commodity in export-oriented refinery processes.
The value-added exports and modernization in the oil processing industry by the government have increased the demand for activated bleaching earth. For example, initiatives like the Agriculture Export Policy are focused on enhancing the quality and competitiveness of processed food and oil products to reach an agricultural export revenue of USD 60 billion by 2025.
Further, the growing penetration of small and medium-sized oil refining units in rural areas has raised the demand for cost-effective and efficient bleaching earth solutions, thereby boosting regional growth.
With a projected compound annual growth rate of 5.8%, the activated bleaching earth industry in India is expected to reach USD 231.2 million by 2035. This growth is aligned with India's expanding role in the global edible oil trade, where stringent quality benchmarks are key to maintaining export competitiveness.
As India continuously improves its refineries and advanced purification technologies are used, the country will continue relying on the activated bleaching earth market in terms of economic and industrial development.
The steady demand for USA-activated bleaching earth continues to drive upwardly consistent growth. USA government attention to renewable fuels, green environmental conservation efforts, and emphasis on renewable sources have significantly promoted increased demand for renewable refining agents in the form of activated bleaching earth in oils and fats refined for the growing biodiesel demand under the renewable fuel standards mandate from the country, which pursues ambitious targets with sustainability at the center.
The Renewable Fuel Standard, administered by the USA Environmental Protection Agency, requires the blending of renewable fuels such as biodiesel into the country's transportation fuel supply. USA biodiesel production hit around 1.8 billion gallons in 2022, demonstrating the increasing importance of sustainable energy solutions.
High-purity refining agents, such as activated bleaching earth, are vital to the achievement of the necessary quality standards for biodiesel in accordance with regulations and market requirements.
With a compound annual growth rate of 5.0%,the USA demand for activated bleaching earth is expected to reach USD 585.2 million by 2035, thereby leaving its mark on the sustainable refining and high-value product manufacturing industry.
This growth is owing to the commitment of the USA towards environment-friendly industrial practices and the ongoing demand for innovative refining technology.
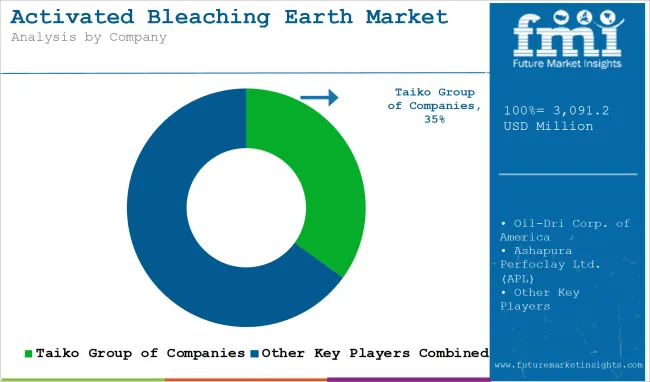
The activated bleaching earth market is moderately fragmented, with several established players competing alongside regional manufacturers. High entry barriers, such as significant capital investment for production facilities and compliance with environmental regulations, limit new entrants. Expertise in mineral processing and adherence to strict quality standards are crucial for players to remain competitive.
The market is highly competitive, driven by demand for cost-effective, high-performance products across the food, cosmetic, and petroleum industries. Companies are focusing on innovation, developing sustainable, eco-friendly solutions, and expanding production capacities to cater to rising global demand.
Strategic collaborations and acquisitions are being pursued to strengthen market presence and improve product offerings. Regulatory pressures on environmental impact are prompting companies to invest in cleaner technologies and green production methods for long-term growth.
In terms of Material Type, the industry is divided into Natural Bleaching Earth and Acid-activated Bleaching Earth.
In terms of End-Use, the industry is divided into Food and Beverage, Oil and Gas, Cosmetics and Personal Care, Chemical Processing, Pharmaceuticals, and Others.
The report covers key regions, including North America, Latin America, Western Europe, Eastern Europe, East Asia, South Asia, and the Middle East and Africa (MEA).
The sales were valued at USD 2,938.4 million in 2024.
The market is expected to reach USD 5,132 million by 2035.
Food and Beverages are anticipated to dominate due to high consumption in emerging economies.
Increasing demand for refined oils, industrial applications, and sustainable practices are key drivers.
China is projected to grow at the highest CAGR of 6.2% during the forecast period.


Full Research Suite comprises of:
Market outlook & trends analysis
Interviews & case studies
Strategic recommendations
Vendor profiles & capabilities analysis
5-year forecasts
8 regions and 60+ country-level data splits
Market segment data splits
12 months of continuous data updates
DELIVERED AS:
PDF EXCEL ONLINE
Activated Alumina Market Size and Share Forecast Outlook 2025 to 2035
Activated Carbon Fiber Market Size and Share Forecast Outlook 2025 to 2035
Activated Cake Emulsifier Market Size and Share Forecast Outlook 2025 to 2035
Activated Carbon Bags Market Size and Share Forecast Outlook 2025 to 2035
Activated Carbon Filter Market Growth - Trends & Forecast 2025 to 2035
Assessing Activated Carbon Market Share & Industry Trends
Market Share Breakdown of Activated Cake Emulsifier Suppliers
Activated Partial Thromboplastin Test Market
Activated Charcoal Supplements Market Trends - Sales & Industry Insights
Heat-Activated Beauty Masks Market Analysis - Size, Share, and Forecast Outlook 2025 to 2035
Wood Activated Carbon Market Size and Share Forecast Outlook 2025 to 2035
Heat Activated Tear Tape Market
Light-Activated Anti-Pollution Skincare Market Analysis - Size and Share Forecast Outlook 2025 to 2035
Water Activated Tape Dispensers Market Size and Share Forecast Outlook 2025 to 2035
Market Share Breakdown of Water Activated Tape Dispensers
Water-Activated Tape Market Trends & Industry Forecast 2024-2034
Pelletized Activated Carbon Market Analysis - Size & Industry Trends 2025 to 2035
Food Grade Activated Carbon Market Report - Applications & Growth 2025 to 2035
Fluorescence-Activated Cell Sorting Market Size and Share Forecast Outlook 2025 to 2035
13X Molecular Sieve Activated Powder Market Size and Share Forecast Outlook 2025 to 2035

Thank you!
You will receive an email from our Business Development Manager. Please be sure to check your SPAM/JUNK folder too.
Chat With
MaRIA