Activated Alumina Market Size and Share Forecast Outlook 2025 to 2035

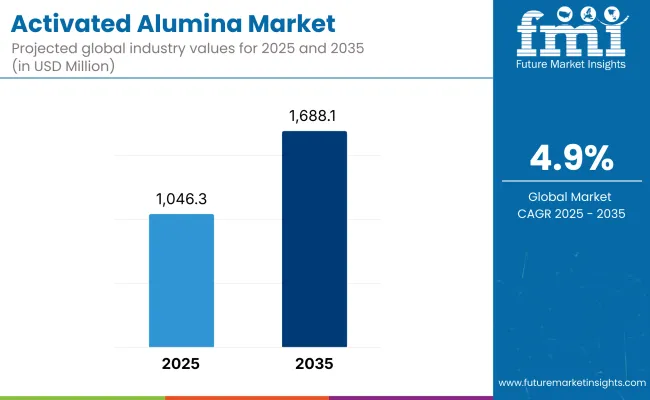
The activated alumina market stands at the threshold of a decade-long expansion trajectory that promises to reshape industrial desiccant technology and adsorbent material solutions. The market's journey from USD 1,046.3 million in 2025 to USD 1,688.2 million by 2035 represents substantial growth, demonstrating the accelerating adoption of advanced filtration technology and purification optimization across petrochemical facilities, water treatment operations, and industrial gas processing sectors.

The first half of the decade (2025-2030) will witness the market climbing from USD 1,046.3 million to approximately USD 1,330 million, adding USD 283.7 million in value, which constitutes 44% of the total forecast growth period. This phase will be characterized by the rapid adoption of high-purity activated alumina grades, driven by increasing industrial production volumes and the growing need for advanced moisture removal and contaminant adsorption solutions worldwide. Enhanced adsorption capabilities and regeneration efficiency systems will become standard expectations rather than premium options.

The latter half (2030-2035) will witness continued growth from USD 1,330 million to USD 1,688.2 million, representing an addition of USD 358.2 million or 56% of the decade's expansion. This period will be defined by mass market penetration of specialized activated alumina formulations, integration with comprehensive process optimization platforms, and seamless compatibility with existing industrial infrastructure. The market trajectory signals fundamental shifts in how industrial facilities approach purification processes and quality management, with participants positioned to benefit from growing demand across multiple particle size configurations and end-use segments.
Quick Stats for Activated Alumina Market

  • Activated Alumina Market Value (2025): USD 1,046.3 million
  • Activated Alumina Market Forecast Value (2035): USD 1,688.2 million
  • Activated Alumina Market Forecast CAGR: 4.90%
  • Leading Particle Size in Activated Alumina Market: 0.5-2 mm Particle Size Range
  • Key Growth Regions in Activated Alumina Market: Asia Pacific, North America, and Europe
  • Top Key Players in Activated Alumina Market: BASF SE, Honeywell International Inc., Axens S.A., Sumitomo Chemical Co. Ltd., Porocel Industries LLC (Evonik)

Activated Alumina Market

Where Revenue Comes From - Now vs Next (Industry-Level View)

Period Primary Revenue Buckets Share Notes
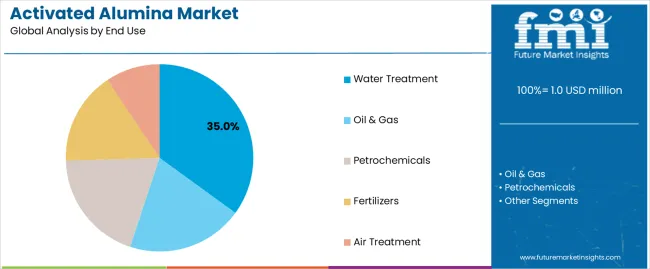
Today Water treatment desiccants 35% Municipal and industrial applications
Oil & gas purification 25% Natural gas dehydration, catalyst support
Petrochemical processing 20% Feedstock purification, process optimization
Air treatment & drying 12% Compressed air systems, industrial drying
Fertilizer production support 8% Hydrogen peroxide stabilization
Future (3-5 yrs) Advanced water purification 30-35% Fluoride removal, arsenic treatment, emerging contaminants
Natural gas processing 22-28% LNG expansion, offshore applications
Petrochemical catalysis 18-22% Catalyst carriers, specialty adsorbents
Air separation & treatment 12-16% Industrial gas production, compressed air quality
Specialty applications 8-12% Pharmaceutical grade, electronics manufacturing
Regeneration & recycling services 3-6% Circular economy, sustainability focus

Market Key Takeaways

Metric Value
Market Value (2025) USD 1,046.3 million
Market Forecast (2035) USD 1,688.2 million
Growth Rate 4.90% CAGR
Leading Particle Size 0.5-2 mm Granular Range
Primary Application Water Treatment Segment

The market demonstrates strong fundamentals with 0.5-2 mm particle size capturing a dominant share through optimal adsorption efficiency and broad application versatility. Water treatment applications drive primary demand, supported by increasing water scarcity concerns and stringent quality regulations. Geographic expansion remains concentrated in industrialized markets with established chemical processing infrastructure, while emerging economies show accelerating adoption rates driven by industrial expansion initiatives and rising environmental standards.

Imperatives for Stakeholders in Activated Alumina Market

Design for Performance and Regenerability

  • Offer comprehensive technical packages: product specifications + performance validation + regeneration protocols + application engineering + technical support
  • Preconfigured application solutions: adsorption capacity curves, breakthrough analysis, regeneration procedures, and documented performance data for specific applications

Sustainability and Circular Economy Focus

  • Regeneration optimization services, spent material recycling capabilities, and lifecycle cost analysis (total cost of ownership, environmental impact assessment)
  • Closed-loop systems integration and sourcing documentation

Application-Specific Customization

  • Tailored particle size distributions, specialized surface treatments, contaminant-specific formulations, and documented regulatory compliance
  • Integration with existing process equipment and performance guarantee programs

Value-Based Commercial Models

  • Clear product pricing + transparent service tiers (technical support, performance monitoring, regeneration services)
  • Long-term supply agreements with volume-based pricing and technical partnership programs

Segmental Analysis

Primary Classification

The market segments by particle size into powder, 0.5-2 mm, 2-5 mm, 5-10 mm ranges, representing the evolution from fine adsorbent powders to coarse granular materials for comprehensive industrial application optimization across diverse process conditions.

Secondary Classification

End-use segmentation divides the market into water treatment, oil & gas, petrochemicals, fertilizers, and air treatment sectors, reflecting distinct requirements for adsorption capacity, mechanical strength, and regeneration characteristics specific to each industrial application.

Tertiary Classification

Geographic segmentation covers major producing and consuming regions including Asia Pacific (China, India, Japan), North America (United States, Canada), Europe (Germany, United Kingdom, France), and emerging markets in Middle East, Latin America, and Africa.

The segmentation structure reveals technology progression from general-purpose adsorbents toward specialized formulations with enhanced performance characteristics, while application diversity spans from municipal water treatment to sophisticated petrochemical processing requiring precise adsorption and catalyst support solutions.
By Particle Size, the 0.5-2 mm Segment Accounts for Dominant Market Share

Activated Alumina Market Analysis By Particle Size

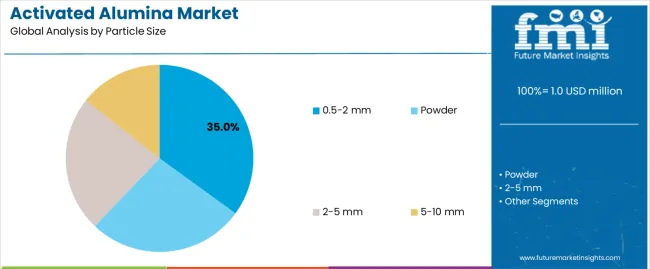
Market Position: The 0.5-2 mm particle size range commands the leading position in the activated alumina market with approximately 35% market share through optimal balance of adsorption kinetics, pressure drop characteristics, and mechanical durability that enable industrial facilities to achieve superior performance across diverse water treatment, gas processing, and industrial drying applications.

Value Drivers: The segment benefits from industrial preference for granular adsorbents that provide rapid adsorption rates, acceptable pressure drop, and excellent bed stability without requiring specialized handling equipment or complex regeneration systems. The optimal particle size enables efficient mass transfer, uniform flow distribution, and reliable long-term performance, where mechanical strength and regeneration durability represent critical operational requirements.

Competitive Advantages: The 0.5-2 mm particle size range differentiates through proven industrial reliability, extensive application data, and compatibility with standard process equipment that enhance facility effectiveness while maintaining optimal adsorption capacity suitable for diverse industrial and municipal applications.

Key market characteristics:

  • Optimal adsorption designs with balanced kinetics and pressure drop characteristics for process efficiency
  • Enhanced removal effectiveness, enabling 85-95% contaminant removal with consistent regeneration performance
  • Industrial compatibility, including standard equipment integration, established protocols, and process optimization for multiple applications

Powder Formulations Show Specialized Application Growth

Powder activated alumina maintains approximately 20% market position due to specialized requirements in catalyst manufacturing, pharmaceutical applications, and chemical synthesis where high surface area and rapid dissolution characteristics provide distinct advantages. Market growth is driven by specialty chemical expansion and advanced material applications requiring ultra-fine particle distributions.

2-5 mm Granular Range Demonstrates Balanced Performance

The 2-5 mm particle size segment captures approximately 25% market share through balanced characteristics suitable for high-flow applications, compressed air drying, and industrial gas treatment where moderate pressure drop and excellent mechanical strength represent primary selection criteria for long-term operational reliability.

5-10 mm Coarse Granular Applications Serve Heavy-Duty Operations

The 5-10 mm particle size range accounts for approximately 15% market share, serving applications requiring minimal pressure drop, such as bulk gas drying towers, atmospheric driers, and applications where extended bed life and minimal attrition outweigh slower adsorption kinetics considerations.

Other Particle Size Ranges Maintain Niche Positions

Specialized particle size ranges including ultra-fine powders and extra-coarse granules serve specific niche applications requiring customized performance characteristics for unique process conditions or specialized equipment configurations.
By End-Use, Water Treatment Segment Shows Fastest Growth

Activated Alumina Market Analysis By End Use

Market Context: Water treatment applications demonstrate the highest growth rate in the activated alumina market with 5.8% CAGR due to escalating water quality concerns, expanding fluoride removal programs, and increasing adoption of arsenic mitigation systems in municipal and industrial water treatment facilities globally.

Appeal Factors: Water treatment operators prioritize adsorbent effectiveness, regeneration economics, and regulatory compliance capabilities that enable safe drinking water delivery across diverse source water conditions. The segment benefits from substantial municipal investment and water infrastructure modernization programs that emphasize acquisition of reliable fluoride and arsenic removal technologies for public health protection.

Growth Drivers: Government water quality regulations mandate fluoride levels below 1.5 mg/L and arsenic below 10 ppb, creating sustained demand for activated alumina systems in affected regions. Population growth in fluoride-endemic areas and legacy contamination remediation programs drive continued market expansion for water treatment applications.

Application dynamics include:

  • Strong growth in municipal water systems and community water supplies requiring fluoride and arsenic removal
  • Increasing adoption in industrial water pretreatment for electronics, pharmaceutical, and food processing applications
  • Rising integration with automated regeneration systems for operational efficiency and waste minimization

Oil & Gas Segment Maintains Strong Industrial Demand

Oil & Gas applications capture approximately 25% market share through critical roles in natural gas dehydration, natural gas liquids recovery, and petrochemical feedstock purification. The segment demonstrates steady growth driven by LNG expansion projects, offshore gas development, and quality specifications for pipeline-grade natural gas requiring moisture removal to prevent hydrate formation and pipeline corrosion.

Market Intelligence Brief:

  • Natural gas processing facilities representing 65% of oil & gas segment consumption
  • LNG export terminal expansion driving demand for high-capacity dehydration systems
  • Subsea and offshore applications requiring specialized, high-durability formulations
  • Catalyst support applications in hydroprocessing and reforming operations

Petrochemicals Segment Shows Process Optimization Leadership

Market Position: Petrochemical applications account for approximately 20% market share, serving critical roles in olefin production, aromatics purification, and specialty chemical manufacturing where trace contaminant removal impacts product quality and catalyst performance.

Value Drivers: Petrochemical facilities require activated alumina for hydrogen peroxide production, chlorine drying, and feedstock purification where even trace moisture or acid gases can compromise product specifications or downstream catalyst systems. The segment emphasizes high purity grades, consistent performance, and documented quality control.

Growth Characteristics: Market expansion follows petrochemical capacity additions in Asia Pacific and Middle East, where integrated refinery-petrochemical complexes incorporate activated alumina as standard equipment for process optimization and product quality assurance.

Fertilizers Segment Demonstrates Specialized Growth

Fertilizers applications capture approximately 8% market share through specialized use in hydrogen peroxide stabilization for phosphate fertilizer production and ammonia synthesis gas purification. The segment shows moderate growth aligned with global fertilizer production capacity and agricultural demand patterns.

Air Treatment Applications Maintain Steady Industrial Demand

Air Treatment applications account for approximately 12% market share, including compressed air drying for manufacturing operations, breathing air purification, and industrial pneumatic systems where moisture control prevents equipment corrosion and ensures operational reliability across diverse industrial sectors.

By Region, Asia Pacific Leads Market Growth

Market Context: Asia Pacific dominates the activated alumina market with fastest CAGR, driven by rapid industrialization, expanding petrochemical capacity, and growing water treatment infrastructure across China, India, and Southeast Asian nations requiring comprehensive adsorbent solutions for industrial and municipal applications.

Business Model Advantages: The region provides largest consumption volumes for petrochemical processing, natural gas development, and water treatment programs, driving sustained demand for activated alumina while supporting domestic manufacturing capacity expansion and technology localization initiatives.

Operational Benefits: Asia Pacific markets benefit from proximity to raw material sources, established chemical manufacturing infrastructure, and growing end-use industries that create integrated value chains and competitive manufacturing economics for activated alumina production and distribution.

What are the Drivers, Restraints, and Key Trends?

Category Factor Impact Why It Matters
Driver Water quality regulations & fluoride/arsenic removal mandates ★★★★★ Government regulations create non-discretionary demand; compliance-driven purchases provide stable long-term growth foundation
Driver Natural gas production & LNG expansion (dehydration requirements) ★★★★★ Energy transition drives natural gas as bridge fuel; LNG export growth requires extensive dehydration capacity creating sustained industrial demand
Driver Petrochemical capacity expansion (especially Asia Pacific & Middle East) ★★★★☆ New petrochemical complexes incorporate activated alumina as standard; capacity additions directly translate to market growth
Restraint Price volatility of alumina feedstock & energy costs ★★★★☆ Alumina raw material costs impact margins; energy-intensive calcination process creates cost sensitivity to utility prices
Restraint Competition from alternative adsorbents (molecular sieves, silica gel) ★★★☆☆ Alternative technologies offer advantages in specific applications; must demonstrate superior cost-performance for market retention
Restraint Regeneration complexity & disposal regulations ★★★☆☆ Spent adsorbent handling requires compliance; regeneration infrastructure needs limit adoption in small facilities
Trend Circular economy & adsorbent regeneration/recycling ★★★★★ Sustainability focus drives demand for regenerable systems; vendors offering regeneration services gain competitive advantage
Trend Customized formulations & application-specific products ★★★★☆ Generic adsorbents commoditizing; differentiation through specialized grades for specific contaminants or process conditions
Trend Integration with smart monitoring & predictive maintenance ★★★★☆ IoT sensors enable real-time performance tracking; predictive replacement scheduling optimizes costs and prevents breakthrough failures

Analysis of the Activated Alumina Market by Key Country

Activated Alumina Market Cagr Analysis By Country

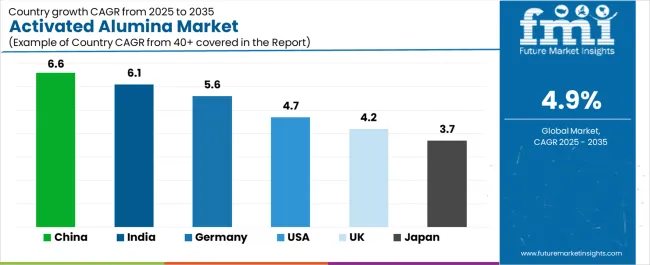
The activated alumina market demonstrates varied regional dynamics, with Growth Leaders including China (6.6% CAGR) and India (6.1% CAGR), driven by strong adoption in water treatment, petrochemical processing, and industrial adsorption systems. Steady Performers include the United States (4.7% CAGR) and Germany (5.6% CAGR), where demand is shaped by advanced refining industries, catalytic applications, and environmental compliance requirements. Emerging Markets such as the UK (4.2% CAGR) and Japan (3.7% CAGR) show consistent progress, supported by niche demand in high-purity applications, electronics, and specialty chemicals.

Regional synthesis highlights Asia-Pacific as the leading region, anchored by industrial infrastructure growth, water purification initiatives, and petrochemical sector expansion. North America shows steady performance, supported by oil & gas and environmental applications, while Europe maintains moderate growth with a focus on sustainability, regulatory compliance, and specialty applications.

Region/Country 2025–2035 Growth How to Win What to Watch Out
India 6.1% Focus on affordable, scalable adsorption solutions for water treatment Price sensitivity; fragmented distribution
China 6.6% Leverage large-scale industrial demand and water treatment programs Environmental regulations; quality consistency
United States 4.7% Provide advanced purification and catalytic-grade solutions Stringent EPA standards; high operating costs
Germany 5.6% Offer premium high-purity alumina for industrial & specialty chemicals Over-engineering risk; long validation cycles
UK 4.2% Push niche markets in electronics and environmental services Brexit trade disruptions; smaller domestic demand
Japan 3.7% Target precision applications in semiconductors and specialty adsorbents Slow industrial growth; high import reliance

China Leads Global Market Expansion

China demonstrates the strongest growth potential in the Activated Alumina Market with a CAGR of 6.6% through 2035, supported by rapid industrial infrastructure expansion, large-scale adoption in water treatment, and petrochemical processing demand. Growth is concentrated in Shandong, Jiangsu, and Guangdong, where petrochemical complexes and municipal water projects require high-capacity adsorption and purification systems. The government’s clean water initiatives and environmental compliance programs have accelerated the replacement of conventional adsorbents with activated alumina in municipal and industrial applications.

Chinese manufacturers dominate domestic supply with cost-effective products tailored to local industries, while global players focus on high-purity grades for specialty chemical and electronics markets. Exports to Southeast Asia are rising as Chinese producers leverage economies of scale and competitive pricing.

Strategic Market Indicators:

  • Water treatment sector accounts for 58% of domestic demand.
  • Government-backed environmental policies driving municipal water projects.
  • Local manufacturers secure 65% market share with low-cost production.
  • Growing exports targeting Southeast Asia and Middle East feedwater markets.

India Drives High-Growth Market Potential

India records a 6.1% CAGR through 2035, anchored by demand from water purification, refinery desulfurization, and gas drying applications. Growth is concentrated in Gujarat, Maharashtra, and Tamil Nadu, where expanding petrochemical and refinery operations drive activated alumina consumption. India’s water scarcity challenges are prompting widespread use of activated alumina in arsenic and fluoride removal systems, particularly in municipal and rural water treatment programs.

Indian manufacturers are increasingly producing cost-competitive grades tailored for water treatment, while international suppliers penetrate high-purity applications such as catalysts, healthcare, and electronics. Government investments in water treatment and industrial modernization programs, combined with private sector participation, ensure sustained adoption.

Strategic Market Indicators:
  • Water treatment applications driving 52% of demand growth.
  • Government programs funding arsenic and fluoride removal projects.
  • Local producers capturing 40% share through low-cost adsorbents.
  • Export opportunities growing in South Asia and Africa for low-cost solutions.

Germany Strengthens Europe’s Specialty Market

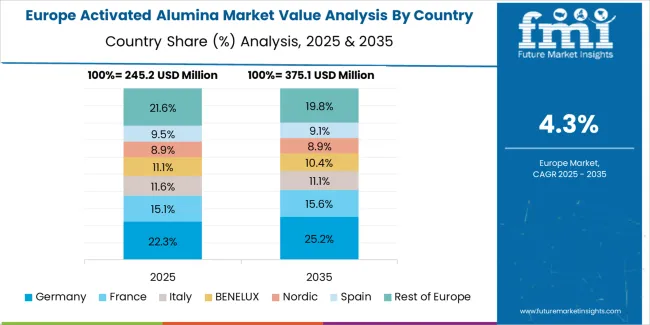
Activated Alumina Market Europe Country Market Share Analysis, 2025 & 2035

Germany posts a 5.6% CAGR through 2035, reflecting its focus on high-purity activated alumina for specialty chemicals, environmental compliance, and catalytic applications. Growth is centered in North Rhine-Westphalia, Bavaria, and Hamburg, where advanced chemical clusters integrate activated alumina into refining, petrochemical, and wastewater treatment processes. EU sustainability regulations are pushing industries to adopt cleaner adsorbents and catalysts, supporting steady demand.

German manufacturers prioritize premium quality, certified performance, and advanced formulations for industries requiring stringent specifications, such as automotive, electronics, and environmental services. Imports from Asia fill lower-grade demand, while domestic producers focus on specialty niches.

Strategic Market Indicators:

  • Specialty chemicals and refining account for 61% of demand.
  • EU mandates drive sustainability-oriented adoption.
  • Premium products secure Germany’s regional leadership in Europe.
  • High reliance on imports for low-cost grades.

United States Demonstrates Stable Growth

The USA Activated Alumina Market expands at a 4.7% CAGR through 2035, supported by applications in oil & gas refining, water treatment, and air/gas drying. Demand is concentrated in Texas, Louisiana, and California, where refinery complexes and petrochemical facilities rely on activated alumina for desulfurization and gas purification. Rising EPA regulations on water quality and industrial emissions are further pushing adoption in municipal and industrial water treatment.

Domestic producers lead supply with catalyst-grade and specialty alumina, while imports from Asia address price-sensitive applications. Advanced processing technologies and integration with refinery catalyst systems maintain steady market demand.

Strategic Market Indicators:

  • Oil & gas refining accounts for 55% of USA demand.
  • EPA compliance creating sustained water treatment applications.
  • Domestic players capture 68% share, with strong exports to Latin America.
  • Price competition from Asian imports in low-cost industrial segments.

United Kingdom Shows Steady Niche Demand

The UK grows at a 4.2% CAGR through 2035, supported by niche demand in environmental services, gas drying, and specialty chemical applications. Market growth is concentrated in London, Manchester, and Teesside, where industrial clusters and municipal water projects integrate activated alumina into treatment systems. Post-Brexit trade dynamics have reshaped supply chains, leading to higher reliance on imports from EU and Asian producers.

UK adoption focuses on specialized applications such as electronics, laboratory chemicals, and small-scale water treatment solutions, where quality and compliance are prioritized. Growth remains moderate compared to larger European markets but provides consistent opportunities in targeted segments.

Strategic Market Indicators:
  • Environmental services and gas drying drive 46% of demand.
  • Post-Brexit import dependency reshaping supply chains.
  • Niche applications in electronics and laboratories sustain steady adoption.
  • Domestic market remains fragmented and small-scale.

Japan Anchors Market with Specialty Applications

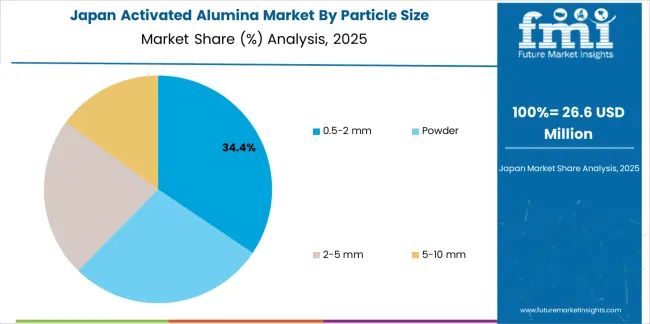
Activated Alumina Market Japan Market Share Analysis By Particle Size

Japan posts a 3.7% CAGR through 2035, reflecting conservative but stable demand for activated alumina in electronics, healthcare, and precision industrial applications. Growth is concentrated in Tokyo, Osaka, and Nagoya, where advanced industries require high-purity adsorbents and specialty formulations. Japan’s limited domestic resources create strong reliance on imports, particularly from China and Southeast Asia.

Japanese consumers and industrial users demand premium, high-reliability products with strict quality control, making the market favorable for global suppliers offering certified grades. While growth is modest compared to emerging Asian markets, Japan’s role as a high-value specialty market ensures consistent opportunities for suppliers targeting electronics, catalysts, and high-purity chemical applications.

Strategic Market Indicators:
  • Specialty applications (electronics & healthcare) drive 62% of demand.
  • Strong import reliance for feedstocks and final products.
  • Premium demand supports higher pricing power for certified suppliers.
  • Growth constrained by slow industrial expansion.

Competitive Landscape

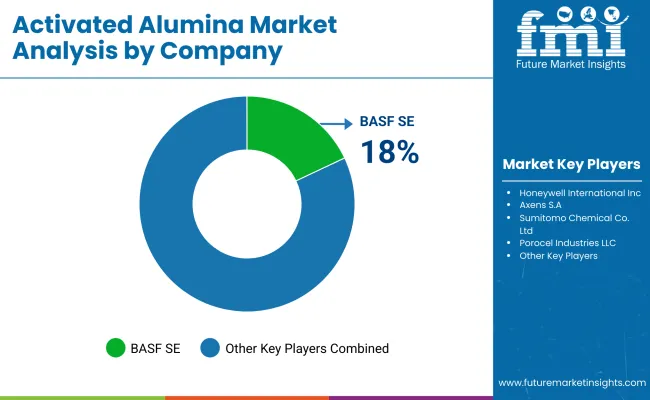
Activated Alumina Market By Company

  • Structure: 20-30 credible players globally; top 5-7 hold 60-70% by revenue
  • Leadership is maintained through: global production footprint, technical expertise, and application development (customized formulations + process integration + regeneration services)
  • What's commoditizing: standard grade 0.5-2 mm products and basic water treatment adsorbents
  • Margin Opportunities: specialty formulations, technical service packages, and regeneration/recycling services
Stakeholder What they actually control Typical strengths Typical blind spots
Integrated chemical majors Captive alumina supply, global distribution, R&D capabilities Raw material security, technical resources, customer relationships Agility; customization speed
Specialty adsorbent suppliers Customized formulations, application expertise, niche markets Technical differentiation, responsive service, premium positioning Production scale; cost competitiveness
Regional producers Local market access, competitive pricing, quick delivery Proximity advantages, pricing flexibility, regional knowledge Technology gaps; global reach limitations
Technology innovators Novel activation methods, specialized treatments, IP protection Performance differentiation, premium pricing, patent protection Manufacturing scale; market access
Toll manufacturers Flexible production, customer formulations, private labeling Manufacturing efficiency, no sales competition with customers Brand recognition; end-user relationships

Key Players in Activated Alumina Market

  • BASF SE
  • Honeywell International Inc.
  • Axens S.A.
  • Sumitomo Chemical Co., Ltd.
  • Porocel Industries LLC (Evonik)
  • Chalco Shandong Advanced Material Co., Ltd.
  • Huber Corporation
  • Chemviron Carbon
  • Dynamic Adsorbents Inc.
  • Activated Alumina Spheres
  • Sorbead India
  • Jacobi Carbons Group
  • AGC Chemicals
  • Filtration Group
  • Jiangxi Zhongyu New Material Co., Ltd.

Scope of the Report

Item Value
Quantitative Units USD million
Particle Size Powder, 0.5-2 mm, 2-5 mm, 5-10 mm
End Use Water Treatment, Oil & Gas, Petrochemicals, Fertilizers, Air Treatment
Regions Covered Asia Pacific, North America, Europe, Middle East, Latin America, Africa
Countries Covered China, India, United States, Germany, United Kingdom, Japan, France, South Korea, Canada, Australia, Saudi Arabia, UAE, Brazil, Mexico, and 20+ additional countries
Key Companies Profiled BASF SE, Honeywell International Inc., Axens S.A., Sumitomo Chemical Co. Ltd., Porocel Industries LLC (Evonik), Chalco Shandong Advanced Material, Huber Corporation, Chemviron Carbon, Dynamic Adsorbents Inc., Activated Alumina Spheres
Additional Attributes Revenue analysis by particle size and end-use categories, regional consumption patterns across Asia Pacific, North America, and Europe, competitive landscape with chemical majors and specialty adsorbent suppliers, industrial operator preferences for adsorption capacity and regeneration economics, integration with process equipment and monitoring systems, innovations in formulation technology and surface treatment methods, development of regeneration practices with circular economy principles and environmental compliance capabilities

Market Segmentation

Particle Size

  • Powder
  • 0.5-2 mm
  • 2-5 mm
  • 5-10 mm

End Use

  • Water Treatment
    • Municipal Drinking Water
    • Industrial Water Purification
    • Fluoride Removal
    • Arsenic Removal
    • Wastewater Treatment
  • Oil & Gas
    • Natural Gas Dehydration
    • NGL Recovery
    • LNG Processing
    • Offshore Applications
    • Catalyst Support
  • Petrochemicals
    • Olefin Production
    • Aromatics Purification
    • Hydrogen Peroxide Stabilization
    • Specialty Chemicals
    • Feedstock Purification
  • Fertilizers
    • Phosphate Production
    • Ammonia Synthesis
    • Hydrogen Peroxide Applications
  • Air Treatment
    • Compressed Air Drying
    • Industrial Gas Production
    • Breathing Air Purification
    • Pneumatic Systems

Region

  • Asia Pacific
    • China
    • India
    • Japan
    • South Korea
    • ASEAN Countries
    • Australia & New Zealand
  • North America
    • United States
    • Canada
    • Mexico
  • Europe
    • Germany
    • United Kingdom
    • France
    • Italy
    • Spain
    • Netherlands
    • Belgium
    • Rest of Europe
  • Middle East
    • Saudi Arabia
    • United Arab Emirates
    • Qatar
    • Kuwait
    • Other GCC Countries
  • Latin America
    • Brazil
    • Argentina
    • Chile
    • Rest of Latin America
  • Africa
    • South Africa
    • Egypt
    • Nigeria
    • Rest of Africa

Frequently Asked Questions

How big is the activated alumina market in 2025?

The global activated alumina market is estimated to be valued at USD 1.0 billion in 2025.

What will be the size of activated alumina market in 2035?

The market size for the activated alumina market is projected to reach USD 1.7 billion by 2035.

How much will be the activated alumina market growth between 2025 and 2035?

The activated alumina market is expected to grow at a 4.9% CAGR between 2025 and 2035.

What are the key product types in the activated alumina market?

The key product types in activated alumina market are 0.5-2 mm, powder, 2-5 mm and 5-10 mm.

Which end use segment to contribute significant share in the activated alumina market in 2025?

In terms of end use, water treatment segment to command 35.0% share in the activated alumina market in 2025.

Table of Content

  1. Executive Summary
    • Global Market Outlook
    • Demand to side Trends
    • Supply to side Trends
    • Technology Roadmap Analysis
    • Analysis and Recommendations
  2. Market Overview
    • Market Coverage / Taxonomy
    • Market Definition / Scope / Limitations
  3. Market Background
    • Market Dynamics
      • Drivers
      • Restraints
      • Opportunity
      • Trends
    • Scenario Forecast
      • Demand in Optimistic Scenario
      • Demand in Likely Scenario
      • Demand in Conservative Scenario
    • Opportunity Map Analysis
    • Product Life Cycle Analysis
    • Supply Chain Analysis
    • Investment Feasibility Matrix
    • Value Chain Analysis
    • PESTLE and Porter’s Analysis
    • Regulatory Landscape
    • Regional Parent Market Outlook
    • Production and Consumption Statistics
    • Import and Export Statistics
  4. Global Market Analysis 2020 to 2024 and Forecast, 2025 to 2035
    • Historical Market Size Value (USD Million) Analysis, 2020 to 2024
    • Current and Future Market Size Value (USD Million) Projections, 2025 to 2035
      • Y to o to Y Growth Trend Analysis
      • Absolute $ Opportunity Analysis
  5. Global Market Pricing Analysis 2020 to 2024 and Forecast 2025 to 2035
  6. Global Market Analysis 2020 to 2024 and Forecast 2025 to 2035, By Particle Size
    • Introduction / Key Findings
    • Historical Market Size Value (USD Million) Analysis By Particle Size , 2020 to 2024
    • Current and Future Market Size Value (USD Million) Analysis and Forecast By Particle Size , 2025 to 2035
      • 0.5-2 mm
      • Powder
      • 2-5 mm
      • 5-10 mm
    • Y to o to Y Growth Trend Analysis By Particle Size , 2020 to 2024
    • Absolute $ Opportunity Analysis By Particle Size , 2025 to 2035
  7. Global Market Analysis 2020 to 2024 and Forecast 2025 to 2035, By End Use
    • Introduction / Key Findings
    • Historical Market Size Value (USD Million) Analysis By End Use, 2020 to 2024
    • Current and Future Market Size Value (USD Million) Analysis and Forecast By End Use, 2025 to 2035
      • Water Treatment
      • Oil & Gas
      • Petrochemicals
      • Fertilizers
      • Air Treatment
    • Y to o to Y Growth Trend Analysis By End Use, 2020 to 2024
    • Absolute $ Opportunity Analysis By End Use, 2025 to 2035
  8. Global Market Analysis 2020 to 2024 and Forecast 2025 to 2035, By Region
    • Introduction
    • Historical Market Size Value (USD Million) Analysis By Region, 2020 to 2024
    • Current Market Size Value (USD Million) Analysis and Forecast By Region, 2025 to 2035
      • North America
      • Latin America
      • Western Europe
      • Eastern Europe
      • East Asia
      • South Asia and Pacific
      • Middle East & Africa
    • Market Attractiveness Analysis By Region
  9. North America Market Analysis 2020 to 2024 and Forecast 2025 to 2035, By Country
    • Historical Market Size Value (USD Million) Trend Analysis By Market Taxonomy, 2020 to 2024
    • Market Size Value (USD Million) Forecast By Market Taxonomy, 2025 to 2035
      • By Country
        • USA
        • Canada
        • Mexico
      • By Particle Size
      • By End Use
    • Market Attractiveness Analysis
      • By Country
      • By Particle Size
      • By End Use
    • Key Takeaways
  10. Latin America Market Analysis 2020 to 2024 and Forecast 2025 to 2035, By Country
    • Historical Market Size Value (USD Million) Trend Analysis By Market Taxonomy, 2020 to 2024
    • Market Size Value (USD Million) Forecast By Market Taxonomy, 2025 to 2035
      • By Country
        • Brazil
        • Chile
        • Rest of Latin America
      • By Particle Size
      • By End Use
    • Market Attractiveness Analysis
      • By Country
      • By Particle Size
      • By End Use
    • Key Takeaways
  11. Western Europe Market Analysis 2020 to 2024 and Forecast 2025 to 2035, By Country
    • Historical Market Size Value (USD Million) Trend Analysis By Market Taxonomy, 2020 to 2024
    • Market Size Value (USD Million) Forecast By Market Taxonomy, 2025 to 2035
      • By Country
        • Germany
        • UK
        • Italy
        • Spain
        • France
        • Nordic
        • BENELUX
        • Rest of Western Europe
      • By Particle Size
      • By End Use
    • Market Attractiveness Analysis
      • By Country
      • By Particle Size
      • By End Use
    • Key Takeaways
  12. Eastern Europe Market Analysis 2020 to 2024 and Forecast 2025 to 2035, By Country
    • Historical Market Size Value (USD Million) Trend Analysis By Market Taxonomy, 2020 to 2024
    • Market Size Value (USD Million) Forecast By Market Taxonomy, 2025 to 2035
      • By Country
        • Russia
        • Poland
        • Hungary
        • Balkan & Baltic
        • Rest of Eastern Europe
      • By Particle Size
      • By End Use
    • Market Attractiveness Analysis
      • By Country
      • By Particle Size
      • By End Use
    • Key Takeaways
  13. East Asia Market Analysis 2020 to 2024 and Forecast 2025 to 2035, By Country
    • Historical Market Size Value (USD Million) Trend Analysis By Market Taxonomy, 2020 to 2024
    • Market Size Value (USD Million) Forecast By Market Taxonomy, 2025 to 2035
      • By Country
        • China
        • Japan
        • South Korea
      • By Particle Size
      • By End Use
    • Market Attractiveness Analysis
      • By Country
      • By Particle Size
      • By End Use
    • Key Takeaways
  14. South Asia and Pacific Market Analysis 2020 to 2024 and Forecast 2025 to 2035, By Country
    • Historical Market Size Value (USD Million) Trend Analysis By Market Taxonomy, 2020 to 2024
    • Market Size Value (USD Million) Forecast By Market Taxonomy, 2025 to 2035
      • By Country
        • India
        • ASEAN
        • Australia & New Zealand
        • Rest of South Asia and Pacific
      • By Particle Size
      • By End Use
    • Market Attractiveness Analysis
      • By Country
      • By Particle Size
      • By End Use
    • Key Takeaways
  15. Middle East & Africa Market Analysis 2020 to 2024 and Forecast 2025 to 2035, By Country
    • Historical Market Size Value (USD Million) Trend Analysis By Market Taxonomy, 2020 to 2024
    • Market Size Value (USD Million) Forecast By Market Taxonomy, 2025 to 2035
      • By Country
        • Kingdom of Saudi Arabia
        • Other GCC Countries
        • Turkiye
        • South Africa
        • Other African Union
        • Rest of Middle East & Africa
      • By Particle Size
      • By End Use
    • Market Attractiveness Analysis
      • By Country
      • By Particle Size
      • By End Use
    • Key Takeaways
  16. Key Countries Market Analysis
    • USA
      • Pricing Analysis
      • Market Share Analysis, 2024
        • By Particle Size
        • By End Use
    • Canada
      • Pricing Analysis
      • Market Share Analysis, 2024
        • By Particle Size
        • By End Use
    • Mexico
      • Pricing Analysis
      • Market Share Analysis, 2024
        • By Particle Size
        • By End Use
    • Brazil
      • Pricing Analysis
      • Market Share Analysis, 2024
        • By Particle Size
        • By End Use
    • Chile
      • Pricing Analysis
      • Market Share Analysis, 2024
        • By Particle Size
        • By End Use
    • Germany
      • Pricing Analysis
      • Market Share Analysis, 2024
        • By Particle Size
        • By End Use
    • UK
      • Pricing Analysis
      • Market Share Analysis, 2024
        • By Particle Size
        • By End Use
    • Italy
      • Pricing Analysis
      • Market Share Analysis, 2024
        • By Particle Size
        • By End Use
    • Spain
      • Pricing Analysis
      • Market Share Analysis, 2024
        • By Particle Size
        • By End Use
    • France
      • Pricing Analysis
      • Market Share Analysis, 2024
        • By Particle Size
        • By End Use
    • India
      • Pricing Analysis
      • Market Share Analysis, 2024
        • By Particle Size
        • By End Use
    • ASEAN
      • Pricing Analysis
      • Market Share Analysis, 2024
        • By Particle Size
        • By End Use
    • Australia & New Zealand
      • Pricing Analysis
      • Market Share Analysis, 2024
        • By Particle Size
        • By End Use
    • China
      • Pricing Analysis
      • Market Share Analysis, 2024
        • By Particle Size
        • By End Use
    • Japan
      • Pricing Analysis
      • Market Share Analysis, 2024
        • By Particle Size
        • By End Use
    • South Korea
      • Pricing Analysis
      • Market Share Analysis, 2024
        • By Particle Size
        • By End Use
    • Russia
      • Pricing Analysis
      • Market Share Analysis, 2024
        • By Particle Size
        • By End Use
    • Poland
      • Pricing Analysis
      • Market Share Analysis, 2024
        • By Particle Size
        • By End Use
    • Hungary
      • Pricing Analysis
      • Market Share Analysis, 2024
        • By Particle Size
        • By End Use
    • Kingdom of Saudi Arabia
      • Pricing Analysis
      • Market Share Analysis, 2024
        • By Particle Size
        • By End Use
    • Turkiye
      • Pricing Analysis
      • Market Share Analysis, 2024
        • By Particle Size
        • By End Use
    • South Africa
      • Pricing Analysis
      • Market Share Analysis, 2024
        • By Particle Size
        • By End Use
  17. Market Structure Analysis
    • Competition Dashboard
    • Competition Benchmarking
    • Market Share Analysis of Top Players
      • By Regional
      • By Particle Size
      • By End Use
  18. Competition Analysis
    • Competition Deep Dive
      • Honeywell International Inc.
        • Overview
        • Product Portfolio
        • Profitability by Market Segments (Product/Age /Sales Channel/Region)
        • Sales Footprint
        • Strategy Overview
          • Marketing Strategy
          • Product Strategy
          • Channel Strategy
      • Axens S.A.
      • Sumitomo Chemical Co., Ltd.
      • Porocel Industries LLC (Evonik)
      • Chalco Shandong Advanced Material Co., Ltd.
      • Huber Corporation
      • Chemviron Carbon
      • Dynamic Adsorbents Inc.
      • Activated Alumina Spheres
      • Sorbead India
      • Jacobi Carbons Group
      • AGC Chemicals
      • Filtration Group
      • Jiangxi Zhongyu New Material Co., Ltd.
  19. Assumptions & Acronyms Used
  20. Research Methodology

List of Tables

  • Table 1: Global Market Value (USD Million) Forecast by Region, 2020 to 2035
  • Table 2: Global Market Value (USD Million) Forecast by Particle Size , 2020 to 2035
  • Table 3: Global Market Value (USD Million) Forecast by End Use, 2020 to 2035
  • Table 4: North America Market Value (USD Million) Forecast by Country, 2020 to 2035
  • Table 5: North America Market Value (USD Million) Forecast by Particle Size , 2020 to 2035
  • Table 6: North America Market Value (USD Million) Forecast by End Use, 2020 to 2035
  • Table 7: Latin America Market Value (USD Million) Forecast by Country, 2020 to 2035
  • Table 8: Latin America Market Value (USD Million) Forecast by Particle Size , 2020 to 2035
  • Table 9: Latin America Market Value (USD Million) Forecast by End Use, 2020 to 2035
  • Table 10: Western Europe Market Value (USD Million) Forecast by Country, 2020 to 2035
  • Table 11: Western Europe Market Value (USD Million) Forecast by Particle Size , 2020 to 2035
  • Table 12: Western Europe Market Value (USD Million) Forecast by End Use, 2020 to 2035
  • Table 13: Eastern Europe Market Value (USD Million) Forecast by Country, 2020 to 2035
  • Table 14: Eastern Europe Market Value (USD Million) Forecast by Particle Size , 2020 to 2035
  • Table 15: Eastern Europe Market Value (USD Million) Forecast by End Use, 2020 to 2035
  • Table 16: East Asia Market Value (USD Million) Forecast by Country, 2020 to 2035
  • Table 17: East Asia Market Value (USD Million) Forecast by Particle Size , 2020 to 2035
  • Table 18: East Asia Market Value (USD Million) Forecast by End Use, 2020 to 2035
  • Table 19: South Asia and Pacific Market Value (USD Million) Forecast by Country, 2020 to 2035
  • Table 20: South Asia and Pacific Market Value (USD Million) Forecast by Particle Size , 2020 to 2035
  • Table 21: South Asia and Pacific Market Value (USD Million) Forecast by End Use, 2020 to 2035
  • Table 22: Middle East & Africa Market Value (USD Million) Forecast by Country, 2020 to 2035
  • Table 23: Middle East & Africa Market Value (USD Million) Forecast by Particle Size , 2020 to 2035
  • Table 24: Middle East & Africa Market Value (USD Million) Forecast by End Use, 2020 to 2035

List of Figures

  • Figure 1: Global Market Pricing Analysis
  • Figure 2: Global Market Value (USD Million) Forecast 2020-2035
  • Figure 3: Global Market Value Share and BPS Analysis by Particle Size , 2025 and 2035
  • Figure 4: Global Market Y to o to Y Growth Comparison by Particle Size , 2025-2035
  • Figure 5: Global Market Attractiveness Analysis by Particle Size
  • Figure 6: Global Market Value Share and BPS Analysis by End Use, 2025 and 2035
  • Figure 7: Global Market Y to o to Y Growth Comparison by End Use, 2025-2035
  • Figure 8: Global Market Attractiveness Analysis by End Use
  • Figure 9: Global Market Value (USD Million) Share and BPS Analysis by Region, 2025 and 2035
  • Figure 10: Global Market Y to o to Y Growth Comparison by Region, 2025-2035
  • Figure 11: Global Market Attractiveness Analysis by Region
  • Figure 12: North America Market Incremental Dollar Opportunity, 2025-2035
  • Figure 13: Latin America Market Incremental Dollar Opportunity, 2025-2035
  • Figure 14: Western Europe Market Incremental Dollar Opportunity, 2025-2035
  • Figure 15: Eastern Europe Market Incremental Dollar Opportunity, 2025-2035
  • Figure 16: East Asia Market Incremental Dollar Opportunity, 2025-2035
  • Figure 17: South Asia and Pacific Market Incremental Dollar Opportunity, 2025-2035
  • Figure 18: Middle East & Africa Market Incremental Dollar Opportunity, 2025-2035
  • Figure 19: North America Market Value Share and BPS Analysis by Country, 2025 and 2035
  • Figure 20: North America Market Value Share and BPS Analysis by Particle Size , 2025 and 2035
  • Figure 21: North America Market Y to o to Y Growth Comparison by Particle Size , 2025-2035
  • Figure 22: North America Market Attractiveness Analysis by Particle Size
  • Figure 23: North America Market Value Share and BPS Analysis by End Use, 2025 and 2035
  • Figure 24: North America Market Y to o to Y Growth Comparison by End Use, 2025-2035
  • Figure 25: North America Market Attractiveness Analysis by End Use
  • Figure 26: Latin America Market Value Share and BPS Analysis by Country, 2025 and 2035
  • Figure 27: Latin America Market Value Share and BPS Analysis by Particle Size , 2025 and 2035
  • Figure 28: Latin America Market Y to o to Y Growth Comparison by Particle Size , 2025-2035
  • Figure 29: Latin America Market Attractiveness Analysis by Particle Size
  • Figure 30: Latin America Market Value Share and BPS Analysis by End Use, 2025 and 2035
  • Figure 31: Latin America Market Y to o to Y Growth Comparison by End Use, 2025-2035
  • Figure 32: Latin America Market Attractiveness Analysis by End Use
  • Figure 33: Western Europe Market Value Share and BPS Analysis by Country, 2025 and 2035
  • Figure 34: Western Europe Market Value Share and BPS Analysis by Particle Size , 2025 and 2035
  • Figure 35: Western Europe Market Y to o to Y Growth Comparison by Particle Size , 2025-2035
  • Figure 36: Western Europe Market Attractiveness Analysis by Particle Size
  • Figure 37: Western Europe Market Value Share and BPS Analysis by End Use, 2025 and 2035
  • Figure 38: Western Europe Market Y to o to Y Growth Comparison by End Use, 2025-2035
  • Figure 39: Western Europe Market Attractiveness Analysis by End Use
  • Figure 40: Eastern Europe Market Value Share and BPS Analysis by Country, 2025 and 2035
  • Figure 41: Eastern Europe Market Value Share and BPS Analysis by Particle Size , 2025 and 2035
  • Figure 42: Eastern Europe Market Y to o to Y Growth Comparison by Particle Size , 2025-2035
  • Figure 43: Eastern Europe Market Attractiveness Analysis by Particle Size
  • Figure 44: Eastern Europe Market Value Share and BPS Analysis by End Use, 2025 and 2035
  • Figure 45: Eastern Europe Market Y to o to Y Growth Comparison by End Use, 2025-2035
  • Figure 46: Eastern Europe Market Attractiveness Analysis by End Use
  • Figure 47: East Asia Market Value Share and BPS Analysis by Country, 2025 and 2035
  • Figure 48: East Asia Market Value Share and BPS Analysis by Particle Size , 2025 and 2035
  • Figure 49: East Asia Market Y to o to Y Growth Comparison by Particle Size , 2025-2035
  • Figure 50: East Asia Market Attractiveness Analysis by Particle Size
  • Figure 51: East Asia Market Value Share and BPS Analysis by End Use, 2025 and 2035
  • Figure 52: East Asia Market Y to o to Y Growth Comparison by End Use, 2025-2035
  • Figure 53: East Asia Market Attractiveness Analysis by End Use
  • Figure 54: South Asia and Pacific Market Value Share and BPS Analysis by Country, 2025 and 2035
  • Figure 55: South Asia and Pacific Market Value Share and BPS Analysis by Particle Size , 2025 and 2035
  • Figure 56: South Asia and Pacific Market Y to o to Y Growth Comparison by Particle Size , 2025-2035
  • Figure 57: South Asia and Pacific Market Attractiveness Analysis by Particle Size
  • Figure 58: South Asia and Pacific Market Value Share and BPS Analysis by End Use, 2025 and 2035
  • Figure 59: South Asia and Pacific Market Y to o to Y Growth Comparison by End Use, 2025-2035
  • Figure 60: South Asia and Pacific Market Attractiveness Analysis by End Use
  • Figure 61: Middle East & Africa Market Value Share and BPS Analysis by Country, 2025 and 2035
  • Figure 62: Middle East & Africa Market Value Share and BPS Analysis by Particle Size , 2025 and 2035
  • Figure 63: Middle East & Africa Market Y to o to Y Growth Comparison by Particle Size , 2025-2035
  • Figure 64: Middle East & Africa Market Attractiveness Analysis by Particle Size
  • Figure 65: Middle East & Africa Market Value Share and BPS Analysis by End Use, 2025 and 2035
  • Figure 66: Middle East & Africa Market Y to o to Y Growth Comparison by End Use, 2025-2035
  • Figure 67: Middle East & Africa Market Attractiveness Analysis by End Use
  • Figure 68: Global Market - Tier Structure Analysis
  • Figure 69: Global Market - Company Share Analysis
Dashboard
Dashboard
Dashboard
Dashboard
Dashboard
Dashboard

Full Research Suite comprises of:

Market outlook & trends analysis

Market outlook & trends analysis

Interviews & case studies

Interviews & case studies

Strategic recommendations

Strategic recommendations

Vendor profiles & capabilities analysis

Vendor profiles & capabilities analysis

5-year forecasts

5-year forecasts

8 regions and 60+ country-level data splits

8 regions and 60+ country-level data splits

Market segment data splits

Market segment data splits

12 months of continuous data updates

12 months of continuous data updates

DELIVERED AS:

PDF EXCEL ONLINE

Full Research Suite


$5000

$7500

$10000

Buy Report Now
Similar Industry Reports

Similar Industry Reports

Activated Carbon for Sugar Decolorization Market

Activated Carbon for Sugar Decolorization Market Size and Share Forecast Outlook 2025 to 2035

Activated Carbon Fiber Market

Activated Carbon Fiber Market Size and Share Forecast Outlook 2025 to 2035

Activated Cake Emulsifier Market

Activated Cake Emulsifier Market Size and Share Forecast Outlook 2025 to 2035

Activated Carbon Bags Market

Activated Carbon Bags Market Size and Share Forecast Outlook 2025 to 2035

Activated Bleaching Earth Market

Activated Bleaching Earth Market Growth - Trends & Forecast 2025 to 2035

Activated Carbon Filter Market

Activated Carbon Filter Market Growth - Trends & Forecast 2025 to 2035

Activated Cake Emulsifier Market Share Analysis

Market Share Breakdown of Activated Cake Emulsifier Suppliers

Activated Carbon Market Share Analysis

Assessing Activated Carbon Market Share & Industry Trends

Activated Partial Thromboplastin Test Market

Activated Partial Thromboplastin Test Market

Activated Charcoal Supplements Market

Activated Charcoal Supplements Market Trends - Sales & Industry Insights

Heat-Activated Beauty Masks Market

Heat-Activated Beauty Masks Market Analysis - Size, Share, and Forecast Outlook 2025 to 2035

Wood Activated Carbon Market

Wood Activated Carbon Market Size and Share Forecast Outlook 2025 to 2035

Heat Activated Tear Tape Market

Heat Activated Tear Tape Market

Light-Activated Anti-Pollution Skincare Market

Light-Activated Anti-Pollution Skincare Market Analysis - Size and Share Forecast Outlook 2025 to 2035

Water Activated Tape Dispensers Market

Water Activated Tape Dispensers Market Size and Share Forecast Outlook 2025 to 2035

Water Activated Tape Dispensers Market Share Analysis

Market Share Breakdown of Water Activated Tape Dispensers

Water-activated Tape Market

Water-Activated Tape Market Trends & Industry Forecast 2024-2034

Pelletized Activated Carbon Market

Pelletized Activated Carbon Market Analysis - Size & Industry Trends 2025 to 2035

Food Grade Activated Carbon Market

Food Grade Activated Carbon Market Report - Applications & Growth 2025 to 2035

Fluorescence-Activated Cell Sorting Market

Fluorescence-Activated Cell Sorting Market Size and Share Forecast Outlook 2025 to 2035

Future Market Insights

Activated Alumina Market

Chat With MaRIA

Chat With

MaRIA

Hi There, I am MaRIA, Your Market Research Intelligence Assistant. How may I help you?