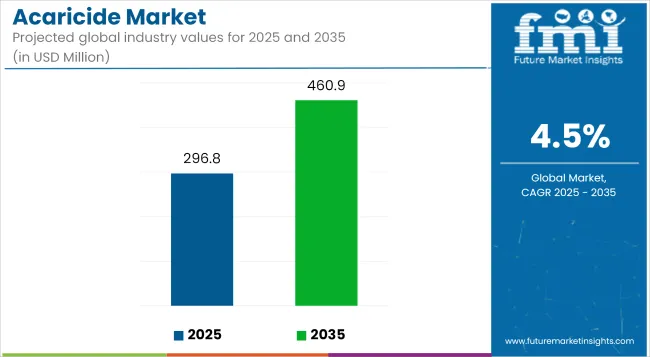
The global acaricide market is estimated to reach USD 296.8 million in 2025 and expand to approximately USD 460.9 million by 2035, reflecting a CAGR of 4.5% during the forecast period. Market growth is being supported by increasing pest pressures in agriculture, livestock management, and vector control programs in public health.

| Metric | Value |
|---|---|
| Industry Size (2025E) | USD 296.8 million |
| Industry Value (2035F) | USD 460.9 million |
| CAGR (2025 to 2035) | 4.5% |
Acaricides are being applied to control mite and tick populations that pose significant threats to crop health, livestock productivity, and human well-being. These substances are being utilized to prevent yield losses and disease transmission associated with arachnid infestations. As food security objectives gain prominence globally, the demand for effective pest control agents is being reinforced across both commercial farming and smallholder operations.
In the agricultural sector, the need to maintain high crop productivity is driving widespread adoption of acaricide solutions. Mite infestations in vegetables, fruits, and ornamental plants are being managed using both contact and systemic acaricides, often in combination with integrated pest management (IPM) approaches. Formulation improvements aimed at enhancing residual efficacy and minimizing environmental persistence are being pursued by manufacturers.
In livestock, acaricides are being incorporated into animal treatment regimens to manage tick-borne diseases that reduce weight gain, milk production, and reproductive efficiency. Veterinary-grade acaricides are being distributed via sprays, pour-ons, and feed additives, particularly in regions where pastoral economies face significant parasite burdens.
Public health applications are also contributing to market expansion. Ticks as vectors of Lyme disease, Rocky Mountain spotted fever, and other infections are prompting investments in community-level vector control. National programs are deploying acaricides in both urban and peri-urban zones to prevent outbreaks and reduce transmission risk.
Product development is shifting toward botanical-based acaricides and bio-derived compounds. These alternatives are being promoted in response to increasing regulatory scrutiny over synthetic chemical usage and rising interest in residue-free pest control solutions.

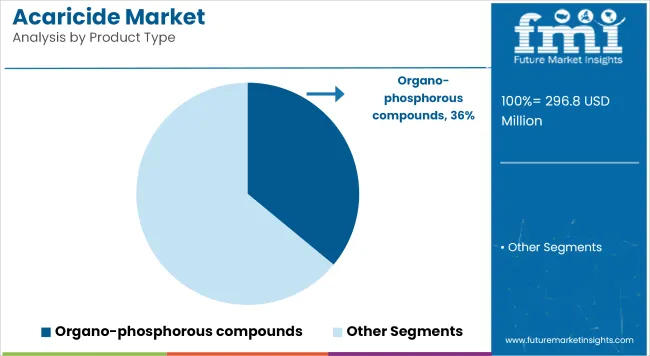
Organo-phosphorous compounds are estimated to account for approximately 36% of the global acaricide market share in 2025 and are projected to grow at a CAGR of 4.6% through 2035. These synthetic chemicals are widely used to control mite infestations in both agricultural fields and livestock environments.
Their effectiveness against resistant mite populations and compatibility with integrated pest management (IPM) systems have sustained their use despite increasing regulatory scrutiny. Advancements in formulation technology are enabling controlled-release and lower-residue variants to meet evolving environmental and residue compliance standards. Demand is expected to remain steady in developing regions where crop loss due to mites continues to impact food security and yield optimization.

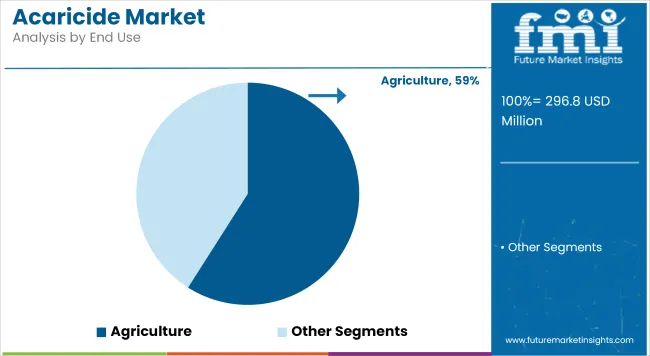
The agriculture segment is projected to hold approximately 59% of the global acaricide market share in 2025 and is expected to grow at a CAGR of 4.7% through 2035. Acaricides are widely applied to protect crops such as cotton, fruits, vegetables, tea, and ornamentals from spider mites, rust mites, and other phytophagous species.
With climate change contributing to the proliferation of pest populations and extended growing seasons, the need for effective mite control is intensifying. Farmers are adopting rotation-friendly and residue-limiting products to meet export standards, particularly in Europe and North America. As integrated pest control becomes central to sustainable agriculture, the agricultural sector will continue to drive demand for targeted, crop-safe acaricide solutions.
Regulatory Restrictions on Chemical Pesticides
Stringent health and environmental regulations on synthetic acaricides, particularly in European Union and North America, are limiting the use of synthetic acaricides due to their potential toxicity and harmful effects on the environment. Hence, regulatory agencies like the European Chemicals Agency (ECHA) and USA. Environmental Protection Agency (EPA) are placing bans on or restricting specific chemical compounds that endanger human health, non-target species, and ecosystems.
Manufacturers are being compelled to reformulate products, or explore alternative solutions, such as bio-based and naturally derived acaricides, according to this regulatory pressure. Nevertheless, replacement pest control methods demand considerable investment in terms of research, development, and compliance, leading to higher costs and longer time-to-market for any new product. For market competitiveness, manufacturers have to align with these regulations and also assure safety and effectiveness
Resistance Development in Pests
Over time, Mites and ticks develop resistance to widely used acaricides, decreasing their efficacy and hindering control efforts. In addition, pests can develop mechanisms to neutralize or evading acaricide activity through continuous exposure to the same active substance. Resulting in widespread resistance problems, especially on agricultural and veterinary horizons, ticks and mites are pests of crops and livestock. Novel formulations, combination therapies, and rotational usage strategies are being investigated to mitigate resistance.
The use of Integrated Pest Management (IPM) strategies, including biological control agents, habitat manipulation, and specific chemical applications, is on the rise. But creating and implementing these strategies appropriately takes mass testing in the field, regulatory approval (in institutions that research how to battle pathogens) and educating end users on how to correctly use these methods long-term.
High Costs of Bio-Based Alternatives
With an increase in demand for eco-friendly methods of pest management, manufacturers are focusing on the development of bio-based acaricides from botanical extracts, microbial agents, and naturally occurring compounds. The cost of research, development, and production of alternatives is, however, comparatively high against synthetic-based acaricides. Costs of raw material sourcing, extraction, and formulation, on the other hand, render production processes expensive for bio-based products, a disadvantage and accessibility constraint in price-sensitive regions like Asia and Africa. In addition, bio-based products often have shorter residual activity meaning that they need to be applied more often, increasing the overall cost of use for farmers and livestock producers. Consumer support and incentives for a more regenerative agriculture are prominent, yet cost continues to be a major barrier to adoption when it comes to market share.
Growth in Organic and Sustainable Farming
Growing consumer preference for organic food and sustainable agricultural practices is expected to drive the demand for eco-friendly pest control products, including bio-based acaricides. Certain synthetic pesticides are regulated by the organic farming mandates, thereby paving the way for naturally derived alternatives.
To compete with chemical-based formulations, manufacturers are investing in plant-based and microbial solutions to provide organic farmers with environmentally safe yet effective pest control options. Increasing awareness regarding pesticide residues on food underlines the growth of the market, along with government policies that promote sustainable agriculture.
The organic food processing industry which has significant growth in Europe and North America will also see increased adoption of the bio-acaricide and the demand in the market for bio-acaricides is anticipated to spur the research and innovation in the segment.
Advancements in Nanotechnology-Based Formulations
Nanotechnology can potentially bring a revolution in acaricide formulas through the improvement of the effective nature of the products, lessening the impact on the environment, and better efficiency in applying acaricides. Advances in nano-encapsulation uniquely permit active ingredients to be released when most useful, resulting in increased persistence, lower toxicity, and better penetration into the pest structure.
The increased effectiveness and reduced frequency of application help in improving the product performance such that nanotechnology-based acaricides prove to be more cost-efficient in the long run. Moreover, nano-formulations facilitate selective delivery, minimizing off-target exposure and environmental pollution.
Studies on the use of nanoparticles, liposomes, and biodegradable carriers are also being developed more in-depth, especially in the field of agriculture and veterinary. The technology will be a game changer in the pest control market due to its development in the field of nanotechnology.
Expansion of Livestock and Poultry Farming
A growing worldwide appetite for meat, dairy, and poultry products, especially among developing countries like China, India, and Brazil, is helping to fuel the expansion of the global livestock industry. As livestock populations grow, so does the demand for effective tick and mite control methods to protect the health and productivity of these animals.
Acaricides are important for livestock protection against ectoparasites that cause morbidity, decrease milk and meat production, and reduce farm profitability. The adoption of veterinary acaricides are increasing as the farmers are searching for holistic, sustainable, and cost-effective pest management techniques. Moreover, the adoption of automated livestock management system due to demand for more innovative pest control solutions has boon the growth of market.

The United States acaricide market is projected to grow due to the rising demand for effective pest management solutions in agricultural, livestock, and residential settings. Acaricides are used by farmers and livestock producers to resist infestations of mites and ticks that have significant impacts on crop yield and can affect animal health.
Regulatory requirements and a higher demand for residue-free food products are also pushing the adoption for sustainable and organic pest control solutions. Moreover, the ongoing research and development in precision agriculture and biotechnology are facilitating the creation of more specific and effective acaricides, thus propelling the market further.
| Country | CAGR (2025 to 2035) |
|---|---|
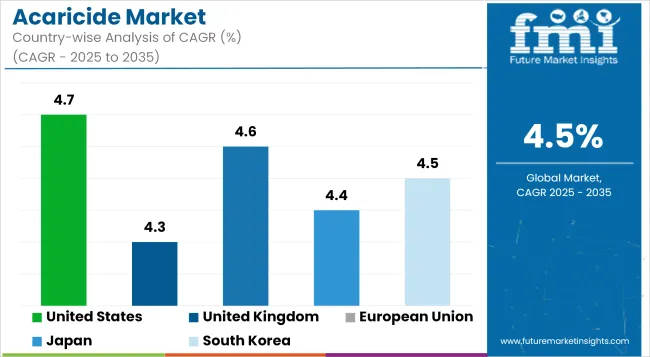
| United States | 4.7% |
This growth is being fueled by the need for sustainable pest control solutions in sectors like agriculture, veterinary science, and public health, helping boost UK acaricide market. The awareness of vector-driven diseases and the correlation of climate change and pest distribution are contributing to the demand for effective acaricides.
UK government’s efforts to reduce dependency on chemical pesticides; as well as to promote integrated pest management (IPM) strategies; is driving innovation in biopesticides and targeted acaricide formulations. Also, the increase in organic farming and precision livestock management also leads to high demand for safer, environment-friendly acaricide products, thereby supporting the market.
| Country | CAGR (2025 to 2035) |
|---|---|
| United Kingdom | 4.3% |
Market growth The EV market in the EU is strong, due to stringent rules on pesticide use, and the increase of precision farming The rise of sustainable pest control methods is largely promoting the EU acaricide market. Many other policies such as the European Green Deal and Farm to Fork strategy are calling for a decline in the use of synthetic pesticides, which is increasing the demand for bio-based acaricides.
Also, growth in organic agriculture and livestock farming is stimulating innovation in formulations of natural and botanical acaricides. Research and development investments for new acaricides are helping mold the EU market, enabling safer, more effective pest control.
| Region | CAGR (2025 to 2035) |
|---|---|
| European Union | 4.6% |
Emerging Technologies for Pest Control, High-Value Crop Protection, and Growing Cognizance of Mite & Tick Infections in Livestock and Companion Animals are the Key Factors Driving the Growth of Japan Acaricides Market. The country’s strong focus on food safety and tight regulation of pesticide application are driving the evolution of acaricides that are highly selective and low-residue.
Furthermore, the growing popularity of urban gardening, hydroponics, and precision livestock farming are driving the need for sustainable and effective pest control solutions. Research into botanical and biopesticide-based acaricides is also under rapid development, offering eco-friendly alternatives to conventional synthetic options.
| Country | CAGR (2025 to 2035) |
|---|---|
| Japan | 4.4% |
The acaricide market in South Korea is growing, driven by increased investment in agricultural technology, government support of sustainable pest control, and greater consumer awareness of food safety. Reducing dependence on chemical pesticides are at the forefront of the research on bio-acaricides and precision application methods in the country.
The market demand is further attributed to the growing livestock sector and increasing demand for effective mite control in poultry and dairy farms. AI-powered pest surveillance and smart farming setups are also contributing to the optimization of acaricide usage and increasing the effectiveness of pest management.
| Country | CAGR (2025 to 2035) |
|---|---|
| South Korea | 4.5% |
The acaricide market is evolving with a strong focus on innovation and sustainability. As regulatory pressures increase, key players are prioritizing the development of safer, more effective formulations, including biocontrol agents and natural alternatives.
Companies are investing in research to enhance the efficacy of acaricides while minimizing environmental impact, responding to growing demand for eco-friendly pest control solutions. Regional players are gaining traction by offering affordable, locally tailored solutions that address specific pest challenges in different agricultural settings.
The market is estimated to reach a value of USD 296.8 million by the end of 2025.
The market is projected to exhibit a CAGR of 4.5% over the assessment period.
The market is expected to clock revenue of USD 460.9 million by end of 2035.
Key companies in the Acaricide Market include Bayer Ag, Syngenta AND Monsanto
On the basis on Natural significant share over the forecast period.


Full Research Suite comprises of:
Market outlook & trends analysis
Interviews & case studies
Strategic recommendations
Vendor profiles & capabilities analysis
5-year forecasts
8 regions and 60+ country-level data splits
Market segment data splits
12 months of continuous data updates
DELIVERED AS:
PDF EXCEL ONLINE

Thank you!
You will receive an email from our Business Development Manager. Please be sure to check your SPAM/JUNK folder too.
Chat With
MaRIA