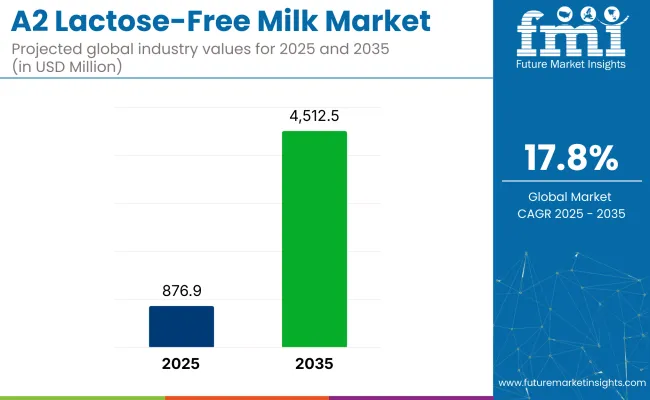
The global A2 Lactose-free Milk market is estimated to be worth USD 876.9 million in 2025 and is projected to reach a value of USD 4,512.5 million by 2035, expanding at a CAGR of 17.8% over the assessment period of 2025 to 2035
The dairy alternatives market has seen significant growth due to rising consumer interest in plant-based diets and health-conscious choices. Products like almond, soy, and oat milk have gained popularity, prompting traditional dairy brands to innovate.
A2 lactose-free milk is marketed as a natural alternative, appealing to consumers who prefer dairy but seek to avoid lactose. This positioning allows A2 milk to capture a segment of the market that values both dairy's nutritional benefits and lactose-free options.
Lactose intolerance affects a substantial portion of the global population, leading to discomfort when consuming regular dairy products. This condition drives demand for lactose-free alternatives, as individuals seek options that allow them to enjoy dairy without adverse effects.
A2 milk, containing only the A2 beta-casein protein, is often better tolerated by those with lactose intolerance, as it may cause fewer digestive issues. This perception enhances its appeal among consumers looking for a more digestible dairy option.
The below table presents a comparative assessment of the variation in CAGR over six months for the base year (2024) and current year (2025) for global A2 Lactose-free Milk market. This analysis reveals crucial shifts in market performance and indicates revenue realization patterns, thus providing stakeholders with a better vision about the market growth trajectory over the year. The first half of the year, or H1, spans from January to June. The second half, H2, includes the months from July to December.
Particular | Value CAGR |
---|---|
H1 | 15.4% (2024 to 2034) |
H2 | 16.0% (2024 to 2034) |
H1 | 16.3% (2025 to 2035) |
H2 | 17.0% (2025 to 2035) |
The above table presents the expected CAGR for the global A2 Lactose-free Milk demand space over semi-annual period spanning from 2025 to 2035. In the first half (H1) of the year 2024, the business is predicted to surge at a CAGR of 15.4%, followed by a slightly higher growth rate of 16.0% in the second half (H2) of the same year.
Moving into year 2025, the CAGR is projected to increase slightly to 16.3% in the first half and remain relatively moderate at 17.0% in the second half. In the first half (H1 2025) the market witnessed a decrease of 16 BPS while in the second half (H2 2025), the market witnessed an increase of 34 BPS.
Rise of Functional Foods
The demand for functional foods is surging as consumers increasingly seek products that provide health benefits beyond basic nutrition. A2 lactose-free milk is positioned as a functional product, appealing to health-conscious individuals looking for dairy options that support digestive health. Its unique composition, which is easier to digest for many, makes it an attractive choice for those with lactose intolerance.
This trend is prompting manufacturers to invest in research and development, creating marketing campaigns that highlight the health benefits of A2 milk. By promoting it as a beneficial addition to a balanced diet, brands are tapping into the growing consumer interest in foods that contribute to overall well-being, thereby driving sales and expanding market reach.
Increased Product Innovation
The A2 lactose-free milk market is experiencing a wave of product innovation, with brands actively introducing new flavors, fortified options, and diverse formats. This includes ready-to-drink beverages, yogurt, and even ice cream, catering to a wide range of consumer preferences and dietary needs. Such innovation not only enhances the product lineup but also attracts different demographics, from health enthusiasts to families seeking nutritious options for their children.
By diversifying their offerings, companies can appeal to consumers looking for variety in their diets, making A2 milk more attractive. This trend of continuous innovation is crucial for maintaining competitive advantage in a rapidly evolving market, ultimately boosting sales and brand loyalty.
Culinary Versatility
A2 lactose-free milk is gaining recognition for its culinary versatility, making it a popular choice among home cooks and professional chefs alike. As consumers become more adventurous in the kitchen, they are experimenting with A2 milk in a variety of recipes, including smoothies, sauces, baked goods, and even savory dishes. This adaptability not only enhances the flavor and texture of meals but also allows consumers to enjoy the benefits of lactose-free dairy in their everyday cooking.
The trend of incorporating A2 milk into diverse culinary applications encourages consumers to view it as a staple ingredient rather than just a beverage. This increased usage in cooking and baking contributes to higher sales and fosters a deeper connection between consumers and the product.
Global A2 Lactose-free Milk sales increased at a CAGR of 19.0% from 2020 to 2024. For the next ten years (2025 to 2035), projections are that expenditure on A2 Lactose-free Milk will rise at 17.8% CAGR.
Lactose intolerance affects a substantial segment of the global population, leading to discomfort and digestive issues when consuming regular dairy and dairy products. This widespread condition has heightened awareness and demand for lactose-free alternatives.
A2 milk specifically addresses this need by offering a dairy option that many individuals can enjoy without experiencing adverse effects. As more consumers become informed about lactose intolerance and seek suitable products, A2 milk's appeal continues to grow, positioning it as a preferred choice in the lactose-free market.
Effective marketing strategies and branding initiatives by A2 milk producers have significantly contributed to its rising popularity. By highlighting the unique benefits of A2 milk, such as its digestibility and health advantages, brands have successfully raised consumer awareness and built trust.
Engaging marketing campaigns, educational content, and positive customer testimonials foster brand loyalty among existing consumers while attracting new customers. This strong brand presence not only enhances market visibility but also encourages repeat purchases, solidifying A2 milk's position in the competitive dairy landscape.
Tier 1 Companies comprise industry leaders with annual revenues exceeding USD 20 million and a market share of approximately 40% to 50%. These companies are recognized for their high production capacity, extensive product portfolios, and robust distribution networks. They possess significant expertise in manufacturing and packaging across multiple formats, allowing them to cater to a wide range of consumer preferences. Their geographical reach is broad, often spanning multiple continents, supported by a strong and loyal consumer base.
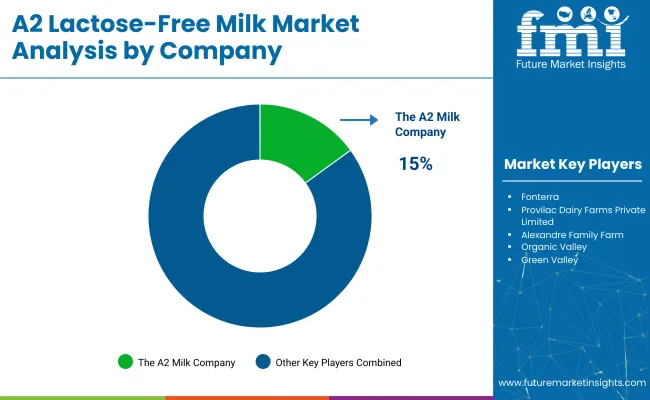
Prominent companies in Tier 1 include the A2 Milk Company, Nestlé S.A., Danone S.A., and Fonterra Co-operative Group. These leaders are well-positioned to leverage economies of scale and invest in marketing and innovation, further solidifying their market dominance.
Tier 2 Companies consist of mid-sized players with revenues ranging from USD 5 million to USD 20 million. These companies typically have a strong regional presence and significantly influence local retail markets. While they may not possess the extensive global reach of Tier 1 companies, they are characterized by a solid understanding of consumer preferences in their specific markets.
Tier 2 companies often focus on niche segments within the A2 lactose-free milk category, offering specialized products that cater to local tastes and dietary needs. Notable players in this tier include Organic Valley, Horizon Organic, and Bulla Dairy Foods. These companies are equipped with good technology and ensure regulatory compliance, although they may lack the advanced capabilities and resources of Tier 1 leaders.
Tier 3 Companies encompass a large number of small-scale enterprises operating primarily at the local level, with revenues below USD 5 million. These companies are often focused on fulfilling niche market demands and are characterized by limited geographical reach.
They typically serve specific communities or regions, providing tailored products that meet local consumer preferences. Tier 3 companies operate in a less organized market segment, often lacking the formal structures and resources of larger competitors. This tier includes various local dairies and artisanal producers that emphasize quality and local sourcing.
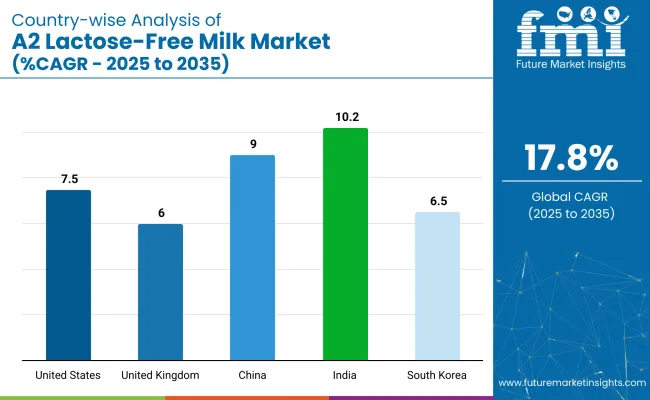
Countries | Market Value (2035) |
---|---|
United States | USD 676.9 million |
Germany | USD 451.3 million |
China | USD 361.0 million |
India | USD 225.6 million |
Japan | USD 90.3 million |
Increased availability and accessibility of A2 lactose-free milk in the USA market are significantly driving consumer demand. Major grocery chains, such as Walmart, Kroger, and Whole Foods, are expanding their product lines to include A2 milk, ensuring it is prominently displayed in dairy sections.
Additionally, online retailers like Amazon and Instacart are offering A2 milk products, making it convenient for consumers to purchase from home. This enhanced visibility not only attracts new customers but also encourages existing consumers to try different A2 milk varieties. As a result, the ease of access fosters trial and repeat purchases, solidifying A2 milk's presence in the market.
Japanese consumers are known for their discerning taste and preference for high-quality, premium food products. A2 lactose-free milk is strategically marketed as a premium offering, highlighting its unique composition of A2 beta-casein protein, which is often associated with better digestibility and fewer gastrointestinal issues.
This emphasis on quality resonates with health-conscious consumers who prioritize nutritional benefits in their dietary choices. Additionally, the premium positioning of A2 milk aligns with Japan's cultural appreciation for craftsmanship and excellence in food production. As a result, consumers are willing to pay a higher price for A2 milk, viewing it as a valuable addition to their health and wellness regimen.
The A2 Milk Company has successfully positioned itself as a leading brand in the Australian dairy market by emphasizing quality and health benefits associated with A2 lactose-free milk. Through targeted marketing campaigns, the company has effectively communicated the unique advantages of A2 milk, such as its digestibility and potential to reduce gastrointestinal discomfort.
This focus on consumer education has fostered trust and loyalty among customers. As a result, A2 lactose-free milk is now viewed as a premium dairy option, appealing to health-conscious consumers. The brand's strong presence in retail and online platforms further enhances its visibility, driving sustained demand in the market.
Professional Recommendations: The Growing Appeal of A2 Milk in Infant Formulas
Segment | Value Share (2025) |
---|---|
Infant Formula (Application) | 21% |
Many infants experience digestive discomfort due to lactose intolerance or sensitivity, prompting parents to seek alternatives that promote digestive health. A2 lactose-free milk, which contains only the A2 beta-casein protein, is often easier for infants to digest compared to regular milk, making it an appealing choice for parents concerned about gastrointestinal issues. This digestibility is particularly important for infants who may struggle with traditional formulas.
Additionally, pediatricians and nutritionists are increasingly recommending A2 lactose-free milk for infants facing difficulties with regular milk digestion. Such professional endorsements carry significant weight with parents, influencing their purchasing decisions and driving demand for A2 lactose-free infant formulas. This combination of health benefits and trusted recommendations positions A2 milk as a preferred option in the market.
Segment | Value Share (2025) |
---|---|
Tetra Packs (Packaging) | 28% |
Tetra packs significantly enhance the appeal of A2 lactose-free milk by providing an airtight seal that extends shelf life without the need for preservatives. This feature is particularly attractive to consumers who prefer products that can be stored for longer periods without compromising quality, making it convenient for households. Additionally, tetra packs are lightweight and easy to handle, facilitating effortless pouring and storage.
This design is especially beneficial for families and individuals with busy lifestyles, as it allows for quick access to nutritious options on the go. The combination of extended shelf life and convenience encourages more consumers to opt for A2 lactose-free milk packaged in tetra packs, aligning with modern preferences for practicality and quality in food products.
Companies are expanding their product lines to include flavored and fortified options, catering to diverse consumer preferences. Additionally, they are investing in sustainable packaging solutions, such as tetra packs, to appeal to eco-conscious consumers. Strong branding and partnerships with retailers and e-commerce platforms further enhance visibility and accessibility, allowing brands to capture a larger market share.
For instance
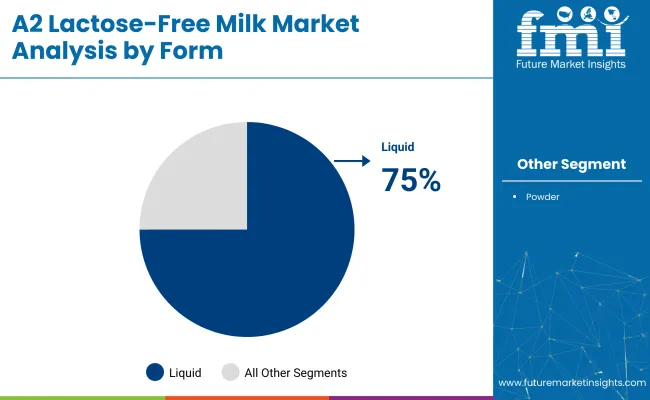
This segment is further categorized into Powder and Liquid.
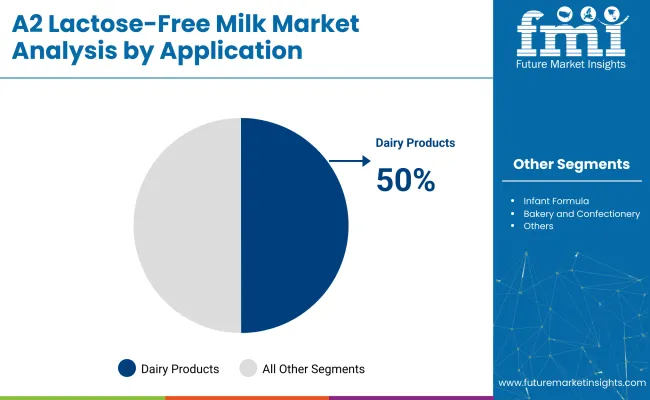
This segment is further categorized into Infant Formula, Dairy Product (Butter, Cheese, Yogurt, Milk Powder, Ice Cream, Others), Bakery and Confectionery and Milk and Milk-based Beverages.
This segment is further categorized into Tetra Packs, Glass Bottles, Plastic Bottles and Pouches and Cans.
This segment is further categorized into B2B, B2C (Store-based Retailing, Hypermarkets/Supermarkets, Grocery Stores, Convenience Stores, and Specialty Stores) and Online Retailing.
Industry analysis has been carried out in key countries of North America, Latin America, Eastern Europe, Western Europe, East Asia, South Asia & Pacific, Central Asia, Balkan and Baltic Countries, Russia & Belarus and the Middle East & Africa.
Table 1: Global Market Value (US$ million) Forecast by Region, 2018 to 2033
Table 2: Global Market Volume (MT) Forecast by Region, 2018 to 2033
Table 3: Global Market Value (US$ million) Forecast by Form, 2018 to 2033
Table 4: Global Market Volume (MT) Forecast by Form, 2018 to 2033
Table 5: Global Market Value (US$ million) Forecast by Application, 2018 to 2033
Table 6: Global Market Volume (MT) Forecast by Application, 2018 to 2033
Table 7: Global Market Value (US$ million) Forecast by Packaging, 2018 to 2033
Table 8: Global Market Volume (MT) Forecast by Packaging, 2018 to 2033
Table 9: Global Market Value (US$ million) Forecast by Distribution Channel, 2018 to 2033
Table 10: Global Market Volume (MT) Forecast by Distribution Channel, 2018 to 2033
Table 11: North America Market Value (US$ million) Forecast by Country, 2018 to 2033
Table 12: North America Market Volume (MT) Forecast by Country, 2018 to 2033
Table 13: North America Market Value (US$ million) Forecast by Form, 2018 to 2033
Table 14: North America Market Volume (MT) Forecast by Form, 2018 to 2033
Table 15: North America Market Value (US$ million) Forecast by Application, 2018 to 2033
Table 16: North America Market Volume (MT) Forecast by Application, 2018 to 2033
Table 17: North America Market Value (US$ million) Forecast by Packaging, 2018 to 2033
Table 18: North America Market Volume (MT) Forecast by Packaging, 2018 to 2033
Table 19: North America Market Value (US$ million) Forecast by Distribution Channel, 2018 to 2033
Table 20: North America Market Volume (MT) Forecast by Distribution Channel, 2018 to 2033
Table 21: Latin America Market Value (US$ million) Forecast by Country, 2018 to 2033
Table 22: Latin America Market Volume (MT) Forecast by Country, 2018 to 2033
Table 23: Latin America Market Value (US$ million) Forecast by Form, 2018 to 2033
Table 24: Latin America Market Volume (MT) Forecast by Form, 2018 to 2033
Table 25: Latin America Market Value (US$ million) Forecast by Application, 2018 to 2033
Table 26: Latin America Market Volume (MT) Forecast by Application, 2018 to 2033
Table 27: Latin America Market Value (US$ million) Forecast by Packaging, 2018 to 2033
Table 28: Latin America Market Volume (MT) Forecast by Packaging, 2018 to 2033
Table 29: Latin America Market Value (US$ million) Forecast by Distribution Channel, 2018 to 2033
Table 30: Latin America Market Volume (MT) Forecast by Distribution Channel, 2018 to 2033
Table 31: Europe Market Value (US$ million) Forecast by Country, 2018 to 2033
Table 32: Europe Market Volume (MT) Forecast by Country, 2018 to 2033
Table 33: Europe Market Value (US$ million) Forecast by Form, 2018 to 2033
Table 34: Europe Market Volume (MT) Forecast by Form, 2018 to 2033
Table 35: Europe Market Value (US$ million) Forecast by Application, 2018 to 2033
Table 36: Europe Market Volume (MT) Forecast by Application, 2018 to 2033
Table 37: Europe Market Value (US$ million) Forecast by Packaging, 2018 to 2033
Table 38: Europe Market Volume (MT) Forecast by Packaging, 2018 to 2033
Table 39: Europe Market Value (US$ million) Forecast by Distribution Channel, 2018 to 2033
Table 40: Europe Market Volume (MT) Forecast by Distribution Channel, 2018 to 2033
Table 41: East Asia Market Value (US$ million) Forecast by Country, 2018 to 2033
Table 42: East Asia Market Volume (MT) Forecast by Country, 2018 to 2033
Table 43: East Asia Market Value (US$ million) Forecast by Form, 2018 to 2033
Table 44: East Asia Market Volume (MT) Forecast by Form, 2018 to 2033
Table 45: East Asia Market Value (US$ million) Forecast by Application, 2018 to 2033
Table 46: East Asia Market Volume (MT) Forecast by Application, 2018 to 2033
Table 47: East Asia Market Value (US$ million) Forecast by Packaging, 2018 to 2033
Table 48: East Asia Market Volume (MT) Forecast by Packaging, 2018 to 2033
Table 49: East Asia Market Value (US$ million) Forecast by Distribution Channel, 2018 to 2033
Table 50: East Asia Market Volume (MT) Forecast by Distribution Channel, 2018 to 2033
Table 51: South Asia Market Value (US$ million) Forecast by Country, 2018 to 2033
Table 52: South Asia Market Volume (MT) Forecast by Country, 2018 to 2033
Table 53: South Asia Market Value (US$ million) Forecast by Form, 2018 to 2033
Table 54: South Asia Market Volume (MT) Forecast by Form, 2018 to 2033
Table 55: South Asia Market Value (US$ million) Forecast by Application, 2018 to 2033
Table 56: South Asia Market Volume (MT) Forecast by Application, 2018 to 2033
Table 57: South Asia Market Value (US$ million) Forecast by Packaging, 2018 to 2033
Table 58: South Asia Market Volume (MT) Forecast by Packaging, 2018 to 2033
Table 59: South Asia Market Value (US$ million) Forecast by Distribution Channel, 2018 to 2033
Table 60: South Asia Market Volume (MT) Forecast by Distribution Channel, 2018 to 2033
Table 61: Oceania Market Value (US$ million) Forecast by Country, 2018 to 2033
Table 62: Oceania Market Volume (MT) Forecast by Country, 2018 to 2033
Table 63: Oceania Market Value (US$ million) Forecast by Form, 2018 to 2033
Table 64: Oceania Market Volume (MT) Forecast by Form, 2018 to 2033
Table 65: Oceania Market Value (US$ million) Forecast by Application, 2018 to 2033
Table 66: Oceania Market Volume (MT) Forecast by Application, 2018 to 2033
Table 67: Oceania Market Value (US$ million) Forecast by Packaging, 2018 to 2033
Table 68: Oceania Market Volume (MT) Forecast by Packaging, 2018 to 2033
Table 69: Oceania Market Value (US$ million) Forecast by Distribution Channel, 2018 to 2033
Table 70: Oceania Market Volume (MT) Forecast by Distribution Channel, 2018 to 2033
Table 71: Middle East and Africa Market Value (US$ million) Forecast by Country, 2018 to 2033
Table 72: Middle East and Africa Market Volume (MT) Forecast by Country, 2018 to 2033
Table 73: Middle East and Africa Market Value (US$ million) Forecast by Form, 2018 to 2033
Table 74: Middle East and Africa Market Volume (MT) Forecast by Form, 2018 to 2033
Table 75: Middle East and Africa Market Value (US$ million) Forecast by Application, 2018 to 2033
Table 76: Middle East and Africa Market Volume (MT) Forecast by Application, 2018 to 2033
Table 77: Middle East and Africa Market Value (US$ million) Forecast by Packaging, 2018 to 2033
Table 78: Middle East and Africa Market Volume (MT) Forecast by Packaging, 2018 to 2033
Table 79: Middle East and Africa Market Value (US$ million) Forecast by Distribution Channel, 2018 to 2033
Table 80: Middle East and Africa Market Volume (MT) Forecast by Distribution Channel, 2018 to 2033
Figure 1: Global Market Value (US$ million) by Form, 2023 to 2033
Figure 2: Global Market Value (US$ million) by Application, 2023 to 2033
Figure 3: Global Market Value (US$ million) by Packaging, 2023 to 2033
Figure 4: Global Market Value (US$ million) by Distribution Channel, 2023 to 2033
Figure 5: Global Market Value (US$ million) by Region, 2023 to 2033
Figure 6: Global Market Value (US$ million) Analysis by Region, 2018 to 2033
Figure 7: Global Market Volume (MT) Analysis by Region, 2018 to 2033
Figure 8: Global Market Value Share (%) and BPS Analysis by Region, 2023 to 2033
Figure 9: Global Market Y-o-Y Growth (%) Projections by Region, 2023 to 2033
Figure 10: Global Market Value (US$ million) Analysis by Form, 2018 to 2033
Figure 11: Global Market Volume (MT) Analysis by Form, 2018 to 2033
Figure 12: Global Market Value Share (%) and BPS Analysis by Form, 2023 to 2033
Figure 13: Global Market Y-o-Y Growth (%) Projections by Form, 2023 to 2033
Figure 14: Global Market Value (US$ million) Analysis by Application, 2018 to 2033
Figure 15: Global Market Volume (MT) Analysis by Application, 2018 to 2033
Figure 16: Global Market Value Share (%) and BPS Analysis by Application, 2023 to 2033
Figure 18: Global Market Y-o-Y Growth (%) Projections by Application, 2023 to 2033
Figure 18: Global Market Value (US$ million) Analysis by Packaging, 2018 to 2033
Figure 19: Global Market Volume (MT) Analysis by Packaging, 2018 to 2033
Figure 20: Global Market Value Share (%) and BPS Analysis by Packaging, 2023 to 2033
Figure 22: Global Market Y-o-Y Growth (%) Projections by Packaging, 2023 to 2033
Figure 23: Global Market Value (US$ million) Analysis by Distribution Channel, 2018 to 2033
Figure 23: Global Market Volume (MT) Analysis by Distribution Channel, 2018 to 2033
Figure 24: Global Market Value Share (%) and BPS Analysis by Distribution Channel, 2023 to 2033
Figure 25: Global Market Y-o-Y Growth (%) Projections by Distribution Channel, 2023 to 2033
Figure 26: Global Market Attractiveness by Form, 2023 to 2033
Figure 27: Global Market Attractiveness by Application, 2023 to 2033
Figure 28: Global Market Attractiveness by Packaging, 2023 to 2033
Figure 29: Global Market Attractiveness by Distribution Channel, 2023 to 2033
Figure 30: Global Market Attractiveness by Region, 2023 to 2033
Figure 31: North America Market Value (US$ million) by Form, 2023 to 2033
Figure 33: North America Market Value (US$ million) by Application, 2023 to 2033
Figure 33: North America Market Value (US$ million) by Packaging, 2023 to 2033
Figure 34: North America Market Value (US$ million) by Distribution Channel, 2023 to 2033
Figure 35: North America Market Value (US$ million) by Country, 2023 to 2033
Figure 36: North America Market Value (US$ million) Analysis by Country, 2018 to 2033
Figure 37: North America Market Volume (MT) Analysis by Country, 2018 to 2033
Figure 38: North America Market Value Share (%) and BPS Analysis by Country, 2023 to 2033
Figure 39: North America Market Y-o-Y Growth (%) Projections by Country, 2023 to 2033
Figure 40: North America Market Value (US$ million) Analysis by Form, 2018 to 2033
Figure 41: North America Market Volume (MT) Analysis by Form, 2018 to 2033
Figure 42: North America Market Value Share (%) and BPS Analysis by Form, 2023 to 2033
Figure 43: North America Market Y-o-Y Growth (%) Projections by Form, 2023 to 2033
Figure 44: North America Market Value (US$ million) Analysis by Application, 2018 to 2033
Figure 45: North America Market Volume (MT) Analysis by Application, 2018 to 2033
Figure 46: North America Market Value Share (%) and BPS Analysis by Application, 2023 to 2033
Figure 47: North America Market Y-o-Y Growth (%) Projections by Application, 2023 to 2033
Figure 48: North America Market Value (US$ million) Analysis by Packaging, 2018 to 2033
Figure 49: North America Market Volume (MT) Analysis by Packaging, 2018 to 2033
Figure 50: North America Market Value Share (%) and BPS Analysis by Packaging, 2023 to 2033
Figure 51: North America Market Y-o-Y Growth (%) Projections by Packaging, 2023 to 2033
Figure 52: North America Market Value (US$ million) Analysis by Distribution Channel, 2018 to 2033
Figure 53: North America Market Volume (MT) Analysis by Distribution Channel, 2018 to 2033
Figure 54: North America Market Value Share (%) and BPS Analysis by Distribution Channel, 2023 to 2033
Figure 55: North America Market Y-o-Y Growth (%) Projections by Distribution Channel, 2023 to 2033
Figure 56: North America Market Attractiveness by Form, 2023 to 2033
Figure 57: North America Market Attractiveness by Application, 2023 to 2033
Figure 58: North America Market Attractiveness by Packaging, 2023 to 2033
Figure 59: North America Market Attractiveness by Distribution Channel, 2023 to 2033
Figure 60: North America Market Attractiveness by Country, 2023 to 2033
Figure 61: Latin America Market Value (US$ million) by Form, 2023 to 2033
Figure 62: Latin America Market Value (US$ million) by Application, 2023 to 2033
Figure 63: Latin America Market Value (US$ million) by Packaging, 2023 to 2033
Figure 64: Latin America Market Value (US$ million) by Distribution Channel, 2023 to 2033
Figure 65: Latin America Market Value (US$ million) by Country, 2023 to 2033
Figure 66: Latin America Market Value (US$ million) Analysis by Country, 2018 to 2033
Figure 67: Latin America Market Volume (MT) Analysis by Country, 2018 to 2033
Figure 68: Latin America Market Value Share (%) and BPS Analysis by Country, 2023 to 2033
Figure 69: Latin America Market Y-o-Y Growth (%) Projections by Country, 2023 to 2033
Figure 70: Latin America Market Value (US$ million) Analysis by Form, 2018 to 2033
Figure 71: Latin America Market Volume (MT) Analysis by Form, 2018 to 2033
Figure 72: Latin America Market Value Share (%) and BPS Analysis by Form, 2023 to 2033
Figure 73: Latin America Market Y-o-Y Growth (%) Projections by Form, 2023 to 2033
Figure 74: Latin America Market Value (US$ million) Analysis by Application, 2018 to 2033
Figure 75: Latin America Market Volume (MT) Analysis by Application, 2018 to 2033
Figure 76: Latin America Market Value Share (%) and BPS Analysis by Application, 2023 to 2033
Figure 77: Latin America Market Y-o-Y Growth (%) Projections by Application, 2023 to 2033
Figure 78: Latin America Market Value (US$ million) Analysis by Packaging, 2018 to 2033
Figure 79: Latin America Market Volume (MT) Analysis by Packaging, 2018 to 2033
Figure 80: Latin America Market Value Share (%) and BPS Analysis by Packaging, 2023 to 2033
Figure 81: Latin America Market Y-o-Y Growth (%) Projections by Packaging, 2023 to 2033
Figure 82: Latin America Market Value (US$ million) Analysis by Distribution Channel, 2018 to 2033
Figure 83: Latin America Market Volume (MT) Analysis by Distribution Channel, 2018 to 2033
Figure 84: Latin America Market Value Share (%) and BPS Analysis by Distribution Channel, 2023 to 2033
Figure 85: Latin America Market Y-o-Y Growth (%) Projections by Distribution Channel, 2023 to 2033
Figure 86: Latin America Market Attractiveness by Form, 2023 to 2033
Figure 87: Latin America Market Attractiveness by Application, 2023 to 2033
Figure 88: Latin America Market Attractiveness by Packaging, 2023 to 2033
Figure 89: Latin America Market Attractiveness by Distribution Channel, 2023 to 2033
Figure 90: Latin America Market Attractiveness by Country, 2023 to 2033
Figure 91: Europe Market Value (US$ million) by Form, 2023 to 2033
Figure 92: Europe Market Value (US$ million) by Application, 2023 to 2033
Figure 93: Europe Market Value (US$ million) by Packaging, 2023 to 2033
Figure 94: Europe Market Value (US$ million) by Distribution Channel, 2023 to 2033
Figure 95: Europe Market Value (US$ million) by Country, 2023 to 2033
Figure 96: Europe Market Value (US$ million) Analysis by Country, 2018 to 2033
Figure 97: Europe Market Volume (MT) Analysis by Country, 2018 to 2033
Figure 98: Europe Market Value Share (%) and BPS Analysis by Country, 2023 to 2033
Figure 99: Europe Market Y-o-Y Growth (%) Projections by Country, 2023 to 2033
Figure 100: Europe Market Value (US$ million) Analysis by Form, 2018 to 2033
Figure 101: Europe Market Volume (MT) Analysis by Form, 2018 to 2033
Figure 102: Europe Market Value Share (%) and BPS Analysis by Form, 2023 to 2033
Figure 103: Europe Market Y-o-Y Growth (%) Projections by Form, 2023 to 2033
Figure 104: Europe Market Value (US$ million) Analysis by Application, 2018 to 2033
Figure 105: Europe Market Volume (MT) Analysis by Application, 2018 to 2033
Figure 106: Europe Market Value Share (%) and BPS Analysis by Application, 2023 to 2033
Figure 107: Europe Market Y-o-Y Growth (%) Projections by Application, 2023 to 2033
Figure 108: Europe Market Value (US$ million) Analysis by Packaging, 2018 to 2033
Figure 109: Europe Market Volume (MT) Analysis by Packaging, 2018 to 2033
Figure 110: Europe Market Value Share (%) and BPS Analysis by Packaging, 2023 to 2033
Figure 111: Europe Market Y-o-Y Growth (%) Projections by Packaging, 2023 to 2033
Figure 112: Europe Market Value (US$ million) Analysis by Distribution Channel, 2018 to 2033
Figure 113: Europe Market Volume (MT) Analysis by Distribution Channel, 2018 to 2033
Figure 114: Europe Market Value Share (%) and BPS Analysis by Distribution Channel, 2023 to 2033
Figure 115: Europe Market Y-o-Y Growth (%) Projections by Distribution Channel, 2023 to 2033
Figure 116: Europe Market Attractiveness by Form, 2023 to 2033
Figure 118: Europe Market Attractiveness by Application, 2023 to 2033
Figure 118: Europe Market Attractiveness by Packaging, 2023 to 2033
Figure 119: Europe Market Attractiveness by Distribution Channel, 2023 to 2033
Figure 120: Europe Market Attractiveness by Country, 2023 to 2033
Figure 122: East Asia Market Value (US$ million) by Form, 2023 to 2033
Figure 123: East Asia Market Value (US$ million) by Application, 2023 to 2033
Figure 123: East Asia Market Value (US$ million) by Packaging, 2023 to 2033
Figure 124: East Asia Market Value (US$ million) by Distribution Channel, 2023 to 2033
Figure 125: East Asia Market Value (US$ million) by Country, 2023 to 2033
Figure 126: East Asia Market Value (US$ million) Analysis by Country, 2018 to 2033
Figure 127: East Asia Market Volume (MT) Analysis by Country, 2018 to 2033
Figure 128: East Asia Market Value Share (%) and BPS Analysis by Country, 2023 to 2033
Figure 129: East Asia Market Y-o-Y Growth (%) Projections by Country, 2023 to 2033
Figure 130: East Asia Market Value (US$ million) Analysis by Form, 2018 to 2033
Figure 131: East Asia Market Volume (MT) Analysis by Form, 2018 to 2033
Figure 133: East Asia Market Value Share (%) and BPS Analysis by Form, 2023 to 2033
Figure 133: East Asia Market Y-o-Y Growth (%) Projections by Form, 2023 to 2033
Figure 134: East Asia Market Value (US$ million) Analysis by Application, 2018 to 2033
Figure 135: East Asia Market Volume (MT) Analysis by Application, 2018 to 2033
Figure 136: East Asia Market Value Share (%) and BPS Analysis by Application, 2023 to 2033
Figure 137: East Asia Market Y-o-Y Growth (%) Projections by Application, 2023 to 2033
Figure 138: East Asia Market Value (US$ million) Analysis by Packaging, 2018 to 2033
Figure 139: East Asia Market Volume (MT) Analysis by Packaging, 2018 to 2033
Figure 140: East Asia Market Value Share (%) and BPS Analysis by Packaging, 2023 to 2033
Figure 141: East Asia Market Y-o-Y Growth (%) Projections by Packaging, 2023 to 2033
Figure 142: East Asia Market Value (US$ million) Analysis by Distribution Channel, 2018 to 2033
Figure 143: East Asia Market Volume (MT) Analysis by Distribution Channel, 2018 to 2033
Figure 144: East Asia Market Value Share (%) and BPS Analysis by Distribution Channel, 2023 to 2033
Figure 145: East Asia Market Y-o-Y Growth (%) Projections by Distribution Channel, 2023 to 2033
Figure 146: East Asia Market Attractiveness by Form, 2023 to 2033
Figure 147: East Asia Market Attractiveness by Application, 2023 to 2033
Figure 148: East Asia Market Attractiveness by Packaging, 2023 to 2033
Figure 149: East Asia Market Attractiveness by Distribution Channel, 2023 to 2033
Figure 150: East Asia Market Attractiveness by Country, 2023 to 2033
Figure 151: South Asia Market Value (US$ million) by Form, 2023 to 2033
Figure 152: South Asia Market Value (US$ million) by Application, 2023 to 2033
Figure 153: South Asia Market Value (US$ million) by Packaging, 2023 to 2033
Figure 154: South Asia Market Value (US$ million) by Distribution Channel, 2023 to 2033
Figure 155: South Asia Market Value (US$ million) by Country, 2023 to 2033
Figure 156: South Asia Market Value (US$ million) Analysis by Country, 2018 to 2033
Figure 157: South Asia Market Volume (MT) Analysis by Country, 2018 to 2033
Figure 158: South Asia Market Value Share (%) and BPS Analysis by Country, 2023 to 2033
Figure 159: South Asia Market Y-o-Y Growth (%) Projections by Country, 2023 to 2033
Figure 160: South Asia Market Value (US$ million) Analysis by Form, 2018 to 2033
Figure 161: South Asia Market Volume (MT) Analysis by Form, 2018 to 2033
Figure 162: South Asia Market Value Share (%) and BPS Analysis by Form, 2023 to 2033
Figure 163: South Asia Market Y-o-Y Growth (%) Projections by Form, 2023 to 2033
Figure 164: South Asia Market Value (US$ million) Analysis by Application, 2018 to 2033
Figure 165: South Asia Market Volume (MT) Analysis by Application, 2018 to 2033
Figure 166: South Asia Market Value Share (%) and BPS Analysis by Application, 2023 to 2033
Figure 167: South Asia Market Y-o-Y Growth (%) Projections by Application, 2023 to 2033
Figure 168: South Asia Market Value (US$ million) Analysis by Packaging, 2018 to 2033
Figure 169: South Asia Market Volume (MT) Analysis by Packaging, 2018 to 2033
Figure 180: South Asia Market Value Share (%) and BPS Analysis by Packaging, 2023 to 2033
Figure 181: South Asia Market Y-o-Y Growth (%) Projections by Packaging, 2023 to 2033
Figure 182: South Asia Market Value (US$ million) Analysis by Distribution Channel, 2018 to 2033
Figure 183: South Asia Market Volume (MT) Analysis by Distribution Channel, 2018 to 2033
Figure 184: South Asia Market Value Share (%) and BPS Analysis by Distribution Channel, 2023 to 2033
Figure 185: South Asia Market Y-o-Y Growth (%) Projections by Distribution Channel, 2023 to 2033
Figure 186: South Asia Market Attractiveness by Form, 2023 to 2033
Figure 187: South Asia Market Attractiveness by Application, 2023 to 2033
Figure 188: South Asia Market Attractiveness by Packaging, 2023 to 2033
Figure 189: South Asia Market Attractiveness by Distribution Channel, 2023 to 2033
Figure 180: South Asia Market Attractiveness by Country, 2023 to 2033
Figure 181: Oceania Market Value (US$ million) by Form, 2023 to 2033
Figure 182: Oceania Market Value (US$ million) by Application, 2023 to 2033
Figure 183: Oceania Market Value (US$ million) by Packaging, 2023 to 2033
Figure 184: Oceania Market Value (US$ million) by Distribution Channel, 2023 to 2033
Figure 185: Oceania Market Value (US$ million) by Country, 2023 to 2033
Figure 186: Oceania Market Value (US$ million) Analysis by Country, 2018 to 2033
Figure 187: Oceania Market Volume (MT) Analysis by Country, 2018 to 2033
Figure 188: Oceania Market Value Share (%) and BPS Analysis by Country, 2023 to 2033
Figure 189: Oceania Market Y-o-Y Growth (%) Projections by Country, 2023 to 2033
Figure 190: Oceania Market Value (US$ million) Analysis by Form, 2018 to 2033
Figure 191: Oceania Market Volume (MT) Analysis by Form, 2018 to 2033
Figure 192: Oceania Market Value Share (%) and BPS Analysis by Form, 2023 to 2033
Figure 193: Oceania Market Y-o-Y Growth (%) Projections by Form, 2023 to 2033
Figure 194: Oceania Market Value (US$ million) Analysis by Application, 2018 to 2033
Figure 195: Oceania Market Volume (MT) Analysis by Application, 2018 to 2033
Figure 196: Oceania Market Value Share (%) and BPS Analysis by Application, 2023 to 2033
Figure 197: Oceania Market Y-o-Y Growth (%) Projections by Application, 2023 to 2033
Figure 198: Oceania Market Value (US$ million) Analysis by Packaging, 2018 to 2033
Figure 199: Oceania Market Volume (MT) Analysis by Packaging, 2018 to 2033
Figure 200: Oceania Market Value Share (%) and BPS Analysis by Packaging, 2023 to 2033
Figure 201: Oceania Market Y-o-Y Growth (%) Projections by Packaging, 2023 to 2033
Figure 202: Oceania Market Value (US$ million) Analysis by Distribution Channel, 2018 to 2033
Figure 203: Oceania Market Volume (MT) Analysis by Distribution Channel, 2018 to 2033
Figure 204: Oceania Market Value Share (%) and BPS Analysis by Distribution Channel, 2023 to 2033
Figure 205: Oceania Market Y-o-Y Growth (%) Projections by Distribution Channel, 2023 to 2033
Figure 206: Oceania Market Attractiveness by Form, 2023 to 2033
Figure 207: Oceania Market Attractiveness by Application, 2023 to 2033
Figure 208: Oceania Market Attractiveness by Packaging, 2023 to 2033
Figure 209: Oceania Market Attractiveness by Distribution Channel, 2023 to 2033
Figure 220: Oceania Market Attractiveness by Country, 2023 to 2033
Figure 221: Middle East and Africa Market Value (US$ million) by Form, 2023 to 2033
Figure 222: Middle East and Africa Market Value (US$ million) by Application, 2023 to 2033
Figure 223: Middle East and Africa Market Value (US$ million) by Packaging, 2023 to 2033
Figure 224: Middle East and Africa Market Value (US$ million) by Distribution Channel, 2023 to 2033
Figure 225: Middle East and Africa Market Value (US$ million) by Country, 2023 to 2033
Figure 226: Middle East and Africa Market Value (US$ million) Analysis by Country, 2018 to 2033
Figure 227: Middle East and Africa Market Volume (MT) Analysis by Country, 2018 to 2033
Figure 228: Middle East and Africa Market Value Share (%) and BPS Analysis by Country, 2023 to 2033
Figure 229: Middle East and Africa Market Y-o-Y Growth (%) Projections by Country, 2023 to 2033
Figure 230: Middle East and Africa Market Value (US$ million) Analysis by Form, 2018 to 2033
Figure 231: Middle East and Africa Market Volume (MT) Analysis by Form, 2018 to 2033
Figure 233: Middle East and Africa Market Value Share (%) and BPS Analysis by Form, 2023 to 2033
Figure 233: Middle East and Africa Market Y-o-Y Growth (%) Projections by Form, 2023 to 2033
Figure 234: Middle East and Africa Market Value (US$ million) Analysis by Application, 2018 to 2033
Figure 235: Middle East and Africa Market Volume (MT) Analysis by Application, 2018 to 2033
Figure 236: Middle East and Africa Market Value Share (%) and BPS Analysis by Application, 2023 to 2033
Figure 237: Middle East and Africa Market Y-o-Y Growth (%) Projections by Application, 2023 to 2033
Figure 238: Middle East and Africa Market Value (US$ million) Analysis by Packaging, 2018 to 2033
Figure 239: Middle East and Africa Market Volume (MT) Analysis by Packaging, 2018 to 2033
Figure 230: Middle East and Africa Market Value Share (%) and BPS Analysis by Packaging, 2023 to 2033
Figure 231: Middle East and Africa Market Y-o-Y Growth (%) Projections by Packaging, 2023 to 2033
Figure 233: Middle East and Africa Market Value (US$ million) Analysis by Distribution Channel, 2018 to 2033
Figure 233: Middle East and Africa Market Volume (MT) Analysis by Distribution Channel, 2018 to 2033
Figure 234: Middle East and Africa Market Value Share (%) and BPS Analysis by Distribution Channel, 2023 to 2033
Figure 235: Middle East and Africa Market Y-o-Y Growth (%) Projections by Distribution Channel, 2023 to 2033
Figure 236: Middle East and Africa Market Attractiveness by Form, 2023 to 2033
Figure 237: Middle East and Africa Market Attractiveness by Application, 2023 to 2033
Figure 238: Middle East and Africa Market Attractiveness by Packaging, 2023 to 2033
Figure 239: Middle East and Africa Market Attractiveness by Distribution Channel, 2023 to 2033
Figure 240: Middle East and Africa Market Attractiveness by Country, 2023 to 2033
The global A2 Lactose-free Milk industry is estimated at a value of USD 876.9 million in 2025.
Sales of A2 Lactose-free Milk increased at 19.0% CAGR between 2020 and 2024.
Shoonya Farms, Horizon Organic, The a2 Milk Company, Fonterra, Provilac Dairy Farms Private Limited are some of the leading players in this industry.
The South Asia domain is projected to hold a revenue share of 29% over the forecast period.
North America holds 33% share of the global demand space for Intensive Sweeteners.
Explore Similar Insights
Thank you!
You will receive an email from our Business Development Manager. Please be sure to check your SPAM/JUNK folder too.