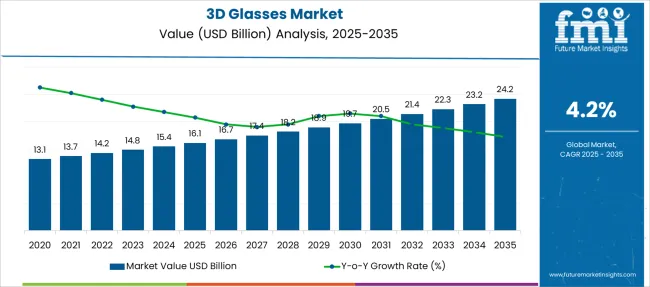
The 3D Glasses Market is estimated to be valued at USD 16.1 billion in 2025 and is projected to reach USD 24.2 billion by 2035, registering a compound annual growth rate (CAGR) of 4.2% over the forecast period.
| Metric | Value |
|---|---|
| 3D Glasses Market Estimated Value in (2025 E) | USD 16.1 billion |
| 3D Glasses Market Forecast Value in (2035 F) | USD 24.2 billion |
| Forecast CAGR (2025 to 2035) | 4.2% |
The 3D glasses market is advancing steadily due to increasing adoption of immersive visual technologies across entertainment, consumer electronics, and mobile platforms. With the growing demand for enhanced user experiences in gaming, virtual reality, and mobile media streaming, manufacturers are focusing on developing lightweight, cost efficient, and high performance 3D viewing solutions.
The shift toward portable entertainment and mobile content consumption has particularly fueled demand for 3D glasses compatible with smartphones. Innovations in lens technology, polarization filters, and ergonomic designs are further expanding their usability across professional and recreational settings.
As media consumption trends continue to evolve toward interactive and three dimensional formats, the market is positioned for sustainable growth through innovations in display compatibility and user comfort.
The market is segmented by Type and Application and region. By Type, the market is divided into Anaglyph 3D Glasses, Polarized 3D Glasses, and Active Shutter 3D Glasses. In terms of Application, the market is classified into Smartphone, Wearable Device, Televisions, Virtual Reality Headsets, and Others. Regionally, the market is classified into North America, Latin America, Western Europe, Eastern Europe, Balkan & Baltic Countries, Russia & Belarus, Central Asia, East Asia, South Asia & Pacific, and the Middle East & Africa.
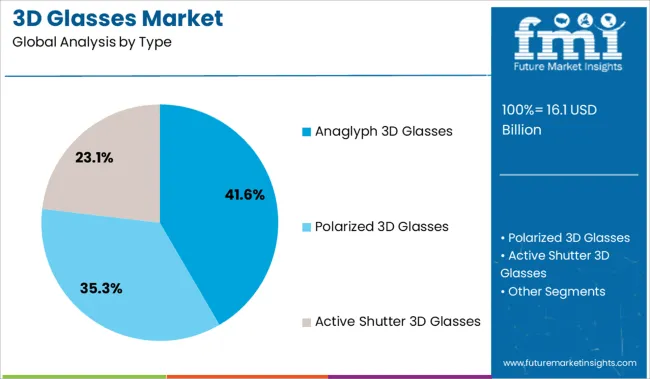
The anaglyph 3D glasses segment is projected to account for 41.60% of the total market revenue by 2025 under the type category, establishing it as the dominant segment. This is primarily due to its cost effectiveness, wide availability, and ease of integration with various content platforms.
The ability to deliver a basic 3D viewing experience without the need for advanced displays or expensive accessories has made anaglyph glasses particularly popular in educational, low budget entertainment, and promotional use cases. Additionally, the simplicity of the red and cyan lens system supports compatibility with a broad range of digital and printed media.
As accessibility and affordability remain key purchase drivers, this type of 3D glasses continues to maintain a significant market position.
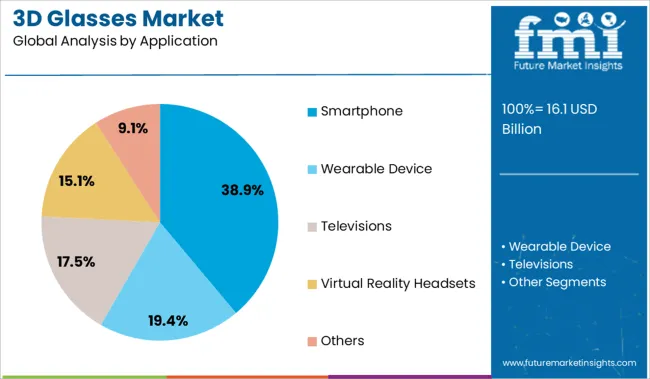
The smartphone application segment is expected to hold 38.90% of the total revenue by 2025, making it the leading application category. This is driven by the global surge in mobile media consumption, increased interest in mobile gaming, and the integration of 3D content within smartphone ecosystems.
Consumers are seeking portable and immersive viewing tools that enhance visual engagement without requiring fixed setups or large screens. Technological developments in smartphone displays and the growing availability of compatible 3D content are reinforcing adoption.
The convenience of using 3D glasses with smartphones for on the go entertainment, educational apps, and augmented experiences has contributed to the rise of this segment as the primary growth driver in the market.
The crucial factors that are predicted to impact the market's growth positively are the rising use of 3D glasses in the military, healthcare sector, education, and entertainment industry. Due to its many applications, including robotic surgery, phobia treatment, and surgery simulation, the healthcare industry is one of the biggest users of 3D glasses.
Additionally, 3D glasses offer significantly more accurate MRI scan reports. As a result, over the forecast period, the growing use of 3D virtual reality glasses in the healthcare sector, which is evolving at an exponential rate, is likely to boost the sales of 3D glasses.
Studying the history and geographical features of significant locations in various countries without having to travel there using 3D glasses motivates educational sectors to adopt the use of 3D glasses for improved learning.
Given that smartphones and the less expensive 3D glasses can be easily connected, the rise in smartphone usage is a significant factor in the market's expansion. Additionally, these glasses' compatibility with smartphones protects the wearer's freedom of movement.
The market is expanding rapidly as a result of the rising demand for 3D movie glasses. The popularity of 3D movies is spurring demand for high-end, individual 3D spectacles. The market for 3D glasses is also being influenced by the evolving trends in home theatre technology. To improve their experience, consumers are willing to spend extra on 3D eyewear.
The growing use of virtual reality (VR) technology is one trend that is anticipated to have a big impact on the market for 3D glasses in the future. Many gamers and other tech-savvy customers believe that VR headsets are the future of entertainment, and their popularity is growing. This could result in a situation where people favor more immersive VR experiences over traditional 2D TV and movie material.
| Report Attribute | Details |
|---|---|
| 3D Glasses Market Value (2025) | USD 14.81 billion |
| 3D Glasses Market Anticipated Value (2035) | USD 22.23 billion |
| 3D Glasses Market CAGR (2025 to 2035) | 4.16% |
The market for 3D glasses was worth USD 13.1 billion in 2020. With a CAGR of 3.65%, the market surpassed a valuation of USD 16.1 billion by 2025.
The increasing accessibility of technologically advanced computing devices, the rising internet penetration in various emerging regions, the ease of access to TV channels and internet services like on-demand content and catch-up services, the growing consumer interest in 3D viewing in emerging countries, the declining price of 3D TVs driving the adoption of 3D glasses, and other important factors are some of the main ones that are projected to likely have an impact on the adoption of 3D TVs.
| Attribute | Valuation |
|---|---|
| 2025 | USD 16.73 |
| 2035 | USD 18.89 billion |
| 2035 | USD 22.16 billion |
The market is anticipated to grow at a CAGR of 4.16% from 2025 to 2035, surpassing USD 24.2 billion by 2035.
The active shutter market segment is likely to dominate since it is utilized to view consumer 3D TVs and 3D projectors and creates a 3D effect for an image when used with 3D glasses. The market for 3D glasses has application segments for smartphones, wearable technology, televisions, and virtual reality headsets.
Due to the growing use of applications on 3D TVs and 3D laptops as a result of the broad appeal of 3D shows, movies, and games, the media segment is likely to account for the lion's share of the market's growth.
The smartphone segment is anticipated to have the most significant market share in the forecast period by application. A rise in the production of 3D smartphones with 3D display applications by various manufacturing businesses globally is fueling the development of the 3D glass market.
For example, a number of the top smartphone manufacturers, including Samsung, Vivo, Huawei, Xiaomi, and Coolpad, have begun to create 3D smartphones and release high-end smartphones with 3D cover glass. The market is expanding as a result of the increase in 3D film production as well as the widespread use of 3D glasses in home theatres.
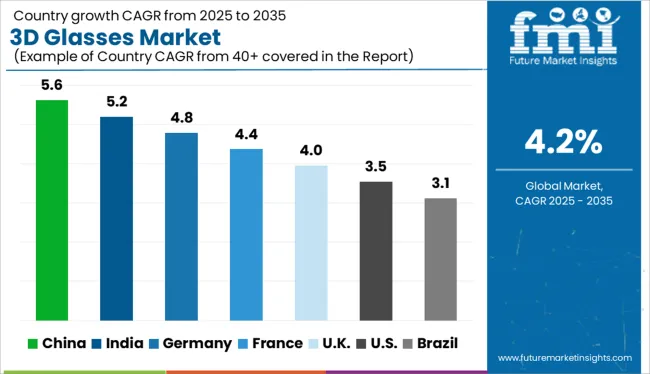
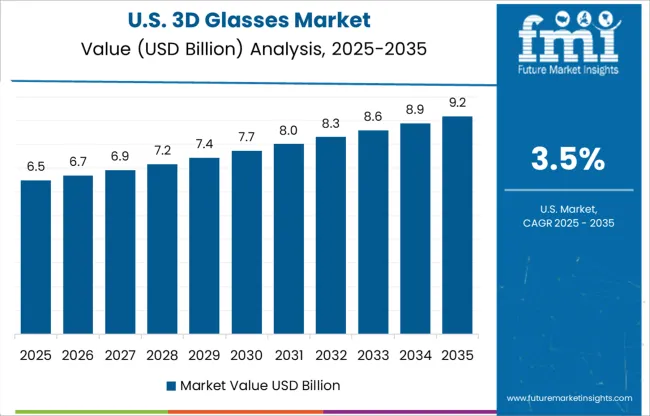
The market for 3D glasses in the United States surpassed USD 15.4 billion in 2024. The USA also has a strong culture of innovation and early acceptance of new technology, which has contributed to the country's high demand for 3D glasses.
Going forward, the USA is anticipated to remain a significant contributor to the market for 3D glasses. This is partly a result of the economy and population continuing to expand, as well as the 3D glasses industry continuing to innovate.
California, Texas, Florida, New York, and Illinois are the top 5 states in terms of demand for 3D glasses in the local market. More than half of all 3D glasses purchased in the USA are in these states. The high population density and high level of disposable income in certain states are the causes of this concentration. Additionally, there are more 3D televisions in households in these states than the national average.
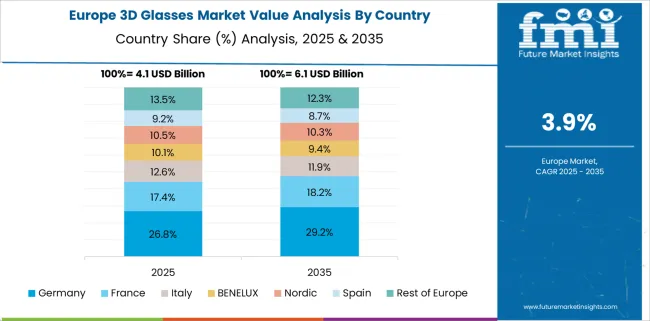
The number of digital 3D displays has increased, leading to an increase in 3D content transmission and an increase in the number of 3D movies produced in the region, which has helped European markets to survive in the 3D glasses industry. Due to the existence of game aficionados and the popularity of 3D TVs for gaming, Germany is predicted to hold the fastest growth rate in the market for 3D glasses.
The growth of the market is significantly influenced by the economies such as Japan. The growth in local customer cell phone usage is a factor in the expansion.
Rising import and export activity, as well as increased research and development into 3D glass technology by different producers, are all contributing to the market's expansion. For example, Japan exported 3D glasses to over 150+ different countries. The data show the potential of Japanese exporters in the global market.
Due to the presence of active players in South Korea, the market in the region is anticipated to grow more rapidly. South Korea’s growing demand for 3D glasses is anticipated to fuel market expansion. The introduction of cutting-edge charging solutions by market participants is a key growth factor. As a result, over the forecast period, Korea is expected to constitute a sizeable portion of the global market.
To increase the reliability of their products, 3D glasses manufacturers compete to supply goods with legitimate approvals and CE and FCC markings. Manufacturers of 3D glasses are competing to offer quick turnaround times for a better client experience.
The manufacturers of 3D glasses are not only concerned with quality certifications; they are also focused on great product performance. The usage of modern 3D glasses with ergonomic designs and high-tech components has significantly increased the demand for high-performance 3D glasses.
To make room for new technology and get rid of the outdated mainstream support of graphic drivers, NVIDIA officially announced in March 2020 that it would upgrade the status of its laptop and mobile 3D vision and Kepler GPUs and get them upgraded to legacy status.
NVIDIA announced on a global platform that it was getting ready to advance the development of its mobile laptop Kepler GPUs while also adding the 3D vision for the legacy status that aids in ending the mainstream graphics driver that renders its support for these products over the long term, especially during the forecast period.
Mobile and tablet gaming is anticipated to develop significantly by 2035 and account for more than 60% of the overall gaming and glass market region. The demand for 3D-capable devices has grown, and these gadgets stream 3D movies and games with the aid of user-friendly interfaces.
| Attribute | Details |
|---|---|
| Forecast period | 2025 to 2035 |
| Historical data available for | 2020 to 2025 |
| Market analysis | USD billion in value |
| Key regions covered | North America; Europe; Asian Pacific |
| Key segments covered | By Type, By Application, By Geography |
| Key companies profiled | NVIDIA; hcbl3d.com; Samsung; JiangXi Holitech Technology Co., Ltd; BYD Electronic Company Limited; Henan Comyoung Electronics Co., Ltd; Corning Inc; Dongguan RBD Technology Co., Ltd; Vivo; Huawei; Xiaomi; Coolpad; G-TECH Optoelectronics Corporation; CPT Technology (Group) Co Ltd; Zhejiang Firstar Panel Technology Co., Ltd; Shenzhen O-film Tech; Triumph Science & Technology Co Ltd; Holitech Technology; Bourne optics; FOXCONN |
The global 3d glasses market is estimated to be valued at USD 16.1 billion in 2025.
The market size for the 3d glasses market is projected to reach USD 24.2 billion by 2035.
The 3d glasses market is expected to grow at a 4.2% CAGR between 2025 and 2035.
The key product types in 3d glasses market are anaglyph 3d glasses, polarized 3d glasses and active shutter 3d glasses.
In terms of application, smartphone segment to command 38.9% share in the 3d glasses market in 2025.


Full Research Suite comprises of:
Market outlook & trends analysis
Interviews & case studies
Strategic recommendations
Vendor profiles & capabilities analysis
5-year forecasts
8 regions and 60+ country-level data splits
Market segment data splits
12 months of continuous data updates
DELIVERED AS:
PDF EXCEL ONLINE
3D Imaging Surgical Solution Market Size and Share Forecast Outlook 2025 to 2035
3D Printing Industry Analysis in Middle East Size and Share Forecast Outlook 2025 to 2035
3D Printed Dental Brace Market Size and Share Forecast Outlook 2025 to 2035
3D Reverse Engineering Software Market Forecast and Outlook 2025 to 2035
3D Automatic Optical Inspection Machine Market Size and Share Forecast Outlook 2025 to 2035
3D Ready Organoid Expansion Service Market Size and Share Forecast Outlook 2025 to 2035
3D-Printed Prosthetic Implants Market Size and Share Forecast Outlook 2025 to 2035
3D Printing Ceramics Market Size and Share Forecast Outlook 2025 to 2035
3D NAND Flash Memory Market Size and Share Forecast Outlook 2025 to 2035
3D Printing Metal Market Size and Share Forecast Outlook 2025 to 2035
3D Bioprinted Organ Transplants Market Size and Share Forecast Outlook 2025 to 2035
3D Mapping and Modeling Market Size and Share Forecast Outlook 2025 to 2035
3D Audio Market Size and Share Forecast Outlook 2025 to 2035
3D Printing in Aerospace and Defense Market Analysis - Size, Share, and Forecast Outlook 2025 to 2035
3D Printed Maxillofacial Implants Market Size and Share Forecast Outlook 2025 to 2035
3D Surgical Microscope Systems Market Size and Share Forecast Outlook 2025 to 2035
3D-Printed Personalized Masks Market Size and Share Forecast Outlook 2025 to 2035
3D Printing Market Size and Share Forecast Outlook 2025 to 2035
3D Printed Packaging Market Size and Share Forecast Outlook 2025 to 2035
3D Printed Clear Dental Aligners Market Size and Share Forecast Outlook 2025 to 2035

Thank you!
You will receive an email from our Business Development Manager. Please be sure to check your SPAM/JUNK folder too.
Chat With
MaRIA